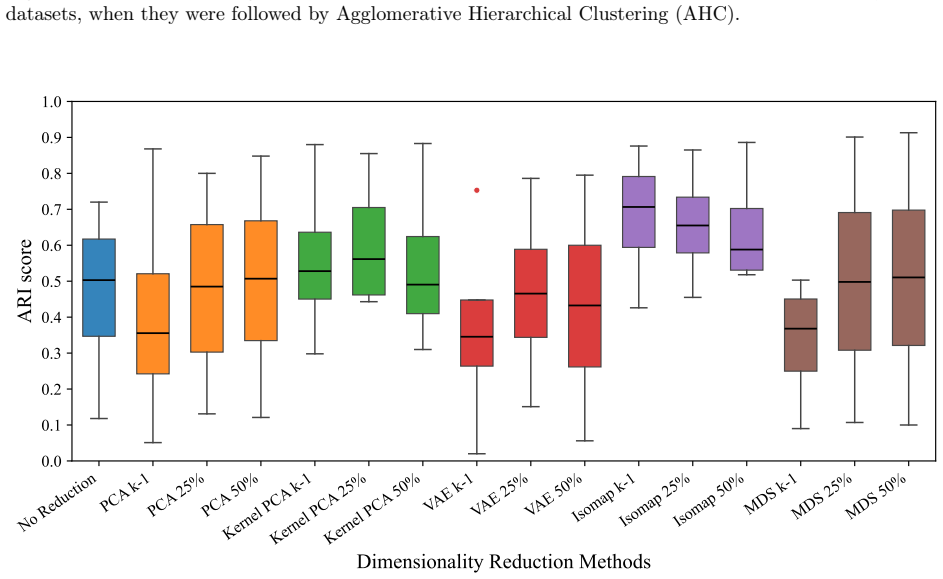
Recognition: no theorem link
Assessing the impact of dimensionality reduction on clustering performance -- a systematic study
Pith reviewed 2026-05-13 06:10 UTC · model grok-4.3
The pith
Dimensionality reduction changes clustering results in ways that require matching the technique and reduction level to the data's geometry and the algorithm.
A machine-rendered reading of the paper's core claim, the machinery that carries it, and where it could break.
Core claim
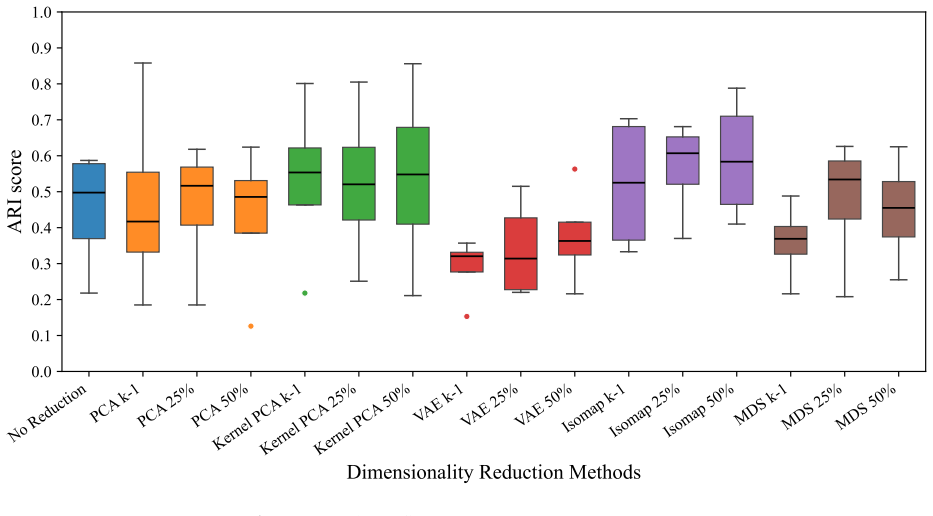
The authors establish that the performance impact of dimensionality reduction on clustering is not uniform: PCA, Kernel PCA, VAE, Isomap, and MDS each interact differently with k-means, agglomerative hierarchical clustering, Gaussian mixture models, and OPTICS depending on the target dimensionality and the intrinsic geometry of the input data. Comparisons without reduction versus reduction at the literature-suggested levels show that quality measured by adjusted Rand index can rise or fall, confirming that practitioners must choose both the reduction technique and the number of retained dimensions with reference to the specific data and clustering method.
What carries the argument
The controlled experimental loop that applies each of the five dimensionality reduction techniques at three literature-recommended target dimensionalities before running each of the four clustering algorithms and scoring the output with adjusted Rand index.
If this is right
- For some algorithm-data pairs, reduction to exactly k-1 dimensions yields the largest gain in adjusted Rand index.
- Kernel-based and manifold methods such as Kernel PCA and Isomap outperform linear PCA on data with nonlinear structure.
- Omitting dimensionality reduction entirely is sometimes preferable to applying a mismatched technique.
- The same reduction level can improve one clustering algorithm while degrading another on identical input data.
Where Pith is reading between the lines
- Practitioners should run a small grid search over reduction methods and levels on a held-out subset before committing to a preprocessing pipeline.
- The results imply that clustering benchmarks that fix a single reduction step may underestimate the best attainable performance for a given algorithm.
- Future work could test whether an automated selector that inspects data geometry metrics can predict the best reduction choice without exhaustive trials.
Load-bearing premise
The tested datasets and the three specific reduction levels drawn from prior literature are representative enough to support general advice on tailoring choices to data geometry.
What would settle it
A new collection of high-dimensional datasets where one fixed reduction choice, such as PCA to 50 percent, produces higher adjusted Rand index than any tailored selection for all four clustering algorithms would falsify the claim that tailoring is required.
Figures


read the original abstract
Dimensionality reduction is a critical preprocessing step for clustering high-dimensional data, yet comprehensive evaluation of its impact across diverse methods and data types remains limited. In this study, we systematically assess the influence of five dimensionality reduction techniques - Principal Component Analysis (PCA), Kernel Principal Component Analysis (Kernel PCA), Variational Autoencoder (VAE), Isometric Mapping (Isomap), and Multidimensional Scaling (MDS) - on the performance of four popular clustering algorithms - k-means, Agglomerative Hierarchical Clustering (AHC), Gaussian Mixture Models (GMM), and Ordering Points to Identify the Clustering Structure (OPTICS). We evaluate clustering quality using the Adjusted Rand Index (ARI), comparing results without and with dimensionality reduction at different reduction levels recommended in the literature (i.e., k-1, where k is the number of clusters, and 25% and 50% of the original number of dimensions). Our findings underscore the importance of a careful selection of the dimensionality reduction technique and the dimensionality reduction level that should be tailored to intrinsic data geometry and clustering algorithms under consideration.
Editorial analysis
A structured set of objections, weighed in public.
Referee Report
Summary. The paper presents a systematic empirical assessment of five dimensionality reduction techniques (PCA, Kernel PCA, VAE, Isomap, MDS) applied to four clustering algorithms (k-means, AHC, GMM, OPTICS), evaluating their impact on clustering quality via the Adjusted Rand Index (ARI) at reduction levels of k-1, 25%, and 50% of the original dimensions, as recommended in the literature. The authors conclude that the selection of DR technique and reduction level should be tailored to the intrinsic geometry of the data and the specific clustering algorithm.
Significance. If substantiated by robust experiments across representative datasets, this work could provide practical insights into preprocessing high-dimensional data for clustering, emphasizing that generic DR choices may not be optimal. The multi-method comparison using a standard metric like ARI is a positive aspect for the field of machine learning.
major comments (3)
- [Abstract] Abstract: The abstract provides no information on the datasets used, the number of experimental runs, or any statistical testing for significance. This is load-bearing for the central claim, as the recommendation to tailor DR to 'intrinsic data geometry' cannot be evaluated without evidence that the tested data cover a sufficient range of geometries, separability, and noise characteristics, and that differences are statistically reliable.
- [Abstract and Methods] Experimental design (Abstract and likely Methods section): Reduction levels are limited to the fixed literature-recommended values (k-1, 25%, 50%). The claim that levels 'should be tailored to intrinsic data geometry' is not directly supported if the experiments do not explore other levels or demonstrate that these fixed choices are suboptimal for particular geometries or algorithms.
- [Results and Discussion] Results/Discussion: The manuscript needs to explicitly link performance variations to measurable data characteristics (e.g., manifold dimensionality, cluster separability) to justify the 'tailored to intrinsic data geometry' conclusion; without this, the general guidance remains under-supported by the reported comparisons.
minor comments (2)
- [Throughout] Ensure consistent definition of all acronyms (e.g., ARI, VAE) on first use and clarify any notation for reduction levels in tables or figures.
- [Methods] Consider adding a table summarizing dataset characteristics (dimensionality, number of clusters, sample size) to improve reproducibility and context for the geometry claims.
Simulated Author's Rebuttal
We thank the referee for the constructive and detailed comments. We address each major point below and will revise the manuscript accordingly to improve clarity and evidential support for our conclusions.
read point-by-point responses
-
Referee: [Abstract] Abstract: The abstract provides no information on the datasets used, the number of experimental runs, or any statistical testing for significance. This is load-bearing for the central claim, as the recommendation to tailor DR to 'intrinsic data geometry' cannot be evaluated without evidence that the tested data cover a sufficient range of geometries, separability, and noise characteristics, and that differences are statistically reliable.
Authors: We agree that the abstract should summarize key aspects of the experimental design to better support the claims. The revised abstract will include information on the datasets used, the number of experimental runs, and any statistical testing performed on the ARI results. revision: yes
-
Referee: [Abstract and Methods] Experimental design (Abstract and likely Methods section): Reduction levels are limited to the fixed literature-recommended values (k-1, 25%, 50%). The claim that levels 'should be tailored to intrinsic data geometry' is not directly supported if the experiments do not explore other levels or demonstrate that these fixed choices are suboptimal for particular geometries or algorithms.
Authors: The experiments were restricted to the reduction levels commonly recommended in the literature to focus on practical guidance. While this design does not directly test other levels or prove suboptimality in all cases, the observed performance differences across techniques at these levels already indicate that no universal choice is optimal. We will revise the Discussion to qualify the tailoring claim more precisely and note the limitation regarding unexplored levels. revision: partial
-
Referee: [Results and Discussion] Results/Discussion: The manuscript needs to explicitly link performance variations to measurable data characteristics (e.g., manifold dimensionality, cluster separability) to justify the 'tailored to intrinsic data geometry' conclusion; without this, the general guidance remains under-supported by the reported comparisons.
Authors: We will revise the Results and Discussion sections to add explicit analysis connecting performance variations to measurable data characteristics, including estimates of intrinsic dimensionality and cluster separability metrics, with discussion of how these relate to the effectiveness of different DR techniques and algorithms. revision: yes
Circularity Check
No circularity: purely empirical evaluation
full rationale
The paper performs a systematic empirical comparison of five DR methods on four clustering algorithms across literature-recommended reduction levels, measuring outcomes with the external ARI metric. No derivations, fitted parameters, predictions, or self-citations appear in the load-bearing claims; results are benchmarked directly against ground-truth labels on the tested datasets. The central recommendation to tailor choices follows from observed performance differences rather than any definitional or self-referential reduction.
Axiom & Free-Parameter Ledger
axioms (1)
- domain assumption The reduction levels k-1, 25% and 50% of original dimensions are appropriate benchmarks as recommended in the literature.
Reference graph
Works this paper leans on
-
[1]
A. E. Ezugwu, A. M. Ikotun, O. O. Oyelade, L. Abualigah, J. O. Agushaka, C. I. Eke, A. A. Akinyelu, A comprehensive survey of clustering algorithms: State-of-the- art machine learning applications, taxonomy, challenges, and future research prospects, Engineering Applications of Artificial Intelligence 110 (2022) 104743.doi:10.1016/j. engappai.2022.104743
work page doi:10.1016/j 2022
-
[2]
G. J. Oyewole, G. A. Thopil, Data clustering: application and trends, Artificial intelli- gence review 56 (7) (2023) 6439–6475.doi:10.1007/s10462-022-10325-y
- [3]
-
[4]
S. Zhou, H. Xu, Z. Zheng, J. Chen, Z. Li, J. Bu, J. Wu, X. Wang, W. Zhu, M. Ester, A comprehensive survey on deep clustering: Taxonomy, challenges, and future directions, ACM Comput. Surv. 57 (3) (Nov. 2024).doi:10.1145/3689036. URLhttps://doi.org/10.1145/3689036
-
[5]
A. A. Wani, Comprehensive analysis of clustering algorithms: exploring limitations and innovative solutions, PeerJ Computer Science 10 (2024) e2286.doi:10.7717/peerj-cs. 2286
-
[6]
M. C. Thrun, Distance-based clustering challenges for unbiased benchmarking studies, Scientific reports 11 (1) (2021) 18988.doi:10.1038/s41598-021-98126-1
-
[7]
W. Jia, M. Sun, J. Lian, S. Hou, Feature dimensionality reduction: a review, Complex & Intelligent Systems 8 (3) (2022) 2663–2693
work page 2022
-
[8]
H. Niu, G. B. McCallum, A. B. Chang, K. Khan, S. Azam, Exploring unsupervised feature extraction algorithms: tackling high dimensionality in small datasets, Scientific Reports 15 (1) (2025) 21973.doi:10.1038/s41598-025-07725-9. 24
-
[9]
Liii. on lines and planes of closest fit to systems of points in space,
K. Pearson, Liii. on lines and planes of closest fit to systems of points in space, The London, Edinburgh, and Dublin philosophical magazine and journal of science 2 (11) (1901) 559–572.doi:10.1080/14786440109462720
-
[10]
B. Schölkopf, A. Smola, K.-R. Müller, Nonlinear component analysis as a kernel eigenvalue problem, Neural Computation 10 (5) (1998) 1299–1319.doi:10.1162/ 089976698300017467
work page 1998
-
[11]
J. B. Kruskal, Multidimensional scaling by optimizing goodness of fit to a nonmetric hypothesis, Psychometrika 29 (1) (1964) 1–27.doi:10.1007/BF02289565
-
[12]
Science376(6594), 5197 (2022) https://doi.org/10.1126/science
J.B.Tenenbaum, V.deSilva, J.C.Langford, Aglobalgeometricframeworkfornonlinear dimensionality reduction, Science 290 (5500) (2000) 2319–2323.doi:10.1126/science. 290.5500.2319
-
[13]
S.T.Roweis, L.K.Saul, Nonlineardimensionalityreductionbylocallylinearembedding, Science 290 (5500) (2000) 2323–2326.doi:10.1126/science.290.5500.2323
- [14]
-
[15]
R.R.Coifman, S.Lafon, Diffusionmaps, AppliedandComputationalHarmonicAnalysis 21 (1) (2006) 5–30, special Issue: Diffusion Maps and Wavelets.doi:10.1016/j.acha. 2006.04.006
-
[16]
L. van der Maaten, G. Hinton, Visualizing data using t-sne, Journal of Machine Learning Research 9 (86) (2008) 2579–2605. URLhttp://jmlr.org/papers/v9/vandermaaten08a.html
work page 2008
-
[17]
J. Healy, L. McInnes, Uniform manifold approximation and projection, Nature Reviews Methods Primers 4 (1) (2024) 82.doi:10.1038/s43586-024-00363-x
-
[18]
G. E. Hinton, R. R. Salakhutdinov, Reducing the dimensionality of data with neural networks, Science 313 (5786) (2006) 504–507.doi:10.1126/science.1127647
-
[19]
D. P. Kingma, M. Welling, Auto-encoding variational bayes (2013).arXiv:1312.6114. URLhttps://arxiv.org/abs/1312.6114
work page internal anchor Pith review Pith/arXiv arXiv 2013
-
[20]
doi:10.1007/s10462-020-09928-0
P.Ray, S.S.Reddy, T.Banerjee, Variousdimensionreductiontechniquesforhigh dimen- sional data analysis: a review, Artificial Intelligence Review 54 (5) (2021) 3473–3515. doi:10.1007/s10462-020-09928-0
-
[21]
M. Z. Rodriguez, C. H. Comin, D. Casanova, O. M. Bruno, D. R. Amancio, L. d. F. Costa, F. A. Rodrigues, Clustering algorithms: A comparative approach, PloS one 14 (1) (2019) e0210236.doi:10.1371/journal.pone.0210236. 25
-
[22]
C. Ding, X. He, K-means clustering via principal component analysis, in: Proceedings of the Twenty-First International Conference on Machine Learning, ICML ’04, Association for Computing Machinery, New York, NY, USA, 2004, p. 29.doi:10.1145/1015330. 1015408
-
[23]
M. Allaoui, M. L. Kherfi, A. Cheriet, Considerably improving clustering algo- rithms using umap dimensionality reduction technique: A comparative study, in: A. El Moataz, D. Mammass, A. Mansouri, F. Nouboud (Eds.), Image and Signal Pro- cessing, Springer International Publishing, Cham, 2020, pp. 317–325.doi:10.1007/ 978-3-030-51935-3_34
work page 2020
-
[24]
M. Alkhayrat, M. Aljnidi, K. Aljoumaa, A comparative dimensionality reduction study in telecom customer segmentation using deep learning and pca, Journal of Big Data 7 (1) (2020) 9.doi:10.1186/s40537-020-0286-0
-
[25]
M. Rovira, K. Engvall, C. Duwig, Identifying key features in reactive flows: A tutorial on combining dimensionality reduction, unsupervised clustering, and feature correlation, Chemical Engineering Journal 438 (2022) 135250.doi:10.1016/j.cej.2022.135250
-
[26]
Y. Sun, L. Kong, J. Huang, H. Deng, X. Bian, X. Li, F. Cui, L. Dou, C. Cao, Q. Zou, Z. Zhang, A comprehensive survey of dimensionality reduction and clustering methods for single-cell and spatial transcriptomics data, Briefings in Functional Genomics 23 (6) (2024) 733–744.doi:10.1093/bfgp/elae023
-
[27]
J. Xia, Y. Zhang, J. Song, Y. Chen, Y. Wang, S. Liu, Revisiting dimensionality reduc- tion techniques for visual cluster analysis: An empirical study, IEEE Transactions on Visualization and Computer Graphics 28 (1) (2022) 529–539.doi:10.1109/TVCG.2021. 3114694
-
[28]
S. Ayesha, M. K. Hanif, R. Talib, Overview and comparative study of dimensionality reduction techniques for high dimensional data, Information Fusion 59 (2020) 44–58. doi:10.1016/j.inffus.2020.01.005
-
[29]
M. Herrmann, D. Kazempour, F. Scheipl, P. Kröger, Enhancing cluster analysis via topological manifold learning, Data Mining and Knowledge Discovery 38 (3) (2024) 840–887.doi:10.1007/s10618-023-00980-2
-
[30]
C. C. Aggarwal, A. Hinneburg, D. A. Keim, On the surprising behavior of distance metrics in high dimensional space, in: Database Theory — ICDT 2001, Springer Berlin Heidelberg, Berlin, Heidelberg, 2001, pp. 420–434.doi:10.1007/3-540-44503-X_27
-
[31]
K. Beyer, J. Goldstein, R. Ramakrishnan, U. Shaft, When is “nearest neighbor” meaningful?, in: Database Theory — ICDT’99, Springer, 1999, pp. 217–235.doi: 10.1007/3-540-49257-7_15
-
[32]
M. E. Tipping, C. M. Bishop, Mixtures of probabilistic principal component analyzers, Neural Computation 11 (2) (1999) 443–482.doi:10.1162/089976699300016728. 26
-
[33]
J. C.-H. Tseng, B.-A. Tsai, K. Chung, Sea surface temperature clustering and prediction in the pacific ocean based on isometric feature mapping analysis, Geoscience Letters 10 (1) (2023) 42.doi:10.1186/s40562-023-00295-6
-
[34]
H. R. Roh, C. S. Kim, Y. Lee, J. M. Lee, Dimensionality reduction for clustering of nonlinear industrial data: A tutorial, Korean Journal of Chemical Engineering (2025) 1–15doi:10.1007/s11814-025-00402-7
-
[35]
E. S. Dalmaijer, C. L. Nord, D. E. Astle, Statistical power for cluster analysis, BMC bioinformatics 23 (1) (2022) 205.doi:10.1186/s12859-022-04675-1
-
[36]
J. Lötsch, A. Ultsch, Comparative assessment of projection and clustering method com- binations in the analysis of biomedical data, Informatics in Medicine Unlocked 50 (2024) 101573.doi:10.1016/j.imu.2024.101573
-
[37]
Y. Hozumi, R. Wang, C. Yin, G.-W. Wei, Umap-assisted k-means clustering of large- scale sars-cov-2 mutation datasets, Computers in Biology and Medicine 131 (2021) 104264.doi:10.1016/j.compbiomed.2021.104264
- [38]
- [39]
-
[40]
M. J. Zellinger, P. Bühlmann, Natural language-based synthetic data generation for clus- ter analysis, Journal of Classification (2025) 1–27doi:10.1007/s00357-025-09501-w
-
[41]
V. Makarenkov, P. Zentilli, D. Kevorkov, A. Gagarin, N. Malo, R. Nadon, An efficient method for the detection and elimination of systematic error in high-throughput screen- ing, Bioinformatics 23 (13) (2007) 1648–1657.doi:10.1093/bioinformatics/btm145
-
[42]
O. Arbelaitz, I. Gurrutxaga, J. Muguerza, J. M. Pérez, I. Perona, An extensive com- parative study of cluster validity indices, Pattern Recognition 46 (1) (2013) 243–256. doi:10.1016/j.patcog.2012.07.021
-
[43]
J. MacQueen, Some methods for classification and analysis of multivariate observations, in: Proceedings of the Fifth Berkeley Symposium on Mathematical Statistics and Prob- ability, Volume 1: Statistics, Vol. 5, University of California press, 1967, pp. 281–298. URLhttp://projecteuclid.org/euclid.bsmsp/1200512992
-
[44]
R. C. de Amorim, V. Makarenkov, On k-means iterations and gaussian clusters, Neuro- computing 553 (2023) 126547
work page 2023
-
[45]
R. C. De Amorim, V. Makarenkov, Applying subclustering and lp distance in weighted k-means with distributed centroids, Neurocomputing 173 (2016) 700–707. 27
work page 2016
-
[46]
J. Peña, J. Lozano, P. Larrañaga, An empirical comparison of four initialization methods for the k-means algorithm, Pattern Recognition Letters 20 (10) (1999) 1027–1040.doi: https://doi.org/10.1016/S0167-8655(99)00069-0. URLhttps://www.sciencedirect.com/science/article/pii/S0167865599000690
-
[47]
R. C. de Amorim, V. Makarenkov, Improving clustering quality evaluation in noisy gaussian mixtures, Neurocomputing (2026) 133330
work page 2026
-
[48]
P. H. A. Sneath, R. R. Sokal, Numerical taxonomy. The principles and practice of numerical classification., W. H. Freeman and Company, 1973
work page 1973
-
[49]
J. H. Wolfe, Pattern clustering by multivariate mixture analysis, Multivariate behavioral research 5 (3) (1970) 329–350.doi:10.1207/s15327906mbr0503\_6
-
[50]
M. Ankerst, M. M. Breunig, H.-P. Kriegel, J. Sander, Optics: ordering points to identify the clustering structure, in: Proceedings of the 1999 ACM SIGMOD International Con- ference on Management of Data, SIGMOD ’99, Association for Computing Machinery, New York, NY, USA, 1999, p. 49–60.doi:10.1145/304182.304187
-
[51]
M. Ester, H.-P. Kriegel, J. Sander, X. Xu, et al., A density-based algorithm for discov- ering clusters in large spatial databases with noise, in: kdd, Vol. 96, 1996, pp. 226–231
work page 1996
-
[52]
Journal of Classification2(1), 193–218 (1985) https://doi.org/10.1007/BF01908075
L. Hubert, P. Arabie, Comparing partitions, Journal of classification 2 (1985) 193–218. doi:10.1007/BF01908075
-
[53]
C. Ding, X. He, H. Zha, H. Simon, Adaptive dimension reduction for clustering high dimensional data, in: 2002 IEEE International Conference on Data Mining, 2002. Pro- ceedings., 2002, pp. 147–154.doi:10.1109/ICDM.2002.1183897
-
[54]
B. Tang, M. Shepherd, E. Milios, M. I. Heywood, Comparing and combining dimension reduction techniques for efficient text clustering, in: Proceeding of SIAM international workshop on feature selection for data mining, 2005, pp. 17–26
work page 2005
-
[55]
G. Karypis, E. Han, Concept indexing: A fast dimensionality reduction algorithm with applications to document retrieval & categorization (2000)
work page 2000
-
[56]
B. M. S. Hasan, A. M. Abdulazeez, A review of principal component analysis algorithm for dimensionality reduction, Journal of Soft Computing and Data Mining 2 (1) (2021) 20–30
work page 2021
-
[57]
J. Xie, R. Girshick, A. Farhadi, Unsupervised deep embedding for clustering analysis, in: International conference on machine learning, PMLR, 2016, pp. 478–487
work page 2016
-
[58]
Z. Jiang, Y. Zheng, H. Tan, B. Tang, H. Zhou, Variational deep embedding: An unsu- pervised and generative approach to clustering, arXiv preprint arXiv:1611.05148 (2016). 28 Appendix A. Detailed ARI Scores for Synthetic and Real-World Datasets This appendix presents complete ARI results for all clustering algorithms (k-means, AHC, GMM, and OPTICS) applied...
discussion (0)
Sign in with ORCID, Apple, or X to comment. Anyone can read and Pith papers without signing in.