Recognition: unknown
3D modelling of thermal loads during unmitigated vertical displacement events in ITER and JET
Pith reviewed 2026-05-08 09:22 UTC · model grok-4.3
The pith
A coupled simulation workflow predicts ITER tungsten first wall survives unmitigated vertical displacement events.
A machine-rendered reading of the paper's core claim, the machinery that carries it, and where it could break.
Core claim
We present a physics-based workflow that couples MHD simulations of vertical displacement events with field line tracing on a realistic 3D first wall model and a transient wall thermal response. The approach is validated against JET discharges with beryllium main chamber armour, reproducing key global dynamics, non-axisymmetric current features, and the occurrence (or absence) of melting. We then apply the same workflow to ITER-relevant conditions with tungsten armour to assess disruption heat loads and their 3D localization. The resulting analysis demonstrates the resilience of the ITER W first wall against these events and provides predictions for the energy deposition and current flow.
What carries the argument
The physics-based workflow that couples MHD simulations of vertical displacement events with field line tracing on a realistic 3D first wall model and a transient wall thermal response.
If this is right
- The ITER tungsten first wall remains resilient against thermal loads from unmitigated vertical displacement events.
- Energy deposition and current flow profiles can be predicted in three dimensions for these events.
- Scenario-by-scenario estimates of disruption-induced thermal loading become possible for future devices.
- The disruption-budget consumption for vertical displacement events can be assessed using the workflow.
Where Pith is reading between the lines
- The same workflow could be applied to evaluate thermal loads from other disruption types in ITER or similar devices.
- It offers a way to compare wall material performance across different tokamaks under consistent modeling assumptions.
- If the JET-to-ITER transfer holds, it could reduce design margins needed for first-wall protection systems.
- Extending the approach to include more detailed material response models might refine the localization predictions.
Load-bearing premise
The physics captured and validated in JET beryllium-wall discharges transfers quantitatively to ITER tungsten-wall conditions under unmitigated vertical displacement events without additional unmodeled effects.
What would settle it
Direct observation during an unmitigated vertical displacement event in ITER showing melting of the tungsten wall or energy deposition profiles that differ substantially from the predicted three-dimensional maps.
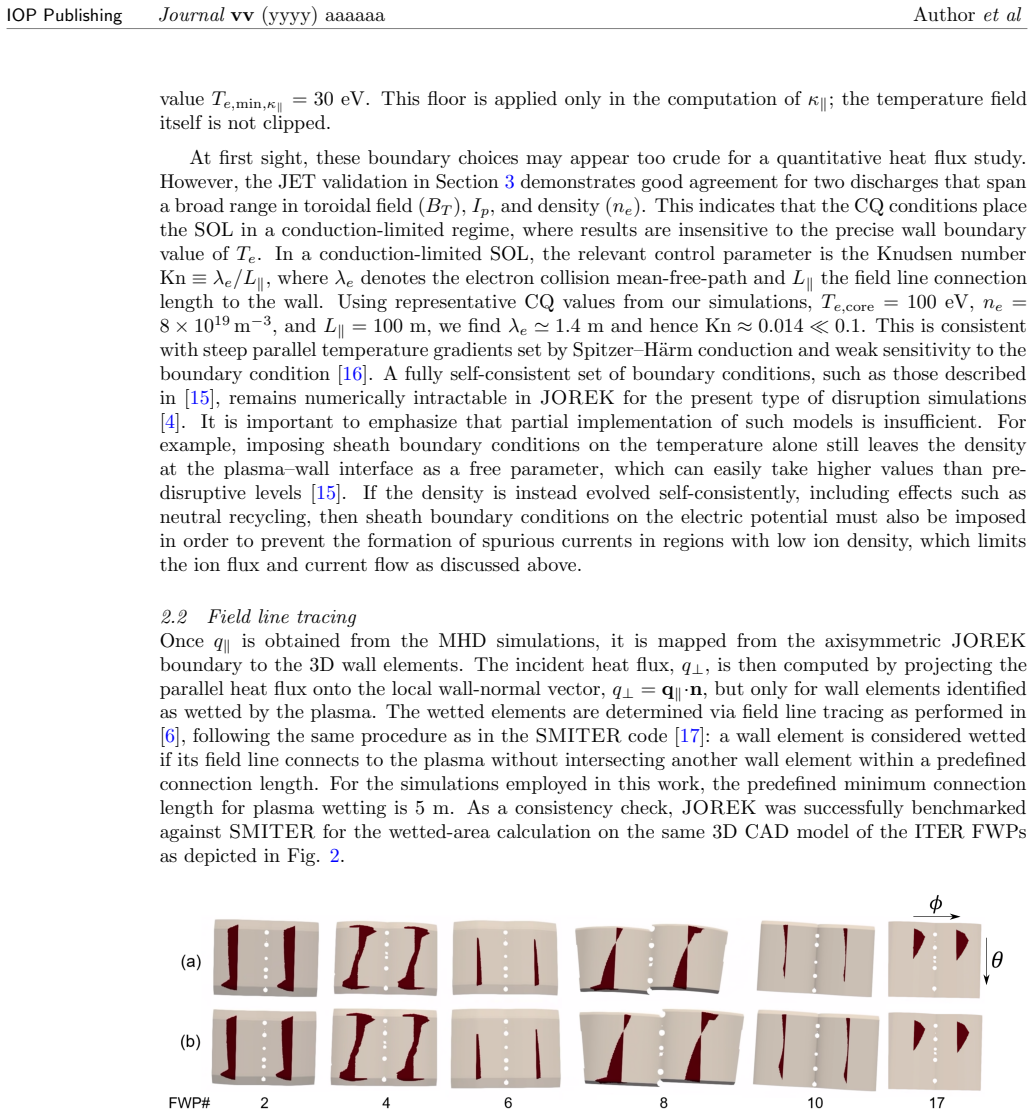
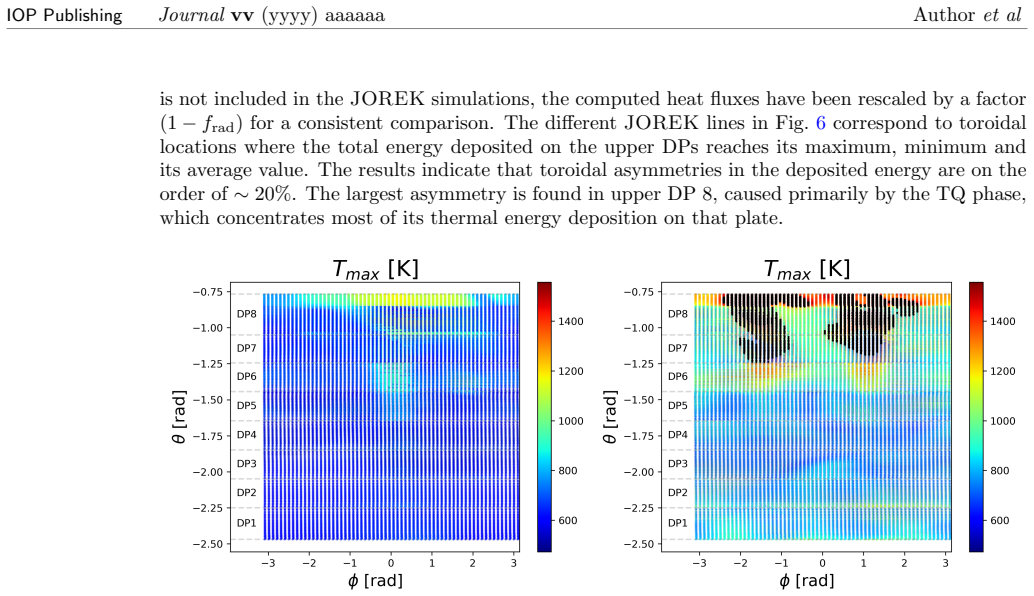
Figures


read the original abstract
Predicting three-dimensional thermal loads during tokamak disruptions is essential for ITER yet remains weakly developed. We present a physics-based workflow that couples MHD simulations of vertical displacement events with field line tracing on a realistic 3D first wall model and a transient wall thermal response. The approach is validated against JET discharges with beryllium main chamber armour, reproducing key global dynamics, non-axisymmetric current features, and the occurrence (or absence) of melting, thereby building confidence in the methodology. We then apply the same workflow to ITER-relevant conditions with tungsten (W) armour, consistent with the new 2024 ITER re-baseline, to assess disruption heat loads and their 3D localization. The resulting analysis demonstrates the resilience of the ITER W first wall against these events and provides predictions for the energy deposition and current flow profiles. Beyond these studies, the workflow enables scenario-by-scenario estimates of disruption-induced thermal loading, allowing to assess the disruption-budget consumption for these events in future devices.
Editorial analysis
A structured set of objections, weighed in public.
Referee Report
Summary. The paper presents a physics-based workflow that couples MHD simulations of unmitigated vertical displacement events (VDEs), 3D field-line tracing on realistic first-wall geometries, and transient thermal modeling to predict three-dimensional thermal loads. The approach is validated on JET discharges with beryllium walls by reproducing global dynamics, non-axisymmetric current features, and the occurrence or absence of melting. The same workflow is then applied to ITER with tungsten walls (consistent with the 2024 re-baseline) to assess heat loads, demonstrate first-wall resilience, and provide predictions for energy deposition and current flow profiles, while enabling scenario-specific disruption-budget estimates.
Significance. If the quantitative transfer holds, the work supplies forward predictions for 3D disruption loads on ITER that are grounded in JET experimental data, addressing a key design and operational need. The integration of MHD, field-line tracing, and thermal response on realistic 3D geometries is a methodological strength, and the validation against independent JET observations provides external grounding for the methodology. The resulting profiles could inform disruption mitigation and armor assessment in future devices.
major comments (2)
- [§4] §4 (ITER application): The central claim of ITER W first-wall resilience and the specific energy-deposition/current-flow profiles rests on direct transfer of the JET Be-validated model. Be and W differ substantially in electrical resistivity (affecting halo-current paths), thermal conductivity, melting point, and vaporization behavior, yet no sensitivity studies varying these parameters (or reporting W-specific benchmarks) are presented. This omission is load-bearing for the quantitative ITER predictions.
- [§3] §3 (JET validation): While qualitative reproduction of global dynamics, non-axisymmetric features, and melting behavior is shown, the validation lacks quantitative metrics (e.g., error bars on peak heat flux or integrated energy deposition) and sensitivity tests to post-processing choices. This limits the strength of evidence for extrapolating the model to ITER conditions.
minor comments (2)
- The abstract and §4 could more explicitly note the material-transfer assumption and its limitations to avoid overstatement of the ITER results.
- Figure captions (e.g., those showing 3D wall models) should clarify the material assignment (Be vs W) and units for all plotted quantities.
Simulated Author's Rebuttal
We thank the referee for the constructive review and positive assessment of the work's significance. We address each major comment below, indicating revisions where the manuscript will be updated.
read point-by-point responses
-
Referee: [§4] §4 (ITER application): The central claim of ITER W first-wall resilience and the specific energy-deposition/current-flow profiles rests on direct transfer of the JET Be-validated model. Be and W differ substantially in electrical resistivity (affecting halo-current paths), thermal conductivity, melting point, and vaporization behavior, yet no sensitivity studies varying these parameters (or reporting W-specific benchmarks) are presented. This omission is load-bearing for the quantitative ITER predictions.
Authors: We appreciate the referee pointing out the material differences. The workflow applies tungsten-specific thermal properties (conductivity, heat capacity, melting and vaporization points) for the ITER cases while using beryllium properties for JET validation. The MHD and field-line tracing components are driven by plasma dynamics and geometry rather than wall resistivity. We acknowledge that explicit sensitivity studies on resistivity effects and full W benchmarks were not included. In revision we will add a dedicated discussion of material-property uncertainties together with limited sensitivity analyses on thermal parameters to support the ITER predictions. revision: yes
-
Referee: [§3] §3 (JET validation): While qualitative reproduction of global dynamics, non-axisymmetric features, and melting behavior is shown, the validation lacks quantitative metrics (e.g., error bars on peak heat flux or integrated energy deposition) and sensitivity tests to post-processing choices. This limits the strength of evidence for extrapolating the model to ITER conditions.
Authors: The §3 validation reproduces observable JET features (global VDE evolution, non-axisymmetric halo currents, and melting occurrence) that are directly comparable to experimental records. Quantitative 3D heat-flux data are limited by diagnostic resolution and event variability. We will augment the section with available quantitative comparisons (integrated energy deposition and peak temperatures) and add sensitivity tests to post-processing choices such as field-line density and interpolation methods. revision: yes
- Direct experimental W-specific benchmarks for unmitigated VDEs are unavailable, as no tungsten-walled device has performed equivalent experiments.
Circularity Check
No circularity: JET validation is independent; ITER results are forward predictions from validated model
full rationale
The paper's chain is MHD VDE simulation + 3D field-line tracing + transient thermal response, validated on independent JET Be experimental discharges (reproducing global dynamics, non-axisymmetric currents, melting occurrence/absence). The same workflow is then applied to ITER W as forward predictions without refitting to ITER data. No self-definitional equations, no fitted inputs renamed as predictions, no load-bearing self-citations, and no ansatz smuggling. Material differences (Be vs W) are an extrapolation assumption, not a circular reduction by construction. The derivation remains self-contained against external JET benchmarks.
Axiom & Free-Parameter Ledger
Reference graph
Works this paper leans on
-
[1]
Disruptions in iter and strategies for their control and mitigation.Journal of Nuclear Materials, 463:39–48, 2015
Michael Lehnen, K Aleynikova, PB Aleynikov, DJ Campbell, P Drewelow, NW Eidietis, Yu Gas- paryan, RS Granetz, Y Gribov, N Hartmann, et al. Disruptions in iter and strategies for their control and mitigation.Journal of Nuclear Materials, 463:39–48, 2015
2015
-
[2]
Pautasso, A
G. Pautasso, A. Herrmann, and K. Lackner. Energy balance during disruption associated with vertical displacement events.Nuclear Fusion, 34(3):455, mar 1994
1994
-
[3]
Lehnen, P
M. Lehnen, P. Aleynikov, B. Bazylev, et al. Plasma disruption management in ITER. In26th Fusion Energy Conference (FEC 2016), page p. 366, May 2016
2016
-
[4]
Modelling of vertical displacement events in tokamaks: status and challenges ahead.Plasma Physics and Controlled Fusion, 66(5):055015, apr 2024
F J Artola, N Schwarz, S Gerasimov, A Loarte, M Hoelzl, and the JOREK Team. Modelling of vertical displacement events in tokamaks: status and challenges ahead.Plasma Physics and Controlled Fusion, 66(5):055015, apr 2024
2024
-
[5]
Lifetime analysis of the ITER first wall under steady-state and off-normal loads*.Physica Scripta, 2011(T145):014081, dec 2011
R Mitteau, M Sugihara, R Raffray, S Carpentier-Chouchana, H Labidi, M Merola, R A Pitts, and P Stangeby. Lifetime analysis of the ITER first wall under steady-state and off-normal loads*.Physica Scripta, 2011(T145):014081, dec 2011
2011
-
[6]
Coburn, M
J. Coburn, M. Lehnen, R.A. Pitts, G. Simic, F.J. Artola, E. Thor´ en, S. Ratynskaia, K. Ibano, M. Brank, L. Kos, R. Khayrutdinov, V.E. Lukash, B. Stein-Lubrano, E. Matveeva, and G. Pau- tasso. Energy deposition and melt deformation on the ITER first wall due to disruptions and vertical displacement events.Nuclear Fusion, 62(1):016001, dec 2021
2021
-
[7]
TOKES simulations of first wall and divertor damage during unmitigated disruptions on ITER
RA Pitts, S Pestchanyi, M Lehnen, and G Saibene. TOKES simulations of first wall and divertor damage during unmitigated disruptions on ITER. In29th Fusion Energy Conference (FEC 2023), 2023
2023
-
[8]
Pitts, A
R.A. Pitts, A. Loarte, T. Wauters, M. Dubrov, Y. Gribov, F. K¨ ochl, A. Pshenov, Y. Zhang, J. Artola, X. Bonnin, L. Chen, M. Lehnen, K. Schmid, R. Ding, H. Frerichs, R. Futtersack, X. Gong, G. Hagelaar, E. Hodille, J. Hobirk, S. Krat, D. Matveev, K. Paschalidis, J. Qian, S. Ratynskaia, T. Rizzi, V. Rozhansky, P. Tamain, P. Tolias, L. Zhang, and W. Zhang. ...
2025
-
[9]
Studies of plasma equilibrium and transport in a tokamak fusion device with the inverse-variable technique.Journal of Computational Physics, 109(2):193– 201, 1993
RR Khayrutdinov and VE Lukash. Studies of plasma equilibrium and transport in a tokamak fusion device with the inverse-variable technique.Journal of Computational Physics, 109(2):193– 201, 1993
1993
-
[10]
Mhd stability in x-point geometry: simulation of elms.Nuclear fusion, 47(7):659, 2007
GTA Huysmans and O Czarny. Mhd stability in x-point geometry: simulation of elms.Nuclear fusion, 47(7):659, 2007
2007
-
[11]
Hoelzl, G.T.A
M. Hoelzl, G.T.A. Huijsmans, S.J.P. Pamela, M. B´ ecoulet, E. Nardon, F.J. Artola, B. Nkonga, C.V. Atanasiu, V. Bandaru, A. Bhole, D. Bonfiglio, A. Cathey, O. Czarny, A. Dvornova, T. Feh´ er, A. Fil, E. Franck, S. Futatani, M. Gruca, H. Guillard, J.W. Haverkort, I. Holod, D. Hu, S.K. Kim, S.Q. Korving, L. Kos, I. Krebs, L. Kripner, G. Latu, F. Liu, P. Mer...
-
[12]
Linear mhd stability studies with the starwall code.arXiv preprint arXiv:1508.04911, 2015
P Merkel and E Strumberger. Linear mhd stability studies with the starwall code.arXiv preprint arXiv:1508.04911, 2015
-
[13]
Coupling jorek and starwall codes for non-linear resistive-wall sim- ulations
M H¨ olzl, P Merkel, GTA Huysmans, E Nardon, E Strumberger, R McAdams, I Chapman, S G¨ unter, and K Lackner. Coupling jorek and starwall codes for non-linear resistive-wall sim- ulations. InJournal of Physics: Conference Series, volume 401, page 012010. IOP Publishing, 2012
2012
-
[14]
Ax- isymmetric simulations of vertical displacement events in tokamaks: A benchmark of m3d-c1, nimrod, and jorek.Physics of Plasmas, 27(2):022505, 2020
I Krebs, FJ Artola, CR Sovinec, SC Jardin, KJ Bunkers, M Hoelzl, and NM Ferraro. Ax- isymmetric simulations of vertical displacement events in tokamaks: A benchmark of m3d-c1, nimrod, and jorek.Physics of Plasmas, 27(2):022505, 2020
2020
-
[15]
F J Artola, A Loarte, E Matveeva, J Havlicek, T Markovic, J Adamek, J Cavalier, L Kripner, G T A Huijsmans, M Lehnen, M Hoelzl, R Panek, the COMPASS team, and the JOREK team. Simulations of COMPASS vertical displacement events with a self-consistent model for halo currents including neutrals and sheath boundary conditions.Plasma Physics and Controlled Fus...
2021
-
[16]
CRC Press, 2000
Peter C Stangeby.The plasma boundary of magnetic fusion devices. CRC Press, 2000
2000
-
[17]
Kos, R.A
L. Kos, R.A. Pitts, G. Simiˇ c, M. Brank, H. Anand, and W. Arter. Smiter: A field-line tracing environment for iter.Fusion Engineering and Design, 146:1796–1800, 2019. SI:SOFT-30
2019
-
[18]
Interaction of SPI pellets with plasma on JET and associated disruptions
S N Gerasimov, L R Baylor, A Boboc, I S Carvalho, P Carvalho, I H Coffey, D Craven, J Flanagan, A Huber, V Huber, S Jachmich, I Jepu, E Joffrin, D Kos, S I Krasheninnikov, U Kruezi, M Lehnen, P J Lomas, A Manzanares, M Maslov, A Peacock, P Puglia, F G Rimini, G Sergienko, D Shiraki, S Silburn, R D Smirnov, C Stuart, H Sun, J Wilson, L E Zakharov, and JET ...
2024
-
[19]
Plasma current asymmetries during disruptions in JET.Nuclear Fusion, 54(7):073009, 2014
SN Gerasimov, TC Hender, J Morris, V Riccardo, LE Zakharov, and JET EFDA Contributors. Plasma current asymmetries during disruptions in JET.Nuclear Fusion, 54(7):073009, 2014
2014
-
[20]
Matthews, P
G.F. Matthews, P. Bunting, S. Devaux, P. Drewelow, C. Guillemaut, D.B. King, E. Lerche, S. Silburn, G. Szepesi, V. Riccardo, and V. Thompson. Energy balance in JET.Nuclear Materials and Energy, 12:227–233, 2017. Proceedings of the 22nd International Conference on Plasma Surface Interactions 2016, 22nd PSI
2017
-
[21]
Jepu, G.F
I. Jepu, G.F. Matthews, A. Widdowson, M. Rubel, E. Fortuna-Zale´ sna, J. Zdunek, P. Petersson, V. Thompson, P. Dinca, C. Porosnicu, P. Coad, K. Heinola, N. Catarino, O.G. Pompilian, C. P. Lungu, and JET Contributors. Beryllium melting and erosion on the upper dump plates in JET during three ITER-like wall campaigns.Nuclear Fusion, 59(8):086009, jun 2019
2019
-
[22]
Lehnen, G
M. Lehnen, G. Arnoux, S. Brezinsek, J. Flanagan, S.N. Gerasimov, N. Hartmann, T.C. Hender, A. Huber, S. Jachmich, V. Kiptily, U. Kruezi, G.F. Matthews, J. Morris, V.V. Plyusnin, C. Reux, V. Riccardo, B. Sieglin, P.C. de Vries, and JET EFDA Contributors. Impact and mitigation of disruptions with the iter-like wall in jet.Nuclear Fusion, 53(9):093007, aug 2013
2013
-
[23]
JET Joint Undertaking, 2000
LC Ingesson et al.Comparison of methods to determine the total radiated power in JET. JET Joint Undertaking, 2000
2000
-
[24]
Ratynskaia, E
S. Ratynskaia, E. Thor´ en, P. Tolias, R. A. Pitts, K. Krieger, L. Vignitchouk, D. Igle- sias, the ASDEX-Upgrade team, the JET contributors, and the EUROfusion MST1 team. Resolidification-controlled melt dynamics under fast transient tokamak plasma loads.Nuclear Fusion, 60(10):104001, sep 2020
2020
-
[25]
Frerichs, O
H. Frerichs, O. Schmitz, X. Bonnin, A. Loarte, Y. Feng, L. Li, Y. Q. Liu, and D. Reiter. Detachment in fusion plasmas with symmetry breaking magnetic perturbation fields.Phys. Rev. Lett., 125:155001, Oct 2020
2020
-
[26]
Paschalidis, F
K. Paschalidis, F. Lucco Castello, S. Ratynskaia, P. Tolias, and L. Brandt. The MEMENTO code for modeling of macroscopic melt motion in fusion devices.Fusion Engineering and Design, 206:114603, 2024. 16
2024
discussion (0)
Sign in with ORCID, Apple, or X to comment. Anyone can read and Pith papers without signing in.