Recognition: unknown
Initial Performance of the E320 Tracker
Pith reviewed 2026-05-08 04:51 UTC · model grok-4.3
The pith
The E320 tracker prototype measures positrons at a rate of 0.12 per shot under a background density of 1.7 hits per square millimeter.
A machine-rendered reading of the paper's core claim, the machinery that carries it, and where it could break.
Core claim
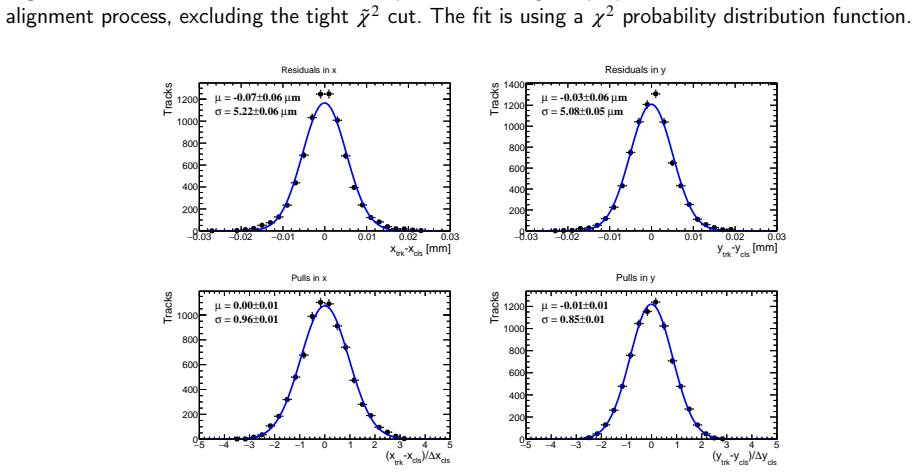
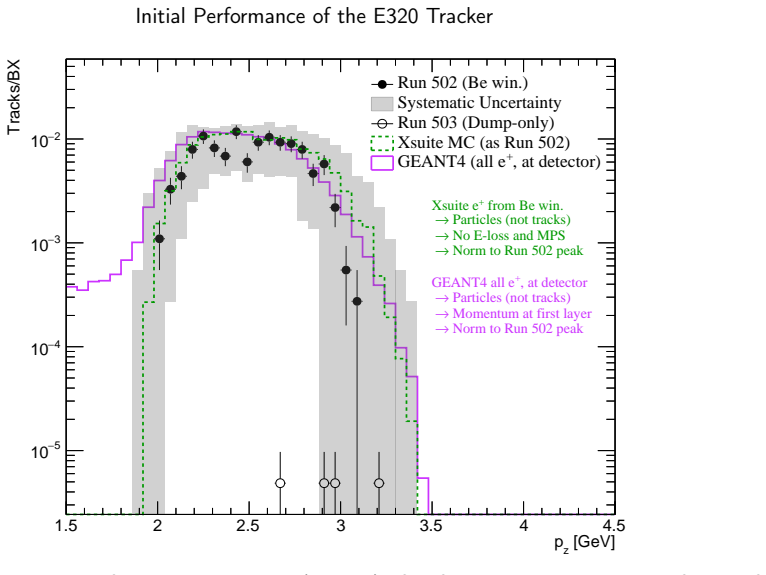
Using positrons generated through Bremsstrahlung photon conversion in a thin beryllium foil as a proxy for nonlinear Breit-Wheeler positrons, the five-layer ALPIDE prototype measures a signal rate of (1.20 ± 0.06_stat ± 0.56_syst) × 10^{-1} positrons per shot at a background hit density of ~1.7/mm². The Hough-transform seeding followed by a straight-line fit reconstructs tracks with ~5 micron resolution, enabling spectral characterization, and the measured rate is comparable to the expected nonlinear Breit-Wheeler yield in the main experiment while the foil-retracted false-positive rate is four orders of magnitude smaller.
What carries the argument
Five-layer ALPIDE pixel detector using Hough-transform seeding algorithm followed by straight-line track fitting within the detector volume.
Load-bearing premise
The positrons produced by Bremsstrahlung conversion in the beryllium foil have kinematics, angular distributions, and accompanying backgrounds sufficiently similar to those from nonlinear Breit-Wheeler pair production that detection efficiency and background rejection transfer directly.
What would settle it
Observing a positron rate more than a factor of two below the expected nonlinear Breit-Wheeler value (after efficiency corrections) in the full E320 run, or a false-positive rate above 10^{-4} per shot when the foil is retracted, would indicate the tracker does not enable the intended measurement.
Figures


read the original abstract
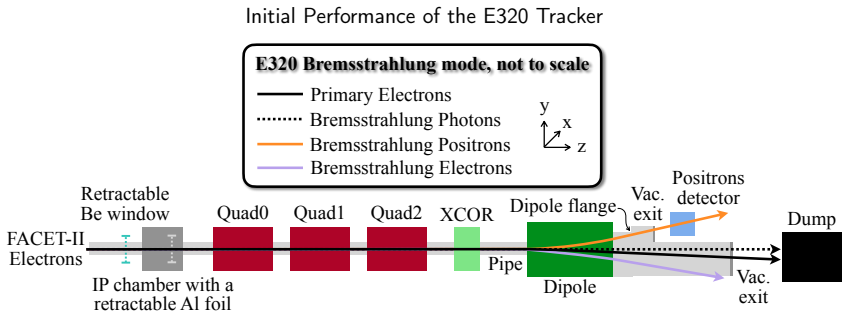
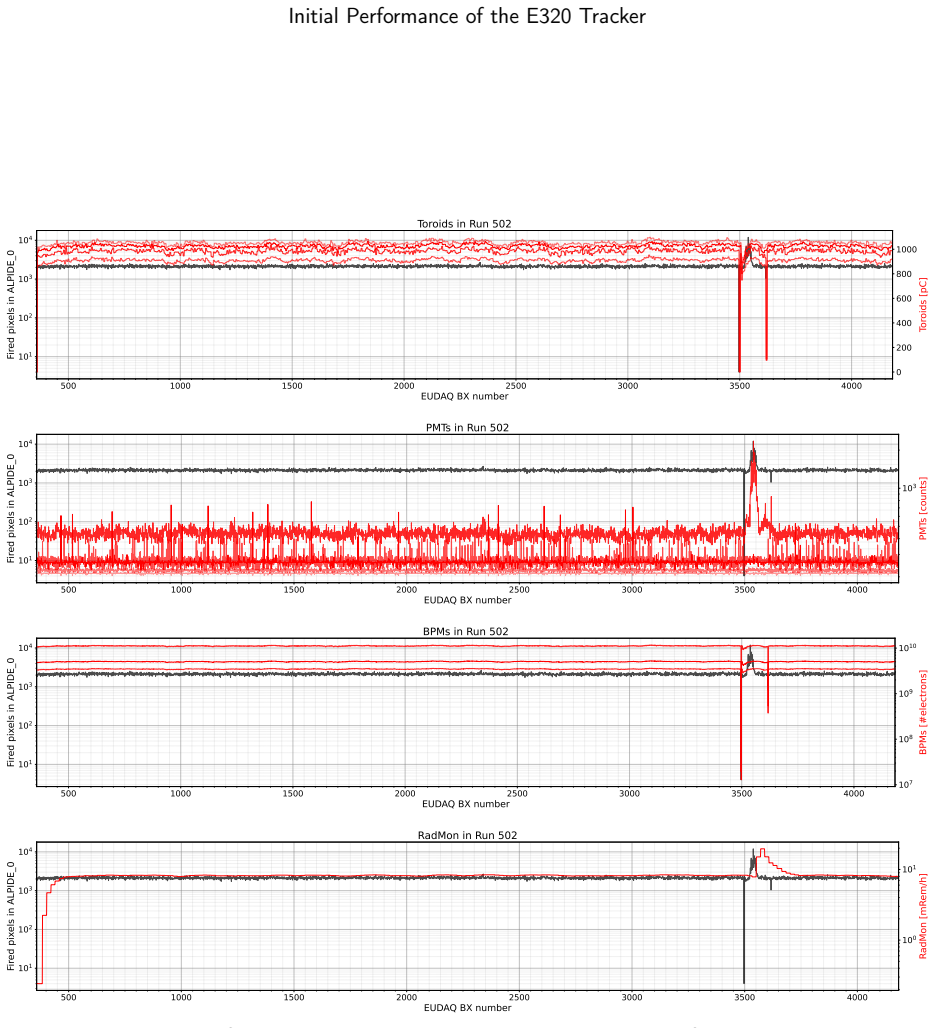
Our recent study discussed the prospects for measuring single positrons produced in electron-laser collisions via the nonlinear Breit-Wheeler deep-tunneling process in the SLAC Experiment 320 at the FACET-II RF LINAC. In this work, we demonstrate how a tracking detector, that is a scaled-down version of the one discussed in the prospective simulation study, enables the measurement. This prototype detector, installed in Aug 2024, is built out of five layers of single ALPIDE chips. The data are taken from several standalone runs completed in Nov 2024 and Feb 2025. We use positrons generated through conversion of Bremsstrahlung photons as a proxy to the nonlinear Breit-Wheeler process. These positrons are produced by the beam electrons in a thin Beryllium foil close to the experiment's interaction point. The tracking approach used in this initial work is based on a Hough-Transform seeding algorithm followed by a straight line fit confined to the detector volume. Even with this relatively simple approach, we are able to measure a signal rate of $(1.20\pm0.06_{stat.}\pm0.56_{syst.})\times10^{-1}$ positrons per shot. This signal rate is comparable to the nonlinear Breit-Wheeler rate expected in the main experiment. Notably, the measurement is achieved under an extreme, unprecedented background hit density of ~1.7/mm$^2$, unlike the main experiment, where at least a twice lower density is expected. This large background is mostly due to secondary particles produced when the large flux of Bremsstrahlung photons interacts with the material of the beamline elements. When the foil is retracted, the false-positive signal rate is shown to be four orders of magnitude smaller than the signal rate. We further show that the high spatial tracking resolution of ~5 micron allows to characterize the positrons' spectra. The results are compared to simulations, which are found to be compatible with the data.
Editorial analysis
A structured set of objections, weighed in public.
Referee Report
Summary. The manuscript describes the initial performance of a prototype tracker for SLAC Experiment E320, consisting of five layers of ALPIDE silicon pixel detectors. The authors use positrons from Bremsstrahlung photon conversion in a thin Beryllium foil as a proxy for nonlinear Breit-Wheeler positrons expected in electron-laser collisions. Employing a Hough-transform-based seeding algorithm followed by a straight-line fit, they report a measured signal rate of (1.20 ± 0.06_stat ± 0.56_syst) × 10^{-1} positrons per shot at a background density of ~1.7/mm². Foil retraction demonstrates a four-order-of-magnitude reduction in false positives, a spatial resolution of approximately 5 microns is achieved, and the data are found to be compatible with simulations.
Significance. This result demonstrates the tracker's ability to extract a signal at the rate level expected for the primary nonlinear Breit-Wheeler measurement, even under background conditions more severe than those anticipated in the main run. The strong suppression of fakes upon foil retraction and the reported resolution provide concrete evidence supporting the detector's suitability. Compatibility with simulations further bolsters confidence in the analysis methodology for future data taking.
major comments (2)
- [Results and systematic uncertainties] The systematic uncertainty is nearly an order of magnitude larger than the statistical uncertainty. The manuscript should explicitly list and quantify the individual contributions to the systematic error (e.g., from efficiency, background subtraction, or proxy modeling) in a dedicated subsection or table. This is necessary to evaluate the robustness of the rate measurement and its extrapolation to the main experiment.
- [Proxy validation and discussion] The paper relies on the Be-foil positrons as a proxy, but differences in production mechanism (Bremsstrahlung conversion vs. nonlinear BW pair production) imply potential differences in kinematics and correlated backgrounds. The absence of a data set with varied foil parameters or direct comparison to simulated nonlinear BW events means that any tracking biases specific to the main-experiment kinematics would not be apparent. This limits the strength of the claim that the demonstrated performance directly translates to the primary E320 measurement.
minor comments (2)
- [Abstract] The phrase 'Our recent study' should be replaced with a specific citation to the referenced work for improved traceability.
- [Methods] Clarify whether the straight-line fit is performed in 3D or projected, and provide the exact definition of the 'detector volume' used for the fit confinement.
Simulated Author's Rebuttal
We thank the referee for their thorough review and constructive feedback on our manuscript describing the initial performance of the E320 tracker prototype. We appreciate the recognition of the significance of our results in demonstrating the detector's capabilities under challenging conditions. We address each major comment below and have made revisions to the manuscript to strengthen it.
read point-by-point responses
-
Referee: The systematic uncertainty is nearly an order of magnitude larger than the statistical uncertainty. The manuscript should explicitly list and quantify the individual contributions to the systematic error (e.g., from efficiency, background subtraction, or proxy modeling) in a dedicated subsection or table. This is necessary to evaluate the robustness of the rate measurement and its extrapolation to the main experiment.
Authors: We agree that providing a detailed breakdown of the systematic uncertainties will enhance the transparency and allow better evaluation of our results. In the revised manuscript, we have added a dedicated subsection in the Results section that explicitly lists and quantifies the individual contributions to the systematic uncertainty. This includes estimates from tracking efficiency (derived from both data and simulation), background subtraction procedures, uncertainties in the proxy modeling, alignment, and material budget effects. A summary table is also included for clarity. These additions directly address the need to assess the robustness for extrapolation to the primary E320 measurement. revision: yes
-
Referee: The paper relies on the Be-foil positrons as a proxy, but differences in production mechanism (Bremsstrahlung conversion vs. nonlinear BW pair production) imply potential differences in kinematics and correlated backgrounds. The absence of a data set with varied foil parameters or direct comparison to simulated nonlinear BW events means that any tracking biases specific to the main-experiment kinematics would not be apparent. This limits the strength of the claim that the demonstrated performance directly translates to the primary E320 measurement.
Authors: We acknowledge the referee's point regarding the differences in production mechanisms and the resulting implications for kinematics and backgrounds. Our study is an initial performance demonstration using the available proxy data, which was chosen because it provides positrons at rates comparable to the expected nonlinear Breit-Wheeler signal while operating under higher background densities than planned for the main experiment. This serves as a stringent test of the tracking algorithm's ability to handle high occupancy. In the revised manuscript, we have expanded the discussion to explicitly address potential differences in kinematics and their possible impact on tracking performance, drawing on comparisons between proxy simulations and expected nonlinear BW kinematics. We also note the limitations due to the current dataset and outline plans for future validation with varied configurations. While we cannot claim identical conditions, the demonstrated performance under more severe backgrounds provides strong evidence for the tracker's suitability, with the added discussion clarifying the extrapolation. revision: partial
- The current dataset does not include measurements with varied foil parameters or direct experimental comparisons to simulated nonlinear Breit-Wheeler events, which cannot be added without new data taking.
Circularity Check
No circularity: pure experimental measurement with direct data extraction
full rationale
This is an experimental instrumentation paper reporting measured positron rates from beam data. The central result (signal rate of (1.20±0.06_stat±0.56_syst.)×10^{-1} positrons/shot) is obtained by applying an explicitly described Hough-transform seeding plus straight-line fit algorithm to recorded hits, with background subtraction validated by foil-retracted runs. No derivation chain, first-principles prediction, or fitted parameter is presented that reduces to its own inputs by construction. The proxy use of Bremsstrahlung positrons is an experimental choice whose validity is external to the measurement itself; the paper does not claim a derivation or uniqueness theorem. Self-reference to a prior simulation study is limited to detector design context and is not load-bearing for the reported rates. The result is self-contained against external benchmarks (data, retracted runs, simulation comparison).
Axiom & Free-Parameter Ledger
axioms (2)
- domain assumption Positrons from Bremsstrahlung conversion in the Be foil have detection and tracking properties sufficiently similar to nonlinear Breit-Wheeler positrons for the purpose of validating the prototype.
- domain assumption The Hough-transform seeding algorithm followed by a straight-line fit confined to the detector volume correctly identifies and reconstructs true positron tracks at background densities of ~1.7/mm².
Reference graph
Works this paper leans on
-
[1]
O. Borysov, A. Levi, S. Meuren, et al., Prospects for the production and detection of Breit-Wheeler tunneling positrons in Experiment 320 at the FACET–II accelerator, Nucl. Instrum. Meth. A 1083 (2026) 171144.arXiv:2506.04992,doi:10.1016/j.nima.2025.171144
-
[2]
On gauge invariance and vac- uum polarization,
J. Schwinger, On gauge invariance and vacuum polarization, Phys. Rev. 82 (1951) 664–679.doi:10.1103/PhysRev.82.664. URLhttps://link.aps.org/doi/10.1103/PhysRev.82.664
-
[3]
F. Sauter, Über das verhalten eines elektrons im homogenen elektrischen feld nach der relativistischen theorie diracs, Zeitschrift für Physik 69 (11) (1931) 742–764.doi:10.1007/BF01339461. URLhttps://doi.org/10.1007/BF01339461
-
[4]
C. N. Danson, et al., Petawatt and exawatt class lasers worldwide, High Power Laser Science and Engineering 7 (2019) e54.doi: 10.1017/hpl.2019.36
-
[5]
Yakimenko, et al., FACET-II Accelerator Research with Beams of Extreme Intensities, in: Proc
V. Yakimenko, et al., FACET-II Accelerator Research with Beams of Extreme Intensities, in: Proc. of International Particle Accelerator Conference(IPAC’16),Busan,Korea,May8-13,2016,no.7inInternationalParticleAcceleratorConference,JACoW,Geneva,Switzerland, 2016, pp. 1067–1070, doi:10.18429/JACoW-IPAC2016-TUOBB02.doi:doi:10.18429/JACoW-IPAC2016-TUOBB02. URLh...
work page doi:10.18429/jacow-ipac2016-tuobb02.doi:doi:10.18429/jacow-ipac2016-tuobb02 2016
-
[6]
M. Altarelli, R. Brinkmann, M. Chergui, The european x-ray free-electron laser. technical design report, DESY Publication Database (2007). doi:doi:10.3204/DESY_06-097. URLhttps://bib-pubdb1.desy.de/record/77248/
-
[7]
Weber, S
S. Weber, S. Bechet, S. Borneis, et al., P3: An installation for high-energy density plasma physics and ultra-high intensity laser–matter interaction at eli-beamlines, Matter and Radiation at Extremes 2 (4) (2017) 149–176
2017
-
[8]
S.Gales,K.Tanaka,D.Balabanski,etal.,Theextremelightinfrastructure—nuclearphysics(eli-np)facility:newhorizonsinphysicswith10 pw ultra-intense lasers and 20 mev brilliant gamma beams, Reports on Progress in Physics 81 (9) (2018) 094301
2018
-
[9]
D.Papadopoulos,J.Zou,C.LeBlanc,etal.,Theapollon10pwlaser:experimentalandtheoreticalinvestigationofthetemporalcharacteristics, High Power Laser Science and Engineering 4 (2016) e34
2016
-
[10]
J. W. Yoon, Y. G. Kim, I. W. Choi, et al., Realization of laser intensity over 1023 w/cm2, Optica 8 (5) (2021) 630–635
2021
-
[11]
URLhttps://doi.org/10.1038/s41566-024-01550-8
M.Mirzaie,C.I.Hojbota,D.Y.Kim,etal.,All-opticalnonlinearcomptonscatteringperformedwithamulti-petawattlaser,NaturePhotonics 18 (11) (2024) 1212–1217.doi:10.1038/s41566-024-01550-8. URLhttps://doi.org/10.1038/s41566-024-01550-8
-
[12]
N. Zaïm, A. Sainte-Marie, L. Fedeli, et al., Light-matter interaction near the schwinger limit using tightly focused doppler-boosted lasers, Phys. Rev. Lett. 132 (2024) 175002.doi:10.1103/PhysRevLett.132.175002. URLhttps://link.aps.org/doi/10.1103/PhysRevLett.132.175002 O. Borysov et al.:Preprint submitted to ElsevierPage 35 of 45 Initial Performance of t...
-
[13]
A. Matheron, I. Andriyash, X. Davoine, et al., Self-triggered strong-field qed collisions in laser-plasma interaction, Phys. Rev. Res. 7 (2025) L032011.arXiv:2408.13238,doi:10.1103/PhysRevResearch.7.L032011. URLhttps://link.aps.org/doi/10.1103/PhysRevResearch.7.L032011
-
[14]
L. Collaboration, Technical design report for the luxe experiment, The European Physical Journal Special Topics (10 2024).doi:10.1140/ epjs/s11734-024-01164-9. URLhttps://doi.org/10.1140/epjs/s11734-024-01164-9
-
[15]
C. Bamber, et al., Studies of nonlinear QED in collisions of 46.6-GeV electrons with intense laser pulses, Phys. Rev. D 60 (1999) 092004. doi:10.1103/PhysRevD.60.092004
-
[16]
Collaboration, Technical Design Report for the Upgrade of the ALICE Inner Tracking System, J
A. Collaboration, Technical Design Report for the Upgrade of the ALICE Inner Tracking System, J. Phys. G41 (2014) 087002.doi: 10.1088/0954-3899/41/8/087002
-
[17]
G.AglieriRinella,Thealpidepixelsensorchipfortheupgradeofthealiceinnertrackingsystem,NIM.A.845(2017)583–587,proceedings of the Vienna Conference on Instrumentation 2016.doi:https://doi.org/10.1016/j.nima.2016.05.016. URLhttps://www.sciencedirect.com/science/article/pii/S0168900216303825
-
[18]
X. Ai, C. Allaire, N. Calace, et al., A common tracking software project, Computing and Software for Big Science 6 (1) (2022) 8. doi:10.1007/s41781-021-00078-8
-
[19]
C.Accettura,etal.,Towardsamuoncollider,Eur.Phys.J.C83(9)(2023)864,[Erratum:Eur.Phys.J.C84,36(2024)].arXiv:2303.08533, doi:10.1140/epjc/s10052-023-11889-x
-
[20]
C.Emma,N.Majernik,K.K.Swanson,etal.,Experimentalgenerationofextremeelectronbeamsforadvancedacceleratorapplications,Phys. Rev. Lett. 134 (2025) 085001.doi:10.1103/PhysRevLett.134.085001. URLhttps://link.aps.org/doi/10.1103/PhysRevLett.134.085001
-
[21]
V. Yakimenko, L. Alsberg, E. Bong, et al., Facet-ii facility for advanced accelerator experimental tests, Phys. Rev. Accel. Beams 22 (2019) 101301.doi:10.1103/PhysRevAccelBeams.22.101301
-
[22]
D. Storey, C. Zhang, P. San Miguel Claveria, et al., Wakefield generation in hydrogen and lithium plasmas at facet-ii: Diagnostics and first beam-plasma interaction results, Phys. Rev. Accel. Beams 27 (2024) 051302.doi:10.1103/PhysRevAccelBeams.27.051302. URLhttps://link.aps.org/doi/10.1103/PhysRevAccelBeams.27.051302
-
[23]
A. Collaboration, The ALICE experiment at the CERN LHC, Journal of Instrumentation 3 (08) (2008) S08002–S08002.doi:10.1088/ 1748-0221/3/08/s08002. URLhttps://doi.org/10.1088/1748-0221/3/08/s08002
-
[24]
S. Acharya, et al., ALICE upgrades during the LHC Long Shutdown 2, JINST 19 (05) (2024) P05062.arXiv:2302.01238,doi: 10.1088/1748-0221/19/05/P05062
-
[25]
I. Ravasenga, Commissioning and Performance of the New ALICE Inner Tracking System in the First Phase of LHC Run 3, JPS Conf. Proc. 42 (2024) 011002.arXiv:2302.00432,doi:10.7566/JPSCP.42.011002
-
[26]
S. Senyukov, et al., Charged particle detection performances of cmos pixel sensors produced in a 0.18𝜇m process with a high resistivity epitaxial layer, Nuclear Instruments and Methods in Physics Research Section A: Accelerators, Spectrometers, Detectors and Associated Equipment730(2013)115–118,proceedingsofthe9thInternationalConferenceonRadiationEffectso...
-
[27]
G. Aglieri Rinella, G. Chaosong, A. di Mauro, et al., Charge collection properties of towerjazz 180nm cmos pixel sensors in dependence of pixel geometries and bias parameters, studied using a dedicated test-vehicle: The investigator chip, Nuclear Instruments and Methods in Physics Research Section A: Accelerators, Spectrometers, Detectors and Associated E...
-
[28]
D. Dannheim, A. Fiergolski, J. van Hoorne, et al., Comparison of small collection electrode cmos pixel sensors with partial and full lateral depletionofthehigh-resistivityepitaxiallayer,NuclearInstrumentsandMethodsinPhysicsResearchSectionA:Accelerators,Spectrometers, Detectors and Associated Equipment 927 (2019) 187–193.doi:https://doi.org/10.1016/j.nima....
-
[29]
M. Mager, ALPIDE, the Monolithic Active Pixel Sensor for the ALICE ITS upgrade, Nuclear Instruments and Methods in Physics Research Section A: Accelerators, Spectrometers, Detectors and Associated Equipment 824 (2016) 434 – 438, frontier Detectors for Frontier Physics: Proceedings of the 13th Pisa Meeting on Advanced Detectors.doi:https://doi.org/10.1016/...
-
[30]
T. H. Cormen, C. E. Leiserson, R. L. Rivest, C. Stein, Introduction to Algorithms, 3rd Edition, MIT Press, Cambridge, MA, 2009
2009
-
[31]
E.F.Moore,Theshortestpaththroughamaze,in:ProceedingsoftheInternationalSymposiumontheTheoryofSwitching,HarvardUniversity Press, Cambridge, MA, 1959, pp. 285–292
1959
-
[32]
K. L. Brown, A first- and second-order matrix theory for the design of beam transport systems and charged particle spectrometers, Report SLAC-75, Stanford Linear Accelerator Center (June 1982).doi:10.2172/4742148. URLhttps://www.osti.gov/biblio/4742148
-
[33]
P. Ahlburg, S. Arfaoui, J.-H. Arling, et al., EUDAQ—a data acquisition software framework for common beam telescopes, JINST 15 (01) (2020) P01038–P01038.doi:10.1088/1748-0221/15/01/p01038. URLhttps://doi.org/10.1088/1748-0221/15/01/p01038
-
[34]
Y. Liu, M. Amjad, P. Baesso, et al., EUDAQ2—a flexible data acquisition software framework for common test beams, Journal of Instrumentation 14 (10) (2019) P10033–P10033.doi:10.1088/1748-0221/14/10/p10033. URLhttps://doi.org/10.1088/1748-0221/14/10/p10033 O. Borysov et al.:Preprint submitted to ElsevierPage 36 of 45 Initial Performance of the E320 Tracker
-
[35]
A. Santra, N. Tal Hod, A derivation of the electric field inside MAPS detectors from beam-test data and limited TCAD simulations, JINST 18 (05) (2023) P05007.arXiv:2209.03457,doi:10.1088/1748-0221/18/05/P05007
-
[36]
P. V. C. Hough, Machine Analysis of Bubble Chamber Pictures, Conf. Proc. C 590914 (1959) 554–558
1959
- [37]
-
[38]
R. Mankel, Pattern recognition and event reconstruction in particle physics experiments, Reports on Progress in Physics 67 (4) (2004) 553. doi:10.1088/0034-4885/67/4/R03. URLhttps://doi.org/10.1088/0034-4885/67/4/R03
-
[39]
R.Frühwirth,A.Strandlie,PatternRecognition,TrackingandVertexReconstructioninParticleDetectors,ParticleAccelerationandDetection, Springer, 2020.doi:10.1007/978-3-030-65771-0
-
[40]
N.Amram,HoughTransformTrackReconstructionintheCathodeStripChambersinATLAS,Master’sthesis,TelAviv,TelAvivUniversity (2008)
2008
-
[41]
C. Cheshkov, Fast Hough-transform track reconstruction for the ALICE TPC, Nuclear Instruments and Methods in Physics Research Section A:Accelerators,Spectrometers,DetectorsandAssociatedEquipment566(1)(2006)35–39,tIME2005.doi:https://doi.org/10.1016/ j.nima.2006.05.036. URLhttps://www.sciencedirect.com/science/article/pii/S0168900206008059
2006
-
[42]
Storaci, Optimization of the LHCb track reconstruction, J
B. Storaci, Optimization of the LHCb track reconstruction, J. Phys.: Conf. Ser. 664 (7) (2015) 072047.doi:10.1088/1742-6596/664/7/ 072047. URLhttps://cds.cern.ch/record/2017850
-
[43]
S. Navas, et al., Review of particle physics, Phys. Rev. D 110 (3) (2024) 030001.doi:10.1103/PhysRevD.110.030001
-
[44]
V. Blobel, Software alignment for tracking detectors, Nuclear Instruments and Methods in Physics Research Section A: Accelerators, Spectrometers, Detectors and Associated Equipment 566 (1) (2006) 5–13
2006
-
[45]
G. Iadarola, et al., Xsuite: An Integrated Beam Physics Simulation Framework, JACoW HB2023 (2024) TUA2I1.arXiv:2310.00317, doi:10.18429/JACoW-HB2023-TUA2I1
-
[46]
Allison, K
J. Allison, K. Amako, J. Apostolakis, et al., Recent developments in Geant4, Nuclear Instruments and Methods in Physics Research Section A: Accelerators, Spectrometers, Detectors and Associated Equipment 835 (2016) 186–225
2016
-
[47]
Agostinelli, J
S. Agostinelli, J. Allison, K. Amako, et al., Geant4—a simulation toolkit, Nuclear Instruments and Methods in Physics Research Section A: Accelerators, Spectrometers, Detectors and Associated Equipment 506 (3) (2003) 250–303
2003
-
[48]
J. Allison, K. Amako, J. Apostolakis, et al., Geant4 developments and applications, IEEE Transactions on Nuclear Science 53 (1) (2006) 270–278.doi:10.1109/TNS.2006.869826
-
[49]
URLhttp://sunba2.ba.infn.it/MOSAIC/ALICE-ITS/Documents/ALPIDE-operations-manual-version-0_3.pdf
ALICE ITS ALPIDE development team, Alpide operations manual version: 0.3, (7 2016). URLhttp://sunba2.ba.infn.it/MOSAIC/ALICE-ITS/Documents/ALPIDE-operations-manual-version-0_3.pdf
2016
-
[50]
Abovyan, et al., Test of low-dropout voltage regulators with neutrons and protons, JINST 17 (05) (2022) C05006.doi:10.1088/ 1748-0221/17/05/C05006
S. Abovyan, et al., Test of low-dropout voltage regulators with neutrons and protons, JINST 17 (05) (2022) C05006.doi:10.1088/ 1748-0221/17/05/C05006
2022
-
[51]
Robertis, G. De, Fanizzi, G., Loddo, F., Manzari, V., Rizzi, M., A MOdular System for Acquisition, Interface and Control (MOSAIC) of detectors and their related electronics for high energy physics experiment, EPJ Web Conf. 174 (2018) 07002.doi:10.1051/epjconf/ 201817407002. URLhttps://doi.org/10.1051/epjconf/201817407002
-
[52]
L. R. Dalesio, A. Kozubal, M. Kraimer, Epics architecture, Tech. rep., Los Alamos National Lab., NM (United States) (1991)
1991
-
[53]
MOSAIC User’s Manual (7 2015). URLhttps://sunba2.ba.infn.it/MOSAIC/General/Documents/UserManual_V33.pdf Appendix A Power, Trigger & DAQ A schematic overview of the powering scheme, trigger and readout system of the prototype detector is provided in Fig. 21, illustrating the key components, their locations, and connection lengths. The9CAisconnectedtoanoff-...
2015
discussion (0)
Sign in with ORCID, Apple, or X to comment. Anyone can read and Pith papers without signing in.