Recognition: unknown
LStein: A new approach to visualizing sparse 2.5-dimensional data
Pith reviewed 2026-05-08 01:33 UTC · model grok-4.3
The pith
LStein visualizes sparse 2.5D data by linking multiple series in one display to reduce information loss.
A machine-rendered reading of the paper's core claim, the machinery that carries it, and where it could break.
Core claim
LStein (Linking Series to envision information neatly) is a new visualization approach that connects data series to display sparse 2.5D information in two dimensions with minimal loss, motivated by multi-passband lightcurve needs for the Rubin Observatory yet applicable to other domains such as radio astronomy and machine learning.
What carries the argument
LStein (Linking Series to envision information neatly), the Python implementation that links multiple data series together in a single view so that sparse 2.5D structure remains readable on a flat medium.
If this is right
- Multi-passband lightcurves from large surveys can be inspected with fewer missing details than in conventional plots.
- The same display style works for radio astronomy observations that share the sparse 2.5D character.
- Machine-learning hyperparameter searches become easier to interpret when their results are shown as linked 2.5D surfaces.
- Researchers gain a freely installable Python package that generalizes beyond the original astronomy use case.
Where Pith is reading between the lines
- The linking idea might transfer to other forms of dimension reduction where series or slices need to stay aligned.
- Interactive versions could let users toggle links on and off to test information retention in real time.
- Adoption would reduce the common practice of showing only two bands at a time and thereby missing cross-band correlations.
- Similar linking could be tested on non-astronomical sparse data such as sensor arrays or financial time series to check generality.
Load-bearing premise
Linking the series in this specific way actually produces less information loss than existing 2D methods for sparse 2.5D data.
What would settle it
A direct quantitative comparison on a shared sparse 2.5D test set, such as multi-band lightcurves, measuring retained features or user task accuracy between LStein and standard projection techniques.
Figures


read the original abstract
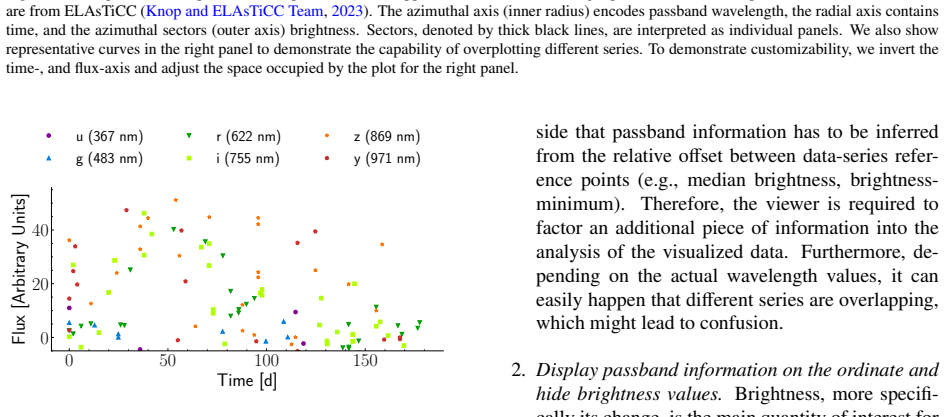
Visualization of high-dimensional data is crucial to retrieve all the knowledge that is contained within a dataset. Effective and informative presentation of three-dimensional data via a two-dimensional medium is challenging, especially if the dataset more closely resembles a 2.5-dimensional (2.5D) entity due to sparse sampling. We present LStein (Linking Series to envision information neatly), a novel visualisation approach implemented in Python, in an attempt to solve this challenge. Inspired by the astrophysical application of displaying photometric timeseries in multiple passbands with minimal loss of information, we compare our method to traditional approaches. While astronomy -- specifically multi-passband visualisation for lightcurves obtained with the Rubin Observatory -- serves as the principal driver for the design, we demonstrate that LStein can be used in any context with 2.5D datasets from radio astronomy to machine learning hyperparameter search visualization. LStein can be installed from GitHub (https://github.com/TheRedElement/LStein).
Editorial analysis
A structured set of objections, weighed in public.
Referee Report
Summary. The paper introduces LStein (Linking Series to envision information neatly), a Python implementation for visualizing sparse 2.5D data such as multi-passband photometric time series. It claims the approach minimizes information loss relative to traditional methods, is motivated by Rubin Observatory light-curve needs, and is broadly applicable to domains including radio astronomy and machine-learning hyperparameter search.
Significance. An effective, open-source tool for 2.5D sparse-data visualization could aid exploratory analysis in large surveys. The GitHub availability of the code is a clear strength for reproducibility and adoption, but the absence of quantitative validation metrics limits the assessed impact.
major comments (1)
- [Abstract] Abstract: the central claim that LStein 'compares favorably' to traditional approaches and incurs 'minimal loss of information' is asserted without any metrics, figures, quantitative results, or description of the linking-series construction itself. This comparison is load-bearing for the paper's contribution and cannot be evaluated from the provided material.
minor comments (2)
- [Abstract] The acronym expansion 'Linking Series to envision information neatly' is somewhat contrived and does not immediately convey the technical approach; a clearer descriptive title or subtitle would improve accessibility.
- [Abstract] No version number, DOI, or citation instructions are supplied for the GitHub repository, which is standard for software papers to ensure long-term reproducibility.
Simulated Author's Rebuttal
We thank the referee for their review and for identifying the need to better substantiate the claims made in the abstract. We address the single major comment below and will incorporate the suggested improvements in a revised manuscript.
read point-by-point responses
-
Referee: [Abstract] Abstract: the central claim that LStein 'compares favorably' to traditional approaches and incurs 'minimal loss of information' is asserted without any metrics, figures, quantitative results, or description of the linking-series construction itself. This comparison is load-bearing for the paper's contribution and cannot be evaluated from the provided material.
Authors: We agree that the abstract currently states the performance claims without sufficient supporting detail. In the revised version we will expand the abstract to include a concise description of the linking-series construction. We will also add explicit references to the comparative figures and any quantitative or semi-quantitative assessments already present in the main text (e.g., visual information-retention examples and domain-specific use cases). If the current manuscript lacks explicit numerical metrics, we will either introduce a simple quantitative measure of information preservation or qualify the language to reflect the qualitative and visual nature of the comparison. revision: yes
Circularity Check
No significant circularity detected in derivation or claims
full rationale
The paper introduces LStein as a new Python implementation for visualizing sparse 2.5D datasets (e.g., multi-passband light curves), with the central claim being its practical utility and minimal information loss relative to traditional methods. No mathematical derivation chain, equations, fitted parameters, or self-referential definitions appear in the provided text. The method is presented as an original construction inspired by astronomy use cases but without any load-bearing steps that reduce to prior inputs by construction, self-citation chains, or ansatz smuggling. The comparison to traditional approaches is asserted as performed but does not rely on circular logic within the manuscript itself. This is a standard case of a self-contained software/visualization contribution with no circularity.
Axiom & Free-Parameter Ledger
Reference graph
Works this paper leans on
-
[1]
write newline
" write newline "" before.all 'output.state := FUNCTION n.dashify 't := "" t empty not t #1 #1 substring "-" = t #1 #2 substring "--" = not "--" * t #2 global.max substring 't := t #1 #1 substring "-" = "-" * t #2 global.max substring 't := while if t #1 #1 substring * t #2 global.max substring 't := if while FUNCTION word.in bbl.in ":" * " " * FUNCTION f...
-
[2]
author Bailes , M. , author Jameson , A. , author Abbate , F. , author Barr , E.D. , author Bhat , N.D.R. , author Bondonneau , L. , author Burgay , M. , author Buchner , S.J. , author Camilo , F. , author Champion , D.J. , author et al. , year 2020 . title The MeerKAT telescope as a pulsar facility: System verification and early science results from Meer...
-
[3]
author Balona , L.A. , author Evers , E.A. , year 1999 . title Mode identification and asteroseismology of delta Scuti stars . journal volume 302 , pages 349--361 . :10.1046/j.1365-8711.1999.02125.x
-
[4]
author Barbary, K. , author Bailey, S. , author Barentsen, G. , author Barclay, T. , author Biswas, R. , author Boone, K. , author Craig, M. , author Feindt, U. , author Friesen, B. , author Goldstein, D. , author Jha, S.W. , author Jones, D.O. , author Mondon, F. , author Papadogiannakis, S. , author Perrefort, D. , author Pierel, J. , author Rodney, S. ...
-
[5]
author Bellinger , E.P. , author de Mink , S.E. , author van Rossem , W.E. , author Justham , S. , year 2024 . title The Potential of Asteroseismology to Resolve the Blue Supergiant Problem . journal volume 967 , pages L39 . :10.3847/2041-8213/ad4990, http://arxiv.org/abs/2311.00038 arXiv:2311.00038
-
[6]
author Booth , R.S. , author de Blok , W.J.G. , author Jonas , J.L. , author Fanaroff , B. , year 2009 . title MeerKAT Key Project Science, Specifications, and Proposals . journal arXiv e-prints , pages arXiv:0910.2935 :10.48550/arXiv.0910.2935, http://arxiv.org/abs/0910.2935 arXiv:0910.2935
-
[7]
, year 2012
author Deng, L. , year 2012 . title The mnist database of handwritten digit images for machine learning research [best of the web] . journal IEEE signal processing magazine volume 29 , pages 141--142
2012
-
[8]
, year = 1997, month = jan, volume =
author Filippenko , A.V. , year 1997 . title Optical Spectra of Supernovae . journal volume 35 , pages 309--355 . :10.1146/annurev.astro.35.1.309
-
[9]
author Fluke, C.J. , author Barnes, D.G. , author Jones, N.T. , year 2009 . title Interchanging interactive 3d graphics for astronomy . journal Publications of the Astronomical Society of Australia volume 26 , pages 64--74 . :10.1071/AS08025
-
[10]
author Fraga , B.M.O. , author Bom , C.R. , author Santos , A. , author Russeil , E. , author Leoni , M. , author Peloton , J. , author Ishida , E.E.O. , author M \"o ller , A. , author Blondin , S. , year 2024 . title Transient classifiers for Fink: Benchmarks for LSST . journal volume 692 , pages A208 . :10.1051/0004-6361/202450370, http://arxiv.org/abs...
-
[11]
author Fritzewski , D.J. , author Vanrespaille , M. , author Aerts , C. , author Guo , Z. , author Hey , D. , author De Ridder , J. , year 2025 . title Mode identification and ensemble asteroseismology of 119 Cep stars detected by Gaia light curves and monitored by TESS . journal volume 698 , pages A253 . :10.1051/0004-6361/202451721, http://arxiv.org/abs...
-
[12]
author Hambleton , K.M. , author Bianco , F.B. , author Street , R. , author Bell , K. , author Buckley , D. , author Graham , M. , author Hernitschek , N. , author Lund , M.B. , author Mason , E. , author Pepper , J. , author Pr s a , A. , author Rabus , M. , author Raiteri , C.M. , author Szab \'o , R. , author Szkody , P. , author Andreoni , I. , autho...
-
[13]
D., 2007, @doi [Computing in Science Engineering] 10.1109/MCSE.2007.55 , 9, 90
author Hunter, J.D. , year 2007 . title Matplotlib: A 2d graphics environment . journal Computing in Science & Engineering volume 9 , pages 90--95 . :10.1109/MCSE.2007.55
-
[14]
author Ivezi \'c , Z . , author Kahn , S.M. , author Tyson , J.A. , author Abel , B. , author Acosta , E. , author Allsman , R. , author Alonso , D. , author AlSayyad , Y. , author Anderson , S.F. , author Andrew , J. , author Angel , J.R.P. , author Angeli , G.Z. , author Ansari , R. , author Antilogus , P. , author Araujo , C. , author Armstrong , R. , ...
-
[15]
The Thousand-Pulsar-Array programme on MeerKAT – I. Science objectives and first results
author Johnston , S. , author Karastergiou , A. , author Keith , M.J. , author Song , X. , author Weltevrede , P. , author Abbate , F. , author Bailes , M. , author Buchner , S. , author Camilo , F. , author Geyer , M. , author Hugo , B. , author Jameson , A. , author Kramer , M. , author Parthasarathy , A. , author Reardon , D.J. , author Ridolfi , A. , ...
-
[16]
, author ELAsTiCC Team , year 2023
author Knop , R. , author ELAsTiCC Team , year 2023 . title Simulated Transient Alerts and Broker Classifications for ELAsTiCC , in: booktitle American Astronomical Society Meeting Abstracts \#241 , p. pages 117.02
2023
-
[17]
, author Bohlin , R
author Koornneef , J. , author Bohlin , R. , author Buser , R. , author Horne , K. , author Turnshek , D. , year 1986 . title Synthetic photometry and the calibration of the Hubble Space Telescope. journal Highlights of Astronomy volume 7 , pages 833--843
1986
-
[18]
author Kramer , M.A. , year 1991 . title Nonlinear principal component analysis using autoassociative neural networks . journal AIChE Journal volume 37 , pages 233--243 . :10.1002/aic.690370209
-
[19]
author Levi , M. , author Allen , L.E. , author Raichoor , A. , author Baltay , C. , author BenZvi , S. , author Beutler , F. , author Bolton , A. , author Castander , F.J. , author Chuang , C.H. , author Cooper , A. , author Cuby , J.G. , author Dey , A. , author Eisenstein , D. , author Fan , X. , author Flaugher , B. , author Frenk , C. , author Gonzal...
-
[20]
author Llamas Lanza , M. , author Karpov , S. , author Russeil , E. , author Quintin , E. , author Ishida , E.E.O. , author Peloton , J. , author Pruzhinskaya , M.V. , author M \"o ller , A. , year 2026 . title Early identification of optical tidal disruption events: A science module for the Fink broker . journal volume 705 , pages A144 . :10.1051/0004-63...
-
[21]
, year 1997
author Maass, W. , year 1997 . title Networks of spiking neurons: the third generation of neural network models . journal Neural networks volume 10 , pages 1659--1671
1997
-
[22]
, year 1967
author Mandelbrot, B. , year 1967 . title How long is the coast of britain? statistical self-similarity and fractional dimension . journal science volume 156 , pages 636--638
1967
-
[23]
author M \"o ller , A. , author de Boissi \`e re , T. , year 2020 . title SuperNNova: an open-source framework for Bayesian, neural network-based supernova classification . journal volume 491 , pages 4277--4293 . :10.1093/mnras/stz3312, http://arxiv.org/abs/1901.06384 arXiv:1901.06384
-
[24]
author M \"o ller , A. , author Ishida , E. , author Peloton , J. , author Vidal Vel \'a zquez , O. , author Soon , J. , author Martin , B. , author Cluver , M. , author Leoni , M. , author Taylor , E.N. , year 2025 . title Real-time active learning for optimised spectroscopic follow-up: Enhancing early SN Ia classification with the Fink broker . journal ...
-
[25]
author M \"o ller , A. , author Peloton , J. , author Ishida , E.E.O. , author Arnault , C. , author Bachelet , E. , author Blaineau , T. , author Boutigny , D. , author Chauhan , A. , author Gangler , E. , author Hernandez , F. , author et al. , year 2021 . title FINK, a new generation of broker for the LSST community . journal volume 501 , pages 3272--3...
-
[26]
, year 2009
author Moreland, K. , year 2009 . title Diverging color maps for scientific visualization , in: booktitle International symposium on visual computing , organization Springer . pp. pages 92--103
2009
-
[27]
, year 2015
author Moreland, K.D. , year 2015 . title Why We Use Bad Color Maps and What You Can Do About It. type Technical Report . Sandia National Laboratories (SNL-NM), Albuquerque, NM (United States)
2015
-
[28]
author Pel \'a ez-Torres , A. , author Esparza-Borges , E. , author Pall \'e , E. , author Parviainen , H. , author Murgas , F. , author Morello , G. , author Zapatero-Osorio , M.R. , author Korth , J. , author Narita , N. , author Fukui , A. , author Carleo , I. , author Luque , R. , author Garc \' a , N.A. , author Barkaoui , K. , author Boyle , A. , au...
-
[29]
, year 2015
author Plotly Technologies Inc. , year 2015 . title Collaborative data science . https://plot.ly
2015
-
[30]
author Russeil , E. , author Malanchev , K.L. , author Aleo , P.D. , author Ishida , E.E.O. , author Pruzhinskaya , M.V. , author Gangler , E. , author Lavrukhina , A.D. , author Volnova , A.A. , author Voloshina , A. , author Semenikhin , T. , author et al. , year 2024 . title RAINBOW: A colorful approach to multipassband light-curve estimation . journal...
-
[31]
, author Brette, R
author Stimberg, M. , author Brette, R. , author Goodman, D.F. , year 2019 . title Brian 2, an intuitive and efficient neural simulator . journal elife volume 8 , pages e47314
2019
-
[32]
, author Drake, F.L
author Van Rossum, G. , author Drake, F.L. , year 2009 . title Python 3 Reference Manual . publisher CreateSpace , address Scotts Valley, CA
2009
discussion (0)
Sign in with ORCID, Apple, or X to comment. Anyone can read and Pith papers without signing in.