Recognition: unknown
A Motif-Based Framework for Decomposing Risk Spillovers
Pith reviewed 2026-05-07 13:53 UTC · model grok-4.3
The pith
Risk spillover networks contain local triadic motifs whose analysis yields portfolios with better risk-adjusted returns than standard methods and identifies tail-risk transmitters.
A machine-rendered reading of the paper's core claim, the machinery that carries it, and where it could break.
Core claim
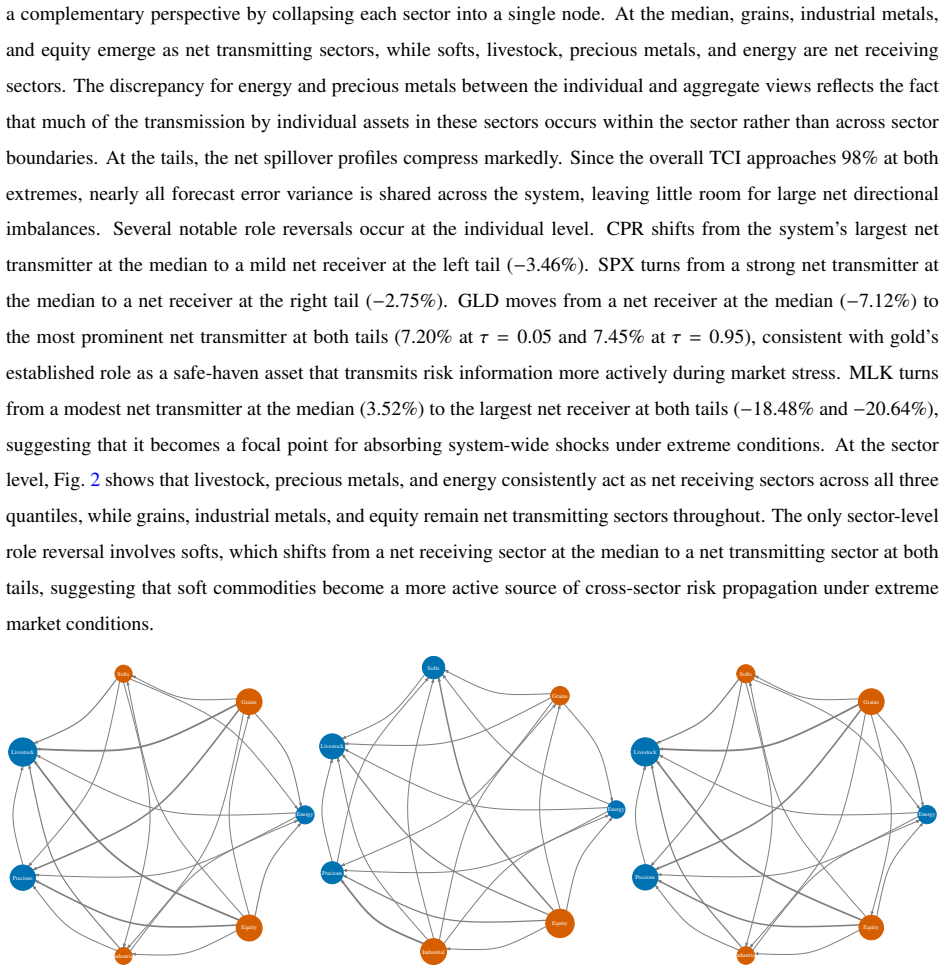
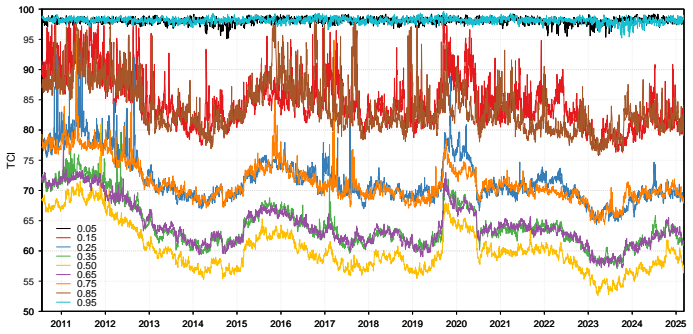
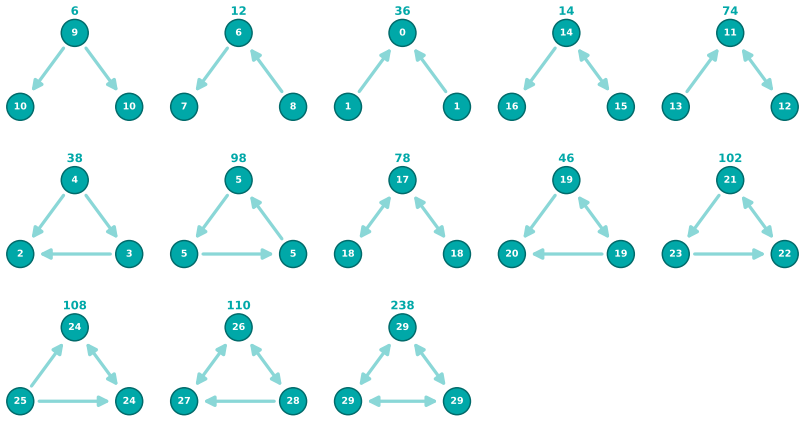
The central claim is that a motif-based framework first extracts multiscale backbones from quantile connectedness networks, then identifies directed triadic motifs whose frequencies exceed randomization baselines, and incorporates colored motifs under sector partitions together with orbit positions that record each asset's structural role. When this framework is applied to 39 commodity and equity futures across lower, median, and upper quantiles, the resulting motif-based portfolios outperform minimum-correlation and minimum-connectedness benchmarks on risk-adjusted returns. In tail networks the same orbit-position diversity measure identifies assets that act as net spillover transmitters, a
What carries the argument
Directed triadic motifs extracted from quantile connectedness networks, together with their orbit positions and sector-colored variants, which isolate local structural roles that generate spillovers.
If this is right
- Motif-based portfolios can be constructed by weighting assets according to their orbit positions inside significant triadic motifs.
- Sector-colored motifs distinguish how asset identities shape local spillover structures at different levels of granularity.
- Orbit-position diversity serves as a marker that distinguishes net transmitters from receivers specifically in tail quantile networks.
- Local triadic topology supplies portfolio-relevant signals that aggregate connectedness measures overlook.
- The framework decomposes systemic risk into motif-level components that remain visible across lower, median, and upper conditional quantiles.
Where Pith is reading between the lines
- If orbit-position diversity reliably flags transmitters in tails, regulators could monitor motif diversity statistics as an early indicator of concentrated influence.
- The same motif extraction steps could be tested on other directed networks such as interbank lending or supply-chain exposures to see whether positional diversity marks influence more broadly.
- Portfolio rebalancing rules that tilt toward high-diversity orbit assets only during high-volatility regimes might reduce drawdowns beyond what the paper tests.
Load-bearing premise
That the statistically significant directed triadic motifs and their orbit positions genuinely capture the local interaction patterns driving systemic risk rather than reflecting choices in network construction or randomization thresholds.
What would settle it
Re-running the portfolio tests on an independent set of futures returns and finding that motif-based strategies no longer outperform the minimum-correlation and minimum-connectedness benchmarks would show the claimed advantage does not hold.
Figures


read the original abstract
Connectedness measures quantify aggregate risk spillovers but obscure the local interaction patterns that generate systemic risk. We develop a motif-based framework that first extracts multiscale backbones from quantile connectedness networks and then identifies directed triadic motifs whose frequencies exceed randomization baselines. To distinguish how assets' sectoral identities shape local spillover structures, we introduce colored motifs under sector partitions of increasing granularity. Using orbit positions that capture each node's structural role within directed triadic motifs, we construct portfolio strategies that exploit an asset's place in the spillover architecture. Applying the framework to 39 commodity and equity futures across lower, median, and upper conditional quantiles, we find that motif-based portfolios outperform minimum correlation and minimum connectedness benchmarks on risk-adjusted returns. We further show that in tail networks, assets with greater orbit-position diversity tend to act as net spillover transmitters rather than receivers, establishing positional diversity as a tail-specific marker of systemic influence. These findings demonstrate that local triadic topology carries portfolio-relevant information that aggregate connectedness measures miss.
Editorial analysis
A structured set of objections, weighed in public.
Referee Report
Summary. The manuscript develops a motif-based framework for decomposing risk spillovers in financial networks. It extracts multiscale backbones from quantile connectedness networks, identifies directed triadic motifs whose frequencies exceed randomization baselines, introduces sector-colored motif variants, and uses orbit positions to construct portfolio strategies that exploit local spillover architecture. Applied to 39 commodity and equity futures across lower, median, and upper quantiles, the paper claims motif-based portfolios outperform minimum-correlation and minimum-connectedness benchmarks on risk-adjusted returns and that greater orbit-position diversity marks net spillover transmitters specifically in tail networks.
Significance. If the empirical claims hold under scrutiny, the work would advance financial network analysis by shifting focus from aggregate connectedness to local triadic structures and positional roles, offering a decomposition of how sectoral identities shape spillover patterns. The portfolio outperformance and tail-specific diversity finding provide concrete, falsifiable predictions with potential applications in risk monitoring and strategy design. The use of randomization baselines and colored motifs under varying granularity is a methodological strength that could generalize beyond the current dataset.
major comments (3)
- [§4] §4 (Portfolio construction): The rules for translating orbit positions into long/short weights and selecting which motifs/orbits to exploit are not fully specified with pre-determined criteria; multiple choices (quantile levels, backbone thresholds, motif significance cutoffs, sector partitions) create scope for the reported outperformance to arise from in-sample tuning on the 39-asset panel rather than robust structural signals.
- [§5.2] §5.2 (Tail-network results): The claim that orbit-position diversity marks net transmitters lacks controls for confounding factors such as asset volatility, market capitalization, or sector fixed effects, and no formal statistical test (e.g., regression of net spillover on diversity with robustness checks) is reported; this undermines the interpretation as a tail-specific marker of systemic influence.
- [Table 3] Table 3 (Performance metrics): The risk-adjusted return comparisons do not include p-values for differences versus benchmarks, adjustments for multiple testing across quantiles and motif variants, or sensitivity to rebalancing frequency and transaction costs; these omissions are load-bearing for the central outperformance claim.
minor comments (2)
- [Figure 2] Figure 2 (Motif examples): The visualization of directed triadic motifs and orbit positions would benefit from explicit labeling of each orbit and a legend for sector colors to improve readability.
- [§3.1] Notation in §3.1: The definition of 'orbit-position diversity' should include an explicit formula or pseudocode, as the current description leaves ambiguity about how diversity is aggregated across motifs.
Simulated Author's Rebuttal
We appreciate the referee's detailed and constructive feedback on our manuscript. We address each of the major comments below, providing clarifications and indicating where revisions will be made to enhance the robustness and transparency of our results.
read point-by-point responses
-
Referee: §4 (Portfolio construction): The rules for translating orbit positions into long/short weights and selecting which motifs/orbits to exploit are not fully specified with pre-determined criteria; multiple choices (quantile levels, backbone thresholds, motif significance cutoffs, sector partitions) create scope for the reported outperformance to arise from in-sample tuning on the 39-asset panel rather than robust structural signals.
Authors: We thank the referee for highlighting this important aspect of transparency in our methodology. Upon review, we agree that additional details on the pre-determined criteria would strengthen the paper. In the revised version, we will explicitly document the rules for mapping orbit positions to portfolio weights, including fixed thresholds for motif detection and backbone extraction chosen based on prior literature and theoretical motivations rather than sample-specific optimization. Furthermore, we will perform and report robustness checks by varying these parameters to confirm that the outperformance persists. revision: yes
-
Referee: §5.2 (Tail-network results): The claim that orbit-position diversity marks net transmitters lacks controls for confounding factors such as asset volatility, market capitalization, or sector fixed effects, and no formal statistical test (e.g., regression of net spillover on diversity with robustness checks) is reported; this undermines the interpretation as a tail-specific marker of systemic influence.
Authors: We acknowledge the need for more rigorous statistical validation of this finding. In the revision, we will add a multivariate regression framework where net spillover is regressed on orbit-position diversity, including controls for volatility, market cap, and sector dummies. We will present results with standard errors clustered appropriately and conduct robustness checks across different model specifications and subsample periods. revision: yes
-
Referee: Table 3 (Performance metrics): The risk-adjusted return comparisons do not include p-values for differences versus benchmarks, adjustments for multiple testing across quantiles and motif variants, or sensitivity to rebalancing frequency and transaction costs; these omissions are load-bearing for the central outperformance claim.
Authors: We agree that providing statistical tests and sensitivity analyses is crucial for substantiating the performance claims. We will update Table 3 to include p-values for the Sharpe ratio and other risk-adjusted metric differences, employing bootstrap or HAC standard errors as appropriate. We will also implement multiple testing corrections and add panels or supplementary tables showing results under different rebalancing frequencies and after accounting for reasonable transaction costs. revision: yes
Circularity Check
No significant circularity in the motif-based framework derivation
full rationale
The paper defines a framework that extracts multiscale backbones from quantile connectedness networks, identifies directed triadic motifs exceeding randomization baselines, introduces sector-colored variants, and uses orbit positions to build portfolios. The reported results are empirical applications to 39 futures datasets across quantiles, showing outperformance versus minimum-correlation and minimum-connectedness benchmarks plus a correlation between orbit diversity and net transmission in tails. These outcomes are measured against external benchmarks on held data and do not reduce by construction to the framework's own definitions, fitted parameters, or self-citations; the chain remains independent and falsifiable.
Axiom & Free-Parameter Ledger
axioms (2)
- domain assumption Quantile connectedness networks accurately represent conditional risk spillovers at different quantiles.
- domain assumption Motif frequencies that exceed those obtained from randomized networks indicate structurally meaningful local patterns.
invented entities (2)
-
colored motifs
no independent evidence
-
orbit positions
no independent evidence
Reference graph
Works this paper leans on
-
[1]
American Economic Review 105, 564–608
Systemic Risk and Stability in Financial Networks. American Economic Review 105, 564–608. doi:10.1257/aer.20130456. 36 Adams, Z., Collot, S., Kartsakli, M.,
-
[2]
Have commodities become a financial asset? evidence from ten years of Financialization. Energy Economics 89, 104769. doi:10.1016/j.eneco.2020.104769. Adams, Z., Glück, T.,
-
[3]
doi:10.1016/j.jbankfin.2015.07.008
Financialization in commodity markets: A passing trend or the new normal? Journal of Banking & Finance 60, 93–111. doi:10.1016/j.jbankfin.2015.07.008. Alon, U.,
-
[4]
Quantile Connectedness: Modeling Tail Behavior in the Topology of Financial Networks. Management Science 68, 2401–2431. doi:10.1287/mnsc.2021.3984. Antonakakis, N., Chatziantoniou, I., Gabauer, D.,
-
[5]
Crude oil futures contracts and commodity markets: new evidence from a TVP-V AR extended joint connectedness approach. Resources Policy 73, 102219. doi:10.1016/j.resourpol. 2021.102219. Baruník, J., K ˇrehlík, T.,
-
[6]
Journal of Financial Econometrics 16, 271–296
Measuring the frequency dynamics of financial connectedness and systemic risk. Journal of Financial Econometrics 16, 271–296. doi:10.1093/jjfinec/nby001. Basak, S., Pavlova, A.,
-
[7]
Journal of Finance 71, 1511–1556
A model of financialization of commodities. Journal of Finance 71, 1511–1556. doi:10.1111/jofi.12408. Battiston, S., Farmer, J.D., Flache, A., Garlaschelli, D., Haldane, A.G., Heesterbeek, H., Hommes, C., Jaeger, C., May, R.M., Scheffer, M.,
-
[8]
doi:10.1126/science.aad9029. Bhattacharjee, B., Maiti, M.,
-
[9]
Broadstock, D.C., Chatziantoniou, I., Gabauer, D.,
doi:10.3390/risks13040076. Broadstock, D.C., Chatziantoniou, I., Gabauer, D.,
-
[10]
Minimum Connectedness Portfolios and the Market for Green Bonds: Advocating Socially Responsible Investment (SRI) Activity, in: Floros, C., Chatziantoniou, I. (Eds.), Applications in Energy Finance: The Energy Sector, Economic Activity, Financial Markets and the Environment. Palgrave Macmillan, Cham, pp. 217–253. doi:10.1007/978-3-030-92957-2_9. 37 Chatzi...
-
[11]
Oil price shocks and exchange rate dynamics: Evidence from decomposed and partial connectedness measures for oil importing and exporting economies. Energy Economics 120, 106627. doi:10.1016/j.eneco.2023.106627. Chatziantoniou, I., Gabauer, D., Stenfors, A.,
-
[12]
Interest rate swaps and the transmission mechanism of monetary policy: A quantile connectedness approach. Economics Letters 204, 109891. doi:10.1016/j.econlet.2021. 109891. Christoffersen, P., Errunza, V ., Jacobs, K., Jin, X.,
-
[13]
International Journal of Forecasting 30, 807–824
Correlation dynamics and international diversification benefits. International Journal of Forecasting 30, 807–824. doi:10.1016/j.ijforecast.2014.01.001. Cunado, J., Chatziantoniou, I., Gabauer, D., Perez de Gracia, F., Marfatia, H.,
-
[14]
Journal of Commodity Markets 30, 100327
Dynamic spillovers across precious metals and oil realized volatilities: Evidence from quantile extended joint connectedness measures. Journal of Commodity Markets 30, 100327. doi:10.1016/j.jcomm.2023.100327. Demirer, M., Diebold, F.X., Liu, L., Yilmaz, K.,
-
[15]
Journal of Applied Econometrics 33, 1–15
Estimating global bank network connectedness. Journal of Applied Econometrics 33, 1–15. doi:10.1002/jae.2585. Diebold, F.X., Yilmaz, K.,
-
[16]
The Economic Journal 119, 158–171
Measuring Financial Asset Return and V olatility Spillovers, with Application to Global Equity Markets. The Economic Journal 119, 158–171. doi:10.1111/j.1468-0297.2008.02208.x. Diebold, F.X., Yilmaz, K.,
-
[17]
International Journal of Forecasting 28, 57–66
Better to give than to receive: Predictive directional measurement of volatility spillovers. International Journal of Forecasting 28, 57–66. doi:10.1016/j.ijforecast.2011.02.006. Diebold, F.X., Yilmaz, K.,
-
[18]
Journal of Econometrics 182, 119–134
On the network topology of variance decompositions: Measuring the connectedness of financial firms. Journal of Econometrics 182, 119–134. doi:10.1016/j.jeconom.2014.04.012. Eagle, N., Macy, M., Claxton, R.,
-
[19]
Network diversity and economic development. Science 328, 1029–1031. doi:10.1126/science.1186605. Gabauer, D., Gupta, R.,
-
[20]
On the transmission mechanism of country-specific and international economic un- certainty spillovers: Evidence from a TVP-V AR connectedness decomposition approach. Economics Letters 171, 63–71. doi:10.1016/j.econlet.2018.07.007. Haldane, A.G., May, R.M.,
-
[21]
Journal of Commodity Markets 30, 100284
Quantile dependencies and connectedness between stock and precious metals markets. Journal of Commodity Markets 30, 100284. doi:10.1016/j.jcomm.2022.100284. Kang, W., Tang, K., Wang, N.,
-
[22]
Journal of Commodity Markets 30, 100313
Financialization of commodity markets ten years later. Journal of Commodity Markets 30, 100313. doi:10.1016/j.jcomm.2023.100313. 38 Kirkley, A.,
-
[23]
Fast Nonparametric Inference of Network Backbones for Weighted Graph Sparsification. Physical Review X 15, 031013. doi:10.1103/4pg6-mtmt. Kobayashi, T., Takaguchi, T.,
-
[24]
Journal of Banking & Finance 97, 20–36
Identifying relationship lending in the interbank market: A network approach. Journal of Banking & Finance 97, 20–36. doi:10.1016/j.jbankfin.2018.09.018. Lastrapes, W.D., Wiesen, T.F.P.,
-
[25]
Economic Modelling 94, 681–691
The joint spillover index. Economic Modelling 94, 681–691. doi:10.1016/ j.econmod.2020.02.010. Liu, Y ., Li, H., Guan, J.,
2020
-
[26]
Portfolio selection. Journal of Finance 7, 77–91. doi:10.2307/2975974. Masuda, N., Boyd, Z.M., Garlaschelli, D., Mucha, P.J.,
-
[27]
Introduction to correlation networks: interdisciplinary approaches beyond thresholding. Physics Reports 1136, 1–39. doi:10.1016/j.physrep.2025.06.002. Mensi, W., Yousaf, I., V o, X.V ., Kang, S.H.,
-
[28]
Journal of International Financial Markets, Institutions and Money 76, 101487
Asymmetric spillover and network connectedness between gold, Brent oil and EU subsector markets. Journal of International Financial Markets, Institutions and Money 76, 101487. doi:10.1016/j.intfin.2021.101487. Milo, R., Itzkovitz, S., Kashtan, N., Levitt, R., Shen-Orr, S., Ayzenshtat, I., Sheffer, M., Alon, U.,
-
[29]
Superfamilies of evolved and designed networks. Science 303, 1538–1542. doi:10.1126/science.1089167. Milo, R., Shen-Orr, S., Itzkovitz, S., Kashtan, N., Chklovskii, D., Alon, U.,
-
[30]
Network motifs: Simple building blocks of complex networks. Science 298, 824–827. doi:10.1126/science.298.5594.824. Naifar, N.,
-
[31]
Pattern Recognition 127 (2022), 108611
Decomposed and partial connectedness between oil shocks and sovereign credit risk in emerging economies: Insights from the Russia-Ukraine war. Journal of Commodity Markets 39, 100492. doi:10.1016/j. jcomm.2025.100492. Ohnishi, T., Takayasu, H., Takayasu, M.,
work page doi:10.1016/j 2025
-
[32]
Journal of Economic Interaction and Coordination 5, 171–180
Network motifs in an inter-firm network. Journal of Economic Interaction and Coordination 5, 171–180. doi:10.1007/s11403-010-0066-6. Pagnottoni, P., Spelta, A.,
-
[33]
Statistical Methods & Applications 33, 131–151
Statistically validated coherence and intensity in temporal networks of information flows. Statistical Methods & Applications 33, 131–151. doi:10.1007/s10260-023-00724-y. Qian, J., Hintze, A., Adami, C.,
-
[34]
Colored Motifs Reveal Computational Building Blocks in the C. elegans Brain. PLoS ONE 6, e17013. doi:10.1371/journal.pone.0017013. Ribeiro, P., Silva, F.,
-
[35]
Data Mining and Knowledge Discovery 28, 337–377
G-tries: a data structure for storing and finding subgraphs. Data Mining and Knowledge Discovery 28, 337–377. doi:10.1007/s10618-013-0303-4. 39 Serrano, M.Á., Boguñá, M., Vespignani, A.,
-
[36]
A partial correlation-based connectedness approach: Ex- treme dependence among commodities and portfolio implications. Energy Economics 144, 108421. doi:10.1016/ j.eneco.2025.108421. Shen-Orr, S.S., Milo, R., Mangan, S., Alon, U.,
-
[37]
Network motifs in the transcriptional regulation network of Escherichia coli. Nature Genetics 31, 64–68. doi:10.1038/ng881. Shi, H.L., Chen, H.,
-
[38]
Global Finance Journal 64, 101079
Quantile return connectedness of theme factors and portfolio implications: Evidence from the US and China. Global Finance Journal 64, 101079. doi:10.1016/j.gfj.2025.101079. Sporns, O., Kötter, R.,
-
[39]
Motifs in Brain Networks. PLOS Biology 2, e369. doi:10.1371/journal.pbio. 0020369. Squartini, T., van Lelyveld, I., Garlaschelli, D.,
-
[40]
Stenfors, A., Chatziantoniou, I., Gabauer, D.,
doi:10.1038/srep03357. Stenfors, A., Chatziantoniou, I., Gabauer, D.,
-
[41]
Journal of International Financial Markets, Institutions & Money 81, 101658
Independent policy, dependent outcomes: A game of cross- country dominoes across european yield curves. Journal of International Financial Markets, Institutions & Money 81, 101658. doi:10.1016/j.intfin.2022.101658. Stouffer, D.B., Camacho, J., Jiang, W., Amaral, L.A.N.,
-
[42]
Proceedings of the Royal Society B: Biological Sciences 274, 1931–1940
Evidence for the existence of a robust pattern of prey selection in food webs. Proceedings of the Royal Society B: Biological Sciences 274, 1931–1940. doi:10.1098/ rspb.2007.0571. Tang, K., Xiong, W.,
-
[43]
Financial Analysts Journal 68, 54–74
Index investment and the financialization of commodities. Financial Analysts Journal 68, 54–74. doi:10.2469/faj.v68.n6.5. Xie, W.J., Li, M.Y ., Zhou, W.X.,
-
[44]
Xie, W.J., Yong, Y ., Wei, N., Yue, P., Zhou, W.X.,
doi:10.1140/epjds/s13688-017-0105-9. Xie, W.J., Yong, Y ., Wei, N., Yue, P., Zhou, W.X.,
-
[45]
The North American Journal of Economics and Finance 58, 101459
Identifying states of global financial market based on information flow network motifs. The North American Journal of Economics and Finance 58, 101459. doi:10. 1016/j.najef.2021.101459. 40 Yang, Y .H., Shao, Y .H., Zhou, W.X.,
-
[46]
Finance Research Letters 71, 106374
Contemporaneous and lagged spillovers between agriculture, crude oil, carbon emission allowance, and climate change. Finance Research Letters 71, 106374. doi:10.1016/j.frl. 2024.106374. Yaveroglu, O.N., Malod-Dognin, N., Davis, D., Levnaji ´c, Z., Jani ´c, V ., Karapandza, R., Stojmirovi ´c, A., Pržulj, N.,
-
[47]
41 Appendix A
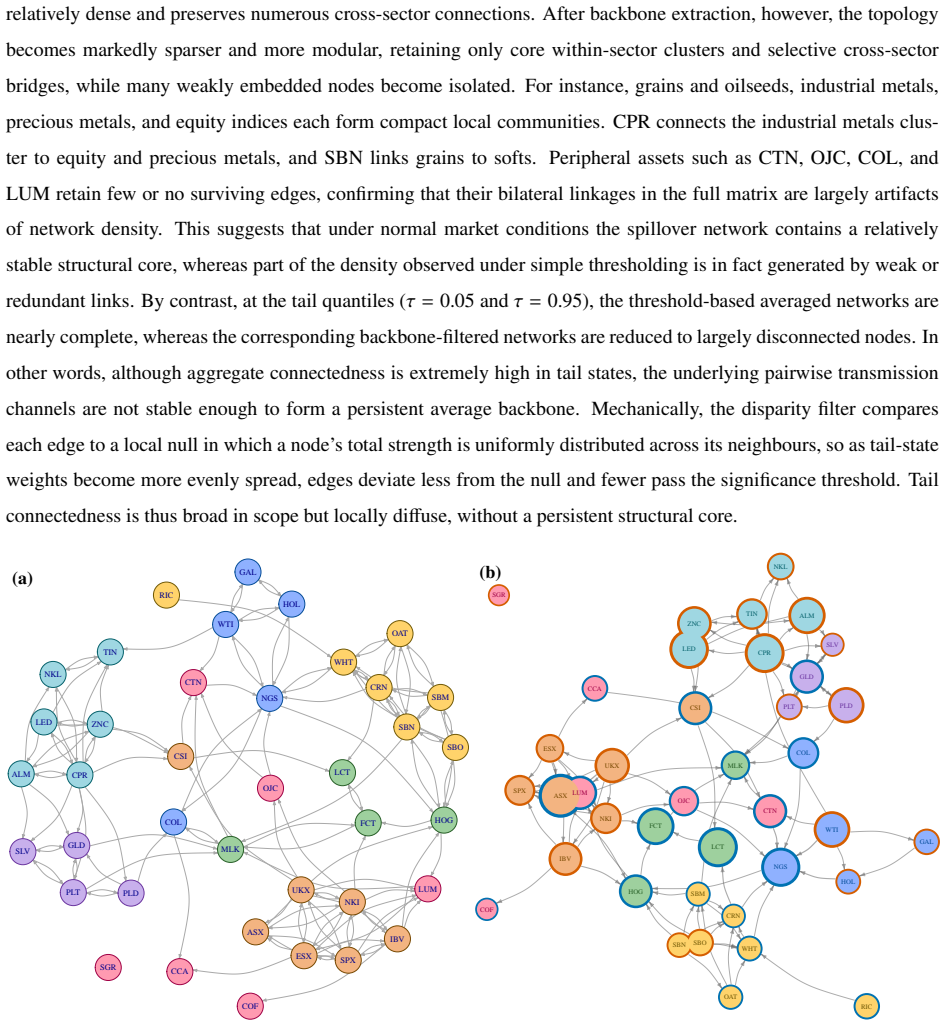
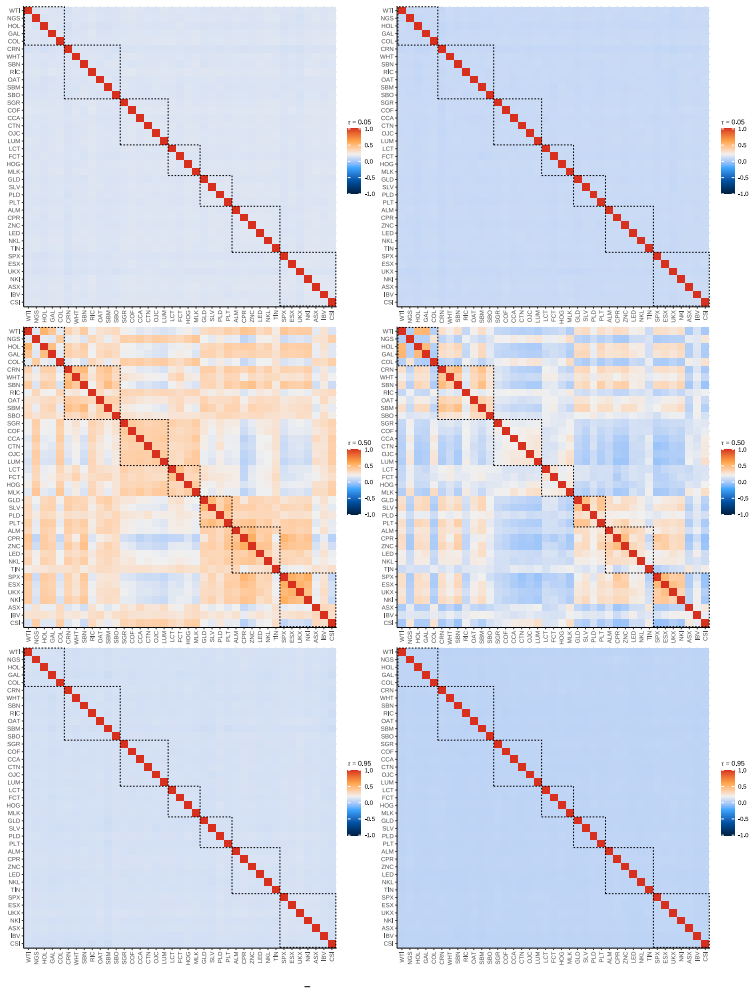
doi:10.1038/ srep04547. 41 Appendix A. Risk spillovers and network backbones at the tail quantiles CSI IBV ASX NKI UKX ESX SPX TIN NKL LED ZNC CPR ALM PLD PLT SLV GLD MLK HOG FCT LCT LUM OJC CTN CCA COF SGR SBO SBM OAT RIC SBN WHT CRN COL GAL HOL NGS WTI WTI NGS HOL GAL COL CRN WHT SBN RIC OAT SBM SBO SGR COF CCA CTN OJC LUM LCT FCT HOG MLK GLD SLV PLT PL...
2011
discussion (0)
Sign in with ORCID, Apple, or X to comment. Anyone can read and Pith papers without signing in.