Recognition: unknown
Prediction of Celestial Pole Offsets Based on Sliding Window and Bivariate Least Squares Fitting
Pith reviewed 2026-05-07 12:37 UTC · model grok-4.3
The pith
A 900-day sliding window combined with bivariate least squares fitting improves Celestial Pole Offset predictions over standard IERS values.
A machine-rendered reading of the paper's core claim, the machinery that carries it, and where it could break.
Core claim
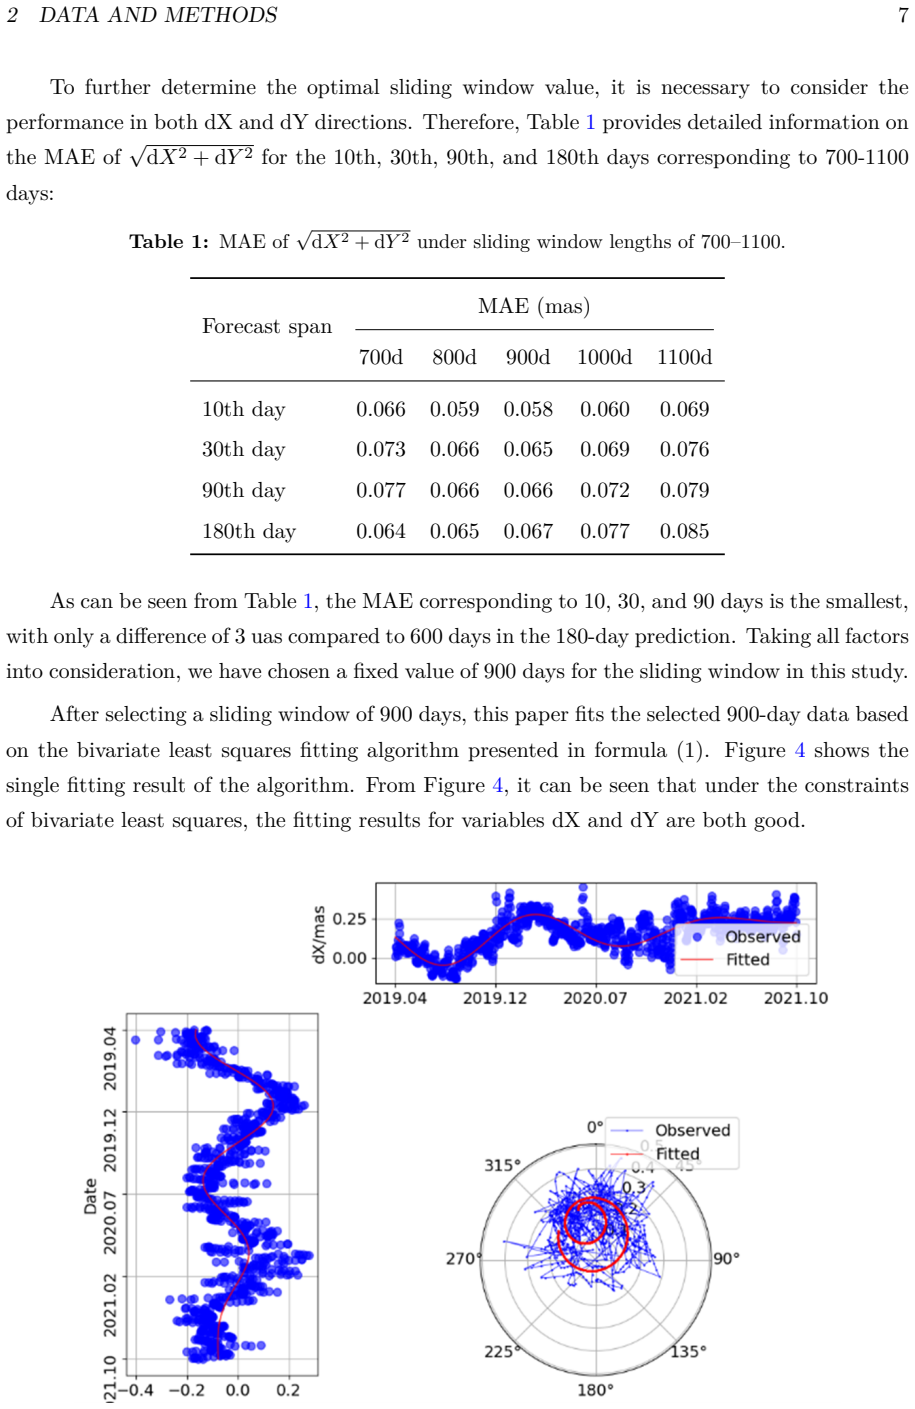
The algorithm that selects a 900-day sliding window and performs bivariate least squares fitting on the historical dX and dY series produces extrapolation predictions whose mean absolute errors are lower than those from the top teams in the Second Earth Orientation Parameters Prediction Comparison Campaign and reduce errors relative to IERS daily publications by 53 percent, 59 percent, and 60 percent for dX at the 10th, 30th, and 57th days and by 35 percent, 38 percent, and 42 percent for dY at the same horizons.
What carries the argument
Sliding window of 900 days chosen by historical experiment, followed by bivariate least squares fitting that extrapolates the two offset components simultaneously.
If this is right
- The same procedure yields improved accuracy on both the EOP 14 C04 and the later EOP 20 C04 series.
- Combined dX and dY performance exceeds the best single-component results from the participating teams in the 2nd EOP PCC.
- Forecast skill remains high across the full range of tested horizons from 10 to 57 days.
- Operational daily CPO values published by IERS can be replaced by this extrapolation with measurable error reduction.
Where Pith is reading between the lines
- The bivariate fitting step may be isolating periodic signals in the offsets that standard linear or univariate models overlook.
- If the window length proves stable, the same sliding-window approach could be tested on other Earth orientation parameters such as polar motion.
- Extending the forecast horizon beyond 57 days would reveal whether the method eventually degrades or continues to hold.
- Blending the least-squares extrapolation with other short-term predictors might produce even tighter bounds for real-time applications.
Load-bearing premise
The 900-day window length found optimal on past records will remain suitable for future periods and the bivariate fit will continue to capture the dominant behavior without missing longer trends or overfitting noise.
What would settle it
A drop in the reported error reductions to below 20 percent on data recorded after the study period, especially at the 57-day horizon, would show that the chosen window and fitting no longer perform as claimed.
Figures


read the original abstract
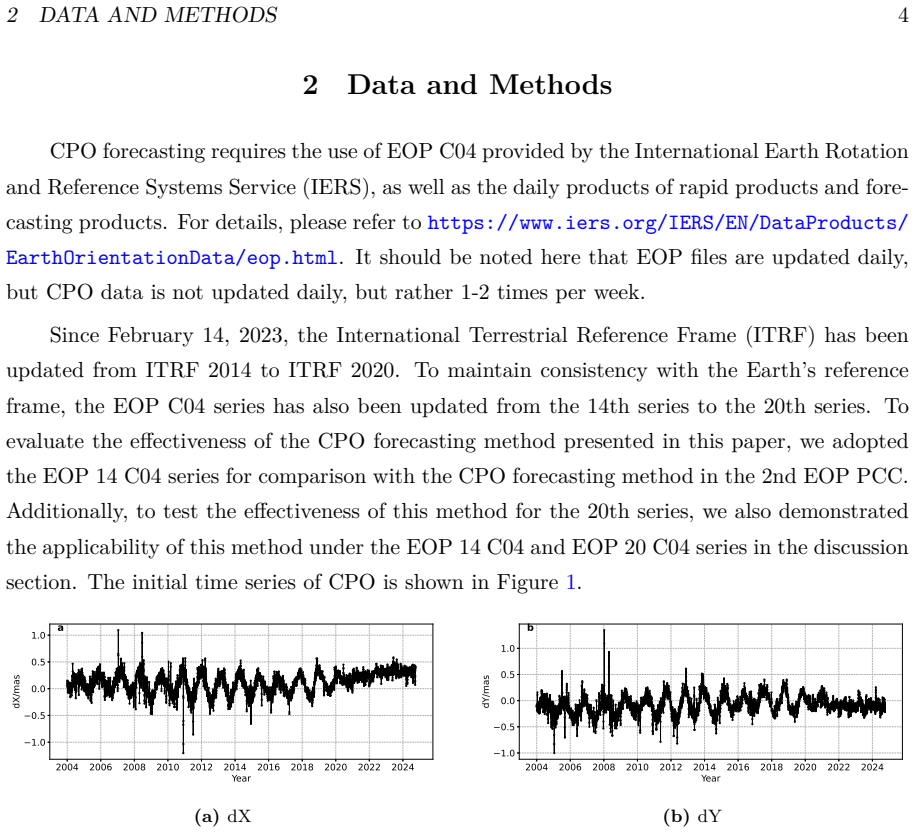
As an important component of Earth Orientation Parameters (EOP), the prediction of Celestial Pole Offsets (CPO) holds significant importance for missions such as deep space exploration. To explore a better CPO prediction algorithm that improves accuracy across different forecast spans, a CPO prediction algorithm is proposed based on a sliding window and bivariate least squares fitting. First, experiments determine an optimal sliding window of 900 days. Then, bivariate least squares fitting is performed on the selected 900-day historical data to complete extrapolation prediction. Then, bivariate least squares fitting is performed on the selected 900 day historical data to complete extrapolation prediction. Experimental results show that the proposed algorithm exhibits excellent accuracy. In comparisons with prediction results from participating teams in the Second Earth Orientation Parameters Prediction Comparison Campaign (2nd EOP PCC), the algorithm's Mean Absolute Error (MAE) is superior to both ID154 and ID155. Team ID154 achieved the best dX prediction, while Team ID155 achieved the best dY prediction. Furthermore, the algorithm performs well not only on the EOP 14 C04 series but also on the newly released EOP 20 C04 series after the 2nd EOP PCC. Its prediction results are far better than those in the daily files published by the International Earth Rotation and Reference Systems Service (IERS). In terms of dX forecast accuracy, the MAE for the 10th, 30th, and 57th days were reduced by 53%, 59%, and 60%, respectively. In terms of dY forecast accuracy, the MAE for the 10th, 30th, and 57th days were reduced by 35%, 38%, and 42%, respectively.
Editorial analysis
A structured set of objections, weighed in public.
Referee Report
Summary. The manuscript proposes a CPO prediction algorithm that selects a fixed 900-day sliding window on historical EOP data and applies bivariate least-squares fitting to extrapolate dX and dY forecasts. It reports that this yields lower MAE than teams ID154 and ID155 from the 2nd EOP PCC as well as IERS daily files, with claimed reductions of 53–60% for dX and 35–42% for dY at 10-, 30-, and 57-day horizons on both EOP 14 C04 and EOP 20 C04 series.
Significance. A simple, computationally lightweight method that demonstrably improves short-term CPO accuracy would be useful for deep-space navigation and reference-frame applications. The reported numerical gains are large, but their robustness is limited by the absence of held-out validation for the window length and lack of uncertainty quantification, so the practical significance remains provisional.
major comments (3)
- [Experiments] Experiments section: the 900-day window length is stated to have been chosen by experiment on historical data, yet no description is given of the selection criterion, the range of lengths tested, or any cross-validation on temporally disjoint intervals. Because the central performance claims rest on this single length, the lack of an independent validation protocol makes it impossible to rule out data-specific tuning.
- [Results] Results section (MAE comparisons): the reported percentage reductions (e.g., 53% for dX at day 10) are presented as point values with no error bars, bootstrap intervals, or statistical tests against the reference forecasts. Without these, it is unclear whether the observed superiority over ID154/ID155 and IERS files is statistically reliable or could arise from sampling variability in the chosen test periods.
- [Method] Method section: the bivariate least-squares model is not fully specified (polynomial degree, whether dX and dY are fitted jointly or separately, treatment of known periodic terms such as free-core nutation). No residual analysis or spectral check is shown to confirm that the chosen window captures the dominant signals rather than truncating longer-period content or fitting noise.
minor comments (2)
- [Abstract] Abstract contains a duplicated sentence describing the bivariate least-squares step.
- [Results] The manuscript should clarify whether the same 900-day window and fitting procedure were applied unchanged to the post-2nd-EOP-PCC EOP 20 C04 series or whether any re-tuning occurred.
Simulated Author's Rebuttal
We thank the referee for the constructive and detailed comments on our manuscript. We have carefully reviewed each point and provide point-by-point responses below, along with our plans for revision.
read point-by-point responses
-
Referee: Experiments section: the 900-day window length is stated to have been chosen by experiment on historical data, yet no description is given of the selection criterion, the range of lengths tested, or any cross-validation on temporally disjoint intervals. Because the central performance claims rest on this single length, the lack of an independent validation protocol makes it impossible to rule out data-specific tuning.
Authors: We agree that the manuscript requires additional detail on the window-length selection to address concerns about potential data-specific tuning. In the revised version, we will expand the Experiments section to describe the criterion (minimization of MAE on historical validation periods), the range of lengths evaluated, and confirmation that selection used data temporally prior to the main test intervals. We will also include a sensitivity analysis of MAE for window lengths near 900 days to demonstrate stability. revision: yes
-
Referee: Results section (MAE comparisons): the reported percentage reductions (e.g., 53% for dX at day 10) are presented as point values with no error bars, bootstrap intervals, or statistical tests against the reference forecasts. Without these, it is unclear whether the observed superiority over ID154/ID155 and IERS files is statistically reliable or could arise from sampling variability in the chosen test periods.
Authors: We concur that uncertainty quantification and statistical comparison would strengthen the results. In the revision, we will add bootstrap-derived confidence intervals for the MAE values and perform paired statistical tests (such as the Wilcoxon signed-rank test) between our forecasts and those from ID154, ID155, and IERS daily files. These additions will be reported in the Results section. revision: yes
-
Referee: Method section: the bivariate least-squares model is not fully specified (polynomial degree, whether dX and dY are fitted jointly or separately, treatment of known periodic terms such as free-core nutation). No residual analysis or spectral check is shown to confirm that the chosen window captures the dominant signals rather than truncating longer-period content or fitting noise.
Authors: We acknowledge the need for fuller specification of the fitting procedure. In the revised manuscript, we will explicitly state that a first-order (linear) polynomial is used, with dX and dY fitted separately; periodic terms such as free-core nutation are not modeled explicitly but are implicitly captured through the recent data in the sliding window. We will also add residual time-series plots and a brief spectral analysis of the fit residuals for representative windows to verify that dominant signals are retained. revision: yes
Circularity Check
No circularity: standard empirical extrapolation with external validation
full rationale
The paper describes a data-driven algorithm: experiments select a fixed 900-day sliding window on historical CPO series, followed by bivariate least-squares fitting to extrapolate future values. This is a conventional statistical forecasting procedure with no first-principles derivation, uniqueness theorem, or self-referential equations. Performance is assessed via direct comparison to independent external references (2nd EOP PCC team submissions ID154/ID155, IERS daily files, and the later EOP 20 C04 series), none of which are constructed from the paper's own fitted parameters. No step equates the reported predictions to the tuning inputs by definition or via load-bearing self-citation.
Axiom & Free-Parameter Ledger
free parameters (1)
- sliding window length =
900 days
axioms (1)
- domain assumption Bivariate least-squares fit to recent data provides reliable short-term extrapolation for CPO time series.
Reference graph
Works this paper leans on
-
[1]
and Baver, K
Behrend, D. and Baver, K. D. (eds.). International VLBI Service for Geodesy and Astrom- etry 2006 Annual Report . NASA Technical Publication NASA/TP-2007-214151, NASA Goddard Space Flight Center, Greenbelt, MD, 2007
2006
-
[2]
Ratcliff, J. T. and Gross, R. S. Combinations of Earth Orientation Measurements: SPACE2008, COMB2008, and POLE2008 . JPL Publication 10-4, Jet Propulsion Lab- oratory, California Institute of Technology, Pasadena, CA, 2010
2010
-
[3]
Deep ensemble geophysics-informed neural networks for the prediction of celestial pole offsets
Kiani Shahvandi, M., Belda, S., Karbon, M., Mishra, S., and Soja, B. Deep ensemble geophysics-informed neural networks for the prediction of celestial pole offsets. Geophysical Journal International , 236(1):480–493, 2024. doi:10.1093/gji/ggad436
-
[4]
A novel single-crystal & single-pass source for polarisation- and colour-entangled photon pairs,
Belda, S., Ferrándiz, J. M., Heinkelmann, R., and Schuh, H. A new method to improve the prediction of the celestial pole offsets. Scientific Reports, 8:13861, 2018. doi:10.1038/s41598- 018-32082-1
-
[5]
Mathews, P. M., Herring, T. A., and Buffett, B. A. Modeling of nutation and pre- cession: New nutation series for nonrigid Earth and insights into the Earth’s inte- rior. Journal of Geophysical Research: Solid Earth , 107(B4):ETG 3-1–ETG 3-26, 2002. doi:10.1029/2001JB000390
-
[6]
Lambert, S. B. and Dehant, V. The Earth’s core parameters as seen by the VLBI. Astron- omy & Astrophysics , 469(2):777–781, 2007. doi:10.1051/0004-6361:20077392. REFERENCES 16
-
[7]
ᇫ఼, ྸ࿒, andޡ.ொҵਙ .॓࿐ ฿໓़୍, 36:33–40, 2015
2015
-
[8]
M., Gross, R., Śliwińska, J., and Wińska, M
Nastula, J., Chin, T. M., Gross, R., Śliwińska, J., and Wińska, M. Smoothing and predict- ing celestial pole offsets using a Kalman filter and smoother. Journal of Geodesy , 94:29,
-
[9]
doi:10.1007/s00190-020-01349-9
-
[10]
සႥᆽ,ׯݓ,ӧ৵,ሰౢ, and ૼѰ.࣮.ҩ ॓࿐, 41(5):26–28, 2016
2016
-
[11]
M., Heinkelmann, R., Nilsson, T., and Schuh, H
Belda, S., Ferrándiz, J. M., Heinkelmann, R., Nilsson, T., and Schuh, H. Testing a new free core nutation empirical model. Journal of Geodynamics , 94–95:59–67, 2016. doi:10.1016/j.jog.2016.02.002
-
[12]
Free core nutation and geomagnetic jerks
Malkin, Z. Free core nutation and geomagnetic jerks. Journal of Geodynamics , 72:53–58,
-
[13]
doi:10.1016/j.jog.2013.06.001
-
[14]
Wińska, M., Kur, T., Śliwińska-Bronowicz, J., Nastula, J., Dobslaw, H., Partyka, A., Belda, S., Bizouard, C., Boggs, D., Chin, M., Dhar, S., Ferrándiz, J. M., Gou, J., Gross, R., Guessoum, S., Heinkelmann, R., Modiri, S., Ratcliff, T., Raut, S., Schartner, M., Schuh, H., Kiani Shahvandi, M., Soja, B., Thaller, D., Wu, Y., Xu, X., Yang, X., and Zhao, X. Fi...
-
[15]
doi:10.1186/s40623-024-02042-3
-
[16]
Liu, J.-C. and Huang, C.-L. The IAU 2006 precession quantities with an improved Earth’s J2 long-term variation. Astronomy & Astrophysics , 703:L21, 2025. doi:10.1051/0004- 6361/202557665
discussion (0)
Sign in with ORCID, Apple, or X to comment. Anyone can read and Pith papers without signing in.