Recognition: unknown
Oxygen and nitrogen isotopologues on cold COCONUTS-2b observed with MIRI/MRS
Pith reviewed 2026-05-07 11:07 UTC · model grok-4.3
The pith
JWST spectra detect rare isotopologues of ammonia and water in the atmosphere of cold companion COCONUTS-2b.
A machine-rendered reading of the paper's core claim, the machinery that carries it, and where it could break.
Core claim
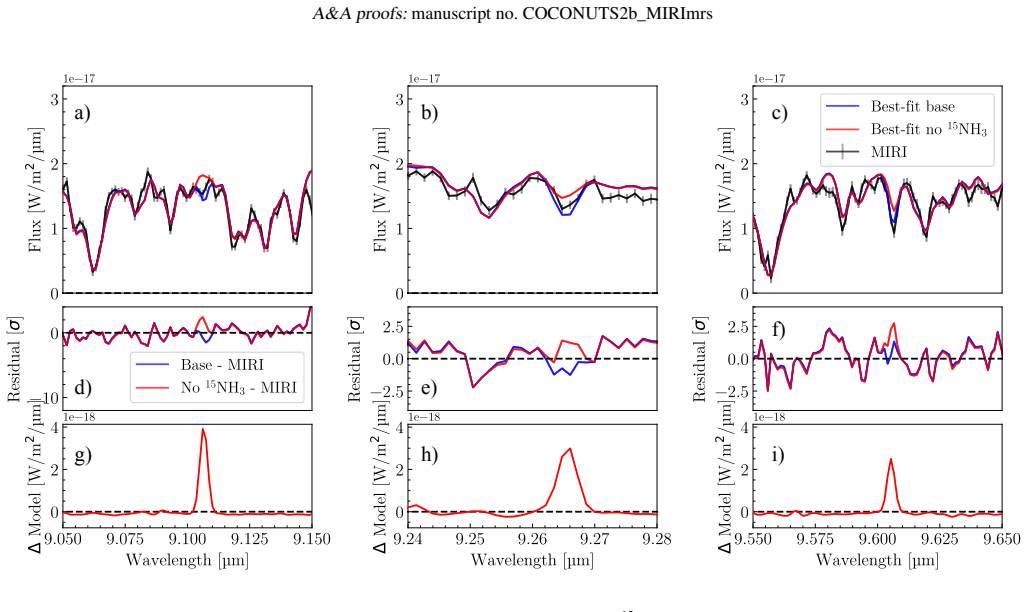
Atmospheric retrievals performed at the native spectral resolution of MIRI/MRS yield robust detections of ^{15}NH_3, H_2^{18}O, and H_2^{17}O. These constitute the first clear evidence for oxygen isotopes in water on a cold planetary-mass companion. Identification relies on leave-one-out tests and Bayes factor comparisons that quantify the improvement when each isotopologue is included in the model.
What carries the argument
Full-resolution atmospheric retrievals on combined MIRI/MRS and FLAMINGOS-2 spectra, with isotopologues isolated through leave-one-out analysis and Bayes factor comparison.
If this is right
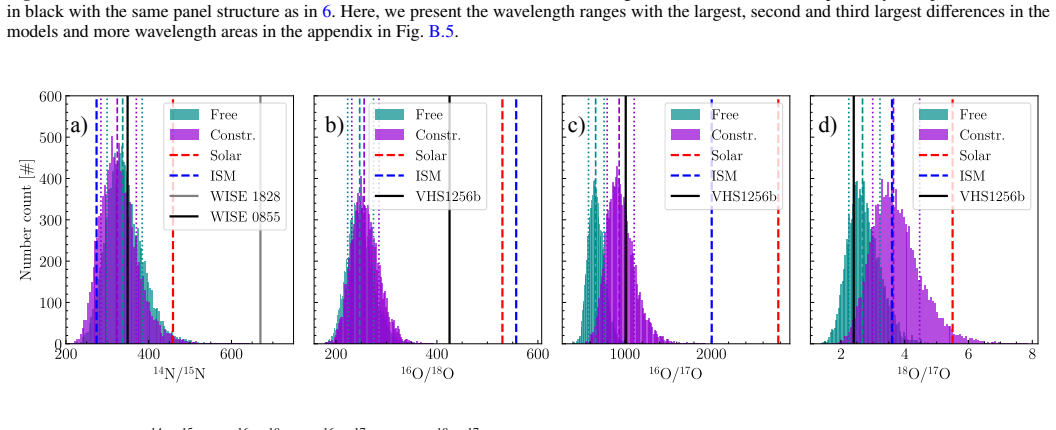
- Isotope ratios can be compared directly to the host star's abundances to constrain the planet's formation location and mechanism.
- The same MIRI/MRS approach becomes applicable to other cold companions, building a sample of isotopic measurements.
- Constrained elemental and isotopic ratios provide a new observable for testing core-accretion versus gravitational-instability scenarios.
- The detections establish that compositional details beyond bulk abundances are now accessible for objects near 480 K.
Where Pith is reading between the lines
- Extending the method to additional wide-orbit companions could test whether isotopic signatures correlate with separation from the host star.
- Oxygen isotope ratios that differ from the star might indicate accretion of ices formed at specific disk radii, a prediction testable with multi-epoch or multi-instrument data.
- Success with these faint features suggests that even rarer isotopologues could become measurable with deeper observations or refined models.
Load-bearing premise
The faint absorption features are produced specifically by the three claimed isotopologues and not by unaccounted opacities, model incompleteness, or data artifacts.
What would settle it
An independent data reduction or a retrieval using an expanded opacity database that achieves an equally good fit without including ^{15}NH_3, H_2^{18}O, or H_2^{17}O would falsify the detections.
Figures


read the original abstract
Linking the composition of gas giant planets to their formation paths has long been a goal in exoplanet science. Especially, cold gas giants with temperatures below $\sim$500K have been out of reach for detailed atmospheric characterization. With JWST, however, we can reach high signal-to-noise (S/N) spectra for such cool worlds and can can measure not only their main trace gas abundances, but even their isotopic content unlocking new possibilities in linking them to their formation paths. In this study, we present the spectrum of one of the coldest planetary-mass companions COCONUTS-2b ($\mathrm{T_{eff}}\approx$480K, separation of $\sim$6400 au from its M dwarf host star) obtained with the Mid-InfraRed Instrument Medium Resolution Spectrometer (MIRI/MRS). Combining the MIRI and archival Gemini/FLAMINGOS-2 data sets, we aim to characterize the chemical composition and physical structure of its frigid atmosphere, setting the stage to uncover insights on the formation of COCONUTS-2b. For the first time on a MIRI/MRS data set, we use the full spectral resolution of MIRI/MRS and perform atmospheric retrievals to unlock the search for faint absorption features by rare molecules and isotopologues. The latter are identified using a leave-one-out analysis and Bayes factor comparison. We robustly detect three isotopologues, namely $^{15}$NH$_3$, H$_2^{18}$O and H$_2^{17}$O in the atmosphere of COCONUTS-2b. We find the first clear evidence of oxygen isotopes in water in a cold companion. This data set demonstrates the capability of MIRI/MRS to characterize such cold planetary-mass companion's atmospheres with respect to their compositional and isotopic content. In the future, the constrained elemental and isotope ratios provide a unique avenue in comparing with the host star's abundances and eventually in tracing formation scenarios.
Editorial analysis
A structured set of objections, weighed in public.
Referee Report
Summary. The manuscript presents JWST MIRI/MRS observations of the cold (~480 K) planetary-mass companion COCONUTS-2b, combined with archival Gemini/FLAMINGOS-2 data. Using full-resolution atmospheric retrievals, the authors perform leave-one-out analyses and Bayes factor comparisons to detect the isotopologues ^{15}NH_3, H_2^{18}O, and H_2^{17}O, claiming the first clear evidence of oxygen isotopes in water in a cold companion. This is positioned as demonstrating MIRI/MRS capabilities for isotopic characterization of cold atmospheres.
Significance. Should the detections prove robust, the work would be significant for the field of exoplanet atmospheric science. It extends isotopic measurements to previously inaccessible cold regimes, potentially allowing comparisons of elemental and isotopic ratios with the host star to constrain formation scenarios. The use of full MIRI/MRS resolution for faint features is a technical advance worth noting.
major comments (3)
- [Atmospheric retrieval setup] Atmospheric retrieval setup: The leave-one-out Bayes factor analysis for identifying ^{15}NH_3, H_2^{18}O, and H_2^{17}O assumes completeness of the baseline opacity model. However, the manuscript does not report tests incorporating additional sources such as CH_4 hot bands or expanded NH_3 line lists, which could produce similar improvements in fit quality and thus weaken the uniqueness of the isotopologue attribution.
- [Results section] Results section: Quantitative diagnostics such as posterior predictive checks, residual maps across the MIRI/MRS wavelength range, or explicit fit statistics (e.g., reduced chi-squared values) for the models with and without the rare isotopologues are not provided. This makes it difficult to assess whether the reported Bayes factors reflect genuine detections or compensation for model incompleteness or data artifacts.
- [Data reduction and combination with archival data] Data reduction and combination with archival data: The full data-reduction pipeline for the MIRI/MRS observations, including details on telluric correction, instrumental systematics removal, and the merging with Gemini/FLAMINGOS-2 spectra, is not described in sufficient detail. Given that the detections rely on faint absorption features, any unaccounted residuals could mimic the claimed isotopologue signals.
minor comments (2)
- [Abstract] Abstract: The sentence 'we can can measure' contains a typographical error and should be corrected to 'we can measure'.
- [Figures] Spectral figures: Ensure plotted spectra clearly distinguish contributions from main isotopologues versus rare ones, with error bars or uncertainty shading included for all panels.
Simulated Author's Rebuttal
We thank the referee for their constructive and detailed review. We address each major comment below and have revised the manuscript to incorporate additional tests, diagnostics, and methodological details that strengthen the presentation of our results.
read point-by-point responses
-
Referee: Atmospheric retrieval setup: The leave-one-out Bayes factor analysis for identifying ^{15}NH_3, H_2^{18}O, and H_2^{17}O assumes completeness of the baseline opacity model. However, the manuscript does not report tests incorporating additional sources such as CH_4 hot bands or expanded NH_3 line lists, which could produce similar improvements in fit quality and thus weaken the uniqueness of the isotopologue attribution.
Authors: We agree that demonstrating the robustness of the isotopologue detections against potential missing opacities is important. In the revised manuscript we will add a dedicated subsection (and associated appendix) presenting retrieval tests that explicitly include CH4 hot bands and an expanded NH3 line list. These tests confirm that the Bayes factors for ^{15}NH3, H2^{18}O and H2^{17}O remain >10 even after the additional opacity sources are incorporated, supporting the uniqueness of the attributions. revision: yes
-
Referee: Results section: Quantitative diagnostics such as posterior predictive checks, residual maps across the MIRI/MRS wavelength range, or explicit fit statistics (e.g., reduced chi-squared values) for the models with and without the rare isotopologues are not provided. This makes it difficult to assess whether the reported Bayes factors reflect genuine detections or compensation for model incompleteness or data artifacts.
Authors: We acknowledge that additional quantitative fit diagnostics will improve transparency. The revised manuscript will include (i) posterior predictive checks, (ii) residual maps across the full MIRI/MRS range for both the full and leave-one-out models, and (iii) reduced chi-squared values for the models with and without each isotopologue. These will be presented in a new figure and table in the results section. revision: yes
-
Referee: Data reduction and combination with archival data: The full data-reduction pipeline for the MIRI/MRS observations, including details on telluric correction, instrumental systematics removal, and the merging with Gemini/FLAMINGOS-2 spectra, is not described in sufficient detail. Given that the detections rely on faint absorption features, any unaccounted residuals could mimic the claimed isotopologue signals.
Authors: We agree that a more complete description of the data reduction is warranted. The revised methods section will expand the MIRI/MRS reduction pipeline description, explicitly detailing the telluric correction procedure, instrumental systematics removal steps, and the merging process with the archival Gemini/FLAMINGOS-2 spectra. We will also add a supplementary table summarizing the key reduction parameters and any residual checks performed. revision: yes
Circularity Check
No significant circularity; detections rest on standard Bayes-factor model comparison
full rationale
The paper's central claim (robust detection of ^{15}NH_3, H_2^{18}O, H_2^{17}O) is obtained by leave-one-out retrievals and Bayes-factor comparisons between forward models that include or exclude the rare isotopologues. This procedure compares data directly to synthetic spectra generated from independent line lists and atmospheric parameters; the improvement is not defined in terms of the fitted abundances themselves, nor does any load-bearing step reduce to a self-citation chain or an ansatz smuggled from prior work by the same authors. The derivation chain is therefore self-contained against external benchmarks (observed spectrum vs. independent opacity databases) and receives the default non-circularity finding.
Axiom & Free-Parameter Ledger
free parameters (2)
- isotopologue abundances
- temperature-pressure profile parameters
axioms (1)
- domain assumption Spectral features are produced solely by the listed isotopologues under the assumed atmospheric conditions
Reference graph
Works this paper leans on
-
[1]
F., Spiegelman, F., & Kielkopf, J
Allard, N. F., Spiegelman, F., & Kielkopf, J. F. 2016, A&A, 589, A21 Ando, T. 2007, Biometrika, 94, 443 Ando, T. 2011, American Journal of Mathematical and Management Sciences, 31, 13 Argyriou, I., Glasse, A., Law, D. R., et al. 2023, A&A, 675 Azzam, A. A. A., Tennyson, J., Yurchenko, S. N., & Naumenko, O. V . 2016, MNRAS, 460, 4063 Bailer-Jones, C. A. L....
-
[2]
Article number, page 23 of 26 A&A proofs:manuscript no
Here we show the part of the spectrum with the fourth to eight largest differences between the best-fits. Article number, page 23 of 26 A&A proofs:manuscript no. COCONUTS2b_MIRImrs 3.5 3.4 3.3 3.2 CH4 0 200 400 600 800 1000 1200Number count [#] 7 6 13CH4 0 200 400 600 800 1000 11 10 9 8 CH3D 0 50 100 150 200 250 300 350 3.1 3.0 2.9 2.8 2.7 H2O 0 200 400 6...
2000
discussion (0)
Sign in with ORCID, Apple, or X to comment. Anyone can read and Pith papers without signing in.