Recognition: unknown
The Large Array Survey Telescope-Pipeline. II. Image Subtraction and Transient Detection
Pith reviewed 2026-05-07 04:52 UTC · model grok-4.3
The pith
The LAST pipeline subtracts reference images from coadds using ZOGY to produce transient candidates at 80% efficiency and over 90% purity without machine learning.
A machine-rendered reading of the paper's core claim, the machinery that carries it, and where it could break.
Core claim
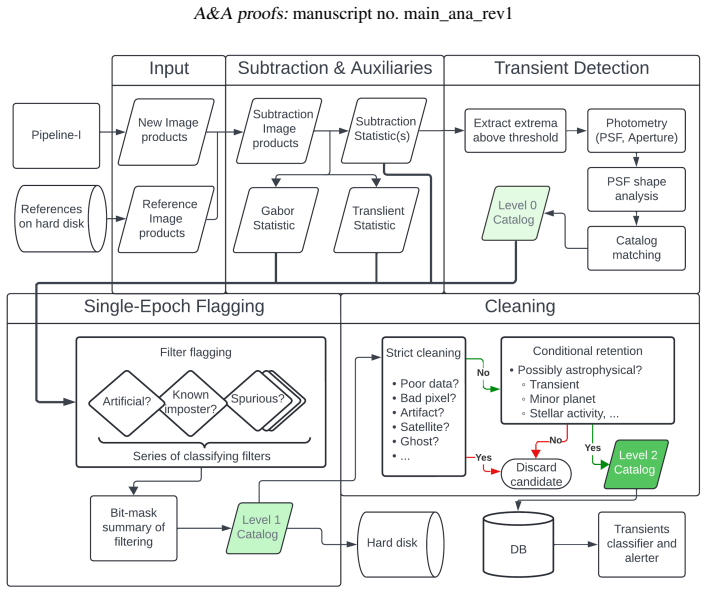
The second component of the LAST pipeline performs proper image subtraction of 20 by 20 second coadded frames against reference images with the ZOGY algorithm, augments the subtraction with the Translient statistic to reject sub-pixel motion artifacts, and applies a chain of deterministic filters to deliver a clean stream of transient candidates. On commissioning data this yields a preliminary 5-sigma limiting magnitude of 20.3-20.7, a single-epoch detection efficiency near 80%, and a purity of at least 90% for objects above 7.5 sigma.
What carries the argument
The ZOGY proper image subtraction algorithm combined with the Translient statistic for sub-pixel motion discrimination and a sequence of deterministic filtering steps that together generate clean transient candidate streams.
If this is right
- Near-real-time production of calibrated images, catalogs, and transient alerts that are automatically reported to the Transient Name Server.
- Single-epoch transient detection at approximately 80% efficiency down to a 5-sigma limiting magnitude of 20.3-20.7.
- Candidate purity of at least 90% for sources at signal-to-noise ratio of 7.5 sigma and above.
- Support for high-cadence exploration of the variable and transient sky through automated, deterministic processing at the observatory site.
Where Pith is reading between the lines
- The transparent, rule-based design lets users trace exactly why any candidate passes or fails, which may help diagnose new classes of false positives when the survey encounters unexpected sky conditions.
- If the measured performance persists, the same subtraction-plus-filter chain could be adapted by other wide-field facilities that process data on-site and need to issue alerts without maintaining training sets.
- Long-term monitoring of the same fields will accumulate reference images that improve subtraction quality and therefore raise both depth and purity beyond the commissioning figures.
Load-bearing premise
The commissioning data used for validation represent the full range of observing conditions, sky backgrounds, and transient types the survey will meet in routine operations, and the fixed filtering rules do not systematically remove real transients under those conditions.
What would settle it
Recovery statistics for a set of artificial transients of known brightness and location injected into a diverse collection of LAST images spanning different seeing, background levels, and crowding, compared against the reported 80% efficiency and 90% purity thresholds.
Figures


read the original abstract
Context. The Large Array Survey Telescope (LAST) is a wide-field visual-band survey designed to explore the variable and transient sky with high cadence. Its raw data stream is automatically processed in near real time at the observatory site, producing science-quality images, catalogs, and transient alerts. Transient alerts are then reported to the Transient Name Server (TNS). Aims. The LAST pipeline comprises two major components: (i) processing and calibration of single images followed by coaddition of $20\times20$s exposures, producing single-image and coadded-image catalogs; and (ii) subtraction of coadded images from calibrated reference images followed by transient detection. In this work we present a detailed description and validation of the second component of the pipeline. Methods. Transient detection is based on the algorithm for proper image subtraction (ZOGY). We combine ZOGY subtraction with the Translient statistic for sub-pixel motion discrimination, together with a sequence of deterministic filtering steps, to produce a clean stream of transient candidates without the use of machine learning. Results. Using commissioning data, the pipeline achieves a preliminary $5\sigma$ limiting magnitude of $20.3$-$20.7$mag, a single-epoch transient detection efficiency of $\sim80$%, and a purity of $\gtrsim90$% at signal-to-noise ratio of $\geq7.5\sigma$.
Editorial analysis
A structured set of objections, weighed in public.
Referee Report
Summary. The manuscript describes the second component of the LAST pipeline for image subtraction and transient detection. It details the use of the ZOGY algorithm for proper image subtraction of coadded images from reference images, combined with the Translient statistic for sub-pixel motion discrimination and a sequence of deterministic filters to produce a clean stream of transient candidates without machine learning. Validation on commissioning data reports a preliminary 5σ limiting magnitude of 20.3-20.7 mag, single-epoch transient detection efficiency of ∼80%, and purity of ≳90% at signal-to-noise ratio ≥7.5σ. Transient alerts are generated for reporting to the Transient Name Server.
Significance. If the performance metrics prove robust, the work provides a transparent, fully algorithmic pipeline for real-time transient detection in high-cadence wide-field surveys. The detailed description of the ZOGY implementation, Translient integration, and deterministic filtering steps (without reliance on ML) is a strength for reproducibility and interpretability. The empirical benchmarks from commissioning data offer a practical starting point for similar surveys, though their generalizability to the full range of survey conditions remains to be demonstrated.
major comments (3)
- [§5] §5 (Validation/Results): The single-epoch efficiency of ∼80% and purity of ≳90% at SNR ≥7.5σ are reported from commissioning data, but no details are given on dataset size (number of epochs, fields, or transients), inclusion/exclusion criteria, or statistical uncertainties on the figures. This leaves the quantitative support for the central performance claims only moderately anchored.
- [§5] §5: No injection-recovery tests or efficiency/purity curves are presented as a function of observing conditions (seeing, sky brightness, airmass) or transient properties (magnitude, light-curve timescale, host environment). The deterministic filters following ZOGY and Translient may introduce uncharacterized selection biases that only appear outside the commissioning parameter volume.
- [Abstract and §5] Abstract and §5: The 5σ limiting magnitude range of 20.3-20.7 mag is stated without specifying the exact measurement method (e.g., source detection threshold, recovery fraction, or PSF photometry) or associated uncertainties, hindering direct comparison to other surveys.
minor comments (2)
- [§3] Clarify in §3 (Methods) the exact tunable parameters in the Translient statistic and the deterministic filters, including their adopted values and any sensitivity tests performed.
- [Throughout] Ensure consistent notation for signal-to-noise (SNR vs. S/N) and define all acronyms at first use throughout the text.
Simulated Author's Rebuttal
We thank the referee for their careful reading of the manuscript and for the constructive comments, which will help improve the clarity and robustness of our validation section. We address each major comment below and indicate the revisions we will make to the next version of the manuscript.
read point-by-point responses
-
Referee: [§5] §5 (Validation/Results): The single-epoch efficiency of ∼80% and purity of ≳90% at SNR ≥7.5σ are reported from commissioning data, but no details are given on dataset size (number of epochs, fields, or transients), inclusion/exclusion criteria, or statistical uncertainties on the figures. This leaves the quantitative support for the central performance claims only moderately anchored.
Authors: We agree that the manuscript would benefit from additional details on the commissioning dataset to better anchor the reported efficiency and purity values. In the revised version we will expand §5 to specify the total number of epochs and fields analyzed, the number of transients used in the statistics, the inclusion/exclusion criteria applied to the sample, and statistical uncertainties on the ∼80% efficiency and ≳90% purity figures (computed via binomial confidence intervals). revision: yes
-
Referee: [§5] §5: No injection-recovery tests or efficiency/purity curves are presented as a function of observing conditions (seeing, sky brightness, airmass) or transient properties (magnitude, light-curve timescale, host environment). The deterministic filters following ZOGY and Translient may introduce uncharacterized selection biases that only appear outside the commissioning parameter volume.
Authors: We acknowledge that injection-recovery tests across a broader range of conditions would provide a more complete characterization of selection biases. The present work is a pipeline description paper whose validation relies on real commissioning data to demonstrate performance under actual survey conditions. In the revision we will add a short discussion in §5 of the possible biases introduced by the deterministic filters and will explicitly note that comprehensive injection-recovery analyses as functions of observing conditions and transient properties are planned for a follow-up study once additional data have been collected. We maintain that the existing real-data results are appropriate for the scope of this manuscript. revision: partial
-
Referee: [Abstract and §5] Abstract and §5: The 5σ limiting magnitude range of 20.3-20.7 mag is stated without specifying the exact measurement method (e.g., source detection threshold, recovery fraction, or PSF photometry) or associated uncertainties, hindering direct comparison to other surveys.
Authors: We agree that the method used to derive the 5σ limiting magnitude should be stated explicitly. In the revised manuscript we will clarify both in the abstract and in §5 that the quoted range corresponds to the 5σ source-detection threshold measured in the ZOGY-subtracted images on the commissioning data, with the associated uncertainties obtained from the observed scatter across the dataset. revision: yes
Circularity Check
No circularity: empirical performance metrics from commissioning data are direct measurements, not derived quantities.
full rationale
The paper describes the LAST pipeline's image subtraction and transient detection steps using the established ZOGY algorithm combined with the Translient statistic and deterministic filters. All reported results (5σ limiting magnitude of 20.3-20.7 mag, ~80% single-epoch efficiency, ≳90% purity at ≥7.5σ) are presented as direct empirical measurements on commissioning data rather than outputs of any equations or fitted parameters within the paper. No self-definitional loops, fitted inputs renamed as predictions, or load-bearing self-citations appear in the central claims; the validation rests on external data rather than reducing to the pipeline's own definitions or prior author work by construction. The derivation chain is therefore self-contained.
Axiom & Free-Parameter Ledger
free parameters (1)
- SNR reporting threshold
axioms (1)
- domain assumption ZOGY algorithm correctly models PSF and noise differences between science and reference images
Reference graph
Works this paper leans on
-
[1]
Create a 32-bit-mask image for the science image, and flag saturated pixels in the mask image (see Table 1 in Ofek et al. 2023b)
-
[2]
The dark image has its own bit-mask image, which is prop- agated using theoroperator to the bit-mask image of the science image
Subtract a master dark image from the raw science image. The dark image has its own bit-mask image, which is prop- agated using theoroperator to the bit-mask image of the science image
-
[3]
Subtract the overscan dark value from the image
-
[4]
Divide the science image by the most recent flat field image and propagate the bit mask of the flat field image into the science image bit mask
-
[5]
Trim the overscan area in the camera
-
[6]
Multiply the pixel values by a constant gain
-
[7]
The sub-images have a size of 1726×1726 pixels, including an at least 64-pixel- wide overlap between sub-images
Partition the image into 24 sub-images. The sub-images have a size of 1726×1726 pixels, including an at least 64-pixel- wide overlap between sub-images. The overlap is important to avoid losing sources and to overcome pointing inaccura- cies. From this step forward, all the processing is done inde- pendently on individual sub-images
-
[8]
Measure the background and variance images for each sub- image
-
[9]
Subtract the background from each sub-image
-
[10]
Match filter the image using two Gaussian filters with sigma- widths of 0.1 and 1.5 pixels
-
[11]
Find all sources with a signal-to-noise ratioS/N≥5 in each match-filtered image
-
[12]
Re- move all sources for which the delta function filter scores a higherS/N
Compare theS/Ncorresponding to the delta function (the 0.1 pixel filter) with that of wider filters for each source. Re- move all sources for which the delta function filter scores a higherS/N. The positions of removed sources are marked as cosmic ray hits in the bit mask
-
[13]
Additionally, derive the first and second moments of the source PSF for each source
Perform aperture photometry and retrieve the source flux as well as the background and its standard deviation in an an- nulus around each source. Additionally, derive the first and second moments of the source PSF for each source
-
[14]
This includes the overlap and near-edge bits
Propagate the bit-mask information into the source catalog. This includes the overlap and near-edge bits. Specifically, the overlap bit allows us to remove duplicate sources found in the overlap region
-
[15]
These sources are shifted using cubic interpolation to the center of the PSF stamp and coded to produce the sub-image PSF
Select sources withS/N∈[50,1000], second moments in the [10,80] percentile, and no neighbors within six pixels. These sources are shifted using cubic interpolation to the center of the PSF stamp and coded to produce the sub-image PSF
-
[16]
Perform PSF fit photometry for all sources
-
[17]
Solve the astrometry for each of the sub-image fields and up- date the corresponding source catalogs with the astrometric information
-
[18]
2016; Gaia Collaboration 2022)
Perform photometric calibration of the sources against GAIA-DR3 sources (Gaia Collaboration et al. 2016; Gaia Collaboration 2022). The calibration includes a zero point and a color term and achieves a typical accuracy of about 0.015 mag. The calibrated magnitudes are evaluated assuming a color ofB p −R p =1 mag. Additionally, deter- mine the image zero po...
2016
-
[19]
Match the sources in the 20 successive sub-images of a visit and produce a matched source catalog that contains all de- tected sources
-
[20]
Fit each matched source with a proper motion model and check for changes in flux
-
[21]
Search for asteroids in the 20 successive images
-
[22]
Match the matched sources with known solar system objects
-
[23]
Match the matched sources with external catalogs by using catsHTM (Soumagnac & Ofek 2018)
2018
-
[24]
Transform the 20 successive sub-images into the same frame and coadd them
-
[25]
Produce a calibrated source catalog for each of the 24 coad- ded sub-images using the same method as individual epoch sub-images (steps 8–16)
-
[26]
Refine the astrometry of the coadded source catalog using the PSF-fit positions
-
[27]
The data products include im- ages, catalogs, mask images, and PSF stamps (see Table 7 in Ofek et al
Save data products to disk. The data products include im- ages, catalogs, mask images, and PSF stamps (see Table 7 in Ofek et al. 2023b)
-
[28]
In the near future, steps 10 to 16 will be replaced with a multi-iteration matched filtering and PSF subtraction including the PSF, a delta function, and an extended PSF
Save all produced source catalogs and headers of the coad- ded images to a database. In the near future, steps 10 to 16 will be replaced with a multi-iteration matched filtering and PSF subtraction including the PSF, a delta function, and an extended PSF. Initial imple- mentations produce more than twice the number of detected sources in dense regions, su...
2025
discussion (0)
Sign in with ORCID, Apple, or X to comment. Anyone can read and Pith papers without signing in.