Recognition: unknown
Mapping the Phase Diagram of the Vicsek Model with Machine Learning
Pith reviewed 2026-05-07 05:42 UTC · model grok-4.3
The pith
Machine learning maps the Vicsek flocking model's phase diagram across noise, density, and speed parameters.
A machine-rendered reading of the paper's core claim, the machinery that carries it, and where it could break.
Core claim
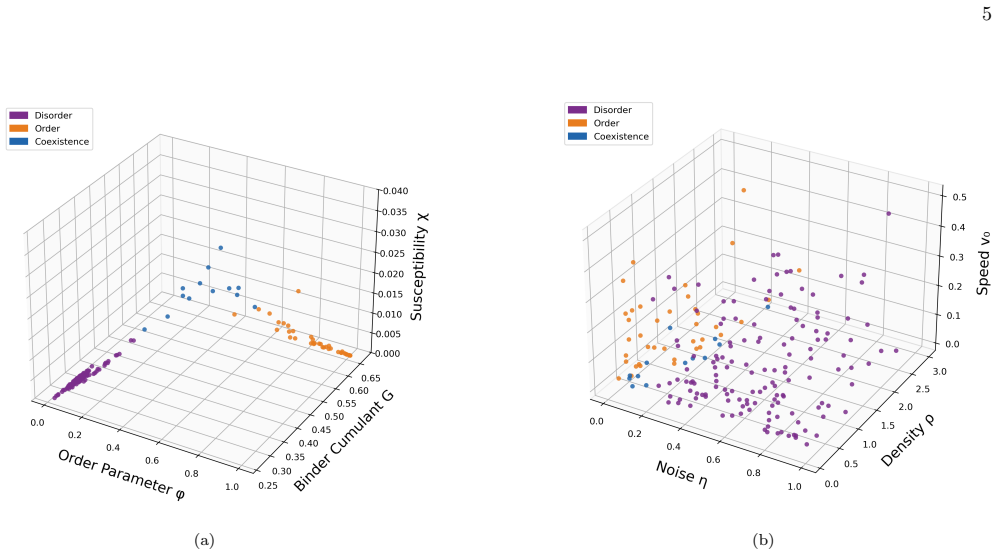
By characterizing simulated Vicsek points using long-time dynamical observables and feeding them to K-Means clustering that assigns each point to a disorder, order, or coexistence phase, then training a neural-network classifier on those labels, the authors obtain a phase map that reaches 0.92 classification accuracy, resolves a narrow coexistence region separating the ordered and disordered phases, and infers phase boundaries outside the originally sampled simulation points.
What carries the argument
K-Means clustering applied to long-time dynamical observables extracted from simulations, followed by a neural-network classifier trained on the resulting cluster labels to map parameters to phases.
If this is right
- Phase behavior can be predicted at parameter combinations that were never simulated directly.
- A narrow coexistence region is resolved between the ordered flocking and disordered states.
- Phase boundaries are extended beyond the discrete set of simulation points.
- Sparse simulation data for collective-motion models can be converted into a global phase diagram in a systematic way.
Where Pith is reading between the lines
- The same clustering-plus-classifier pipeline could be applied to other active-matter or self-propelled-particle models to locate unexpected coexistence regions.
- Testing alternative choices of dynamical observables as input features might improve clustering fidelity or reveal which statistics best capture the phase transition.
- If the observables can be measured in experiment, the method could be used to map phases directly from trajectories of real flocks without requiring labeled training data.
Load-bearing premise
The particular long-time dynamical observables extracted from the simulations suffice for unsupervised K-Means clustering to correctly identify the physical ordered, disordered, and coexistence phases without additional validation or prior labels.
What would settle it
Performing new Vicsek simulations at parameter values near the predicted boundaries and checking whether the observed order parameters or trajectory statistics match the neural-network phase assignments would directly test the inferred diagram.
Figures


read the original abstract
In this study, we use machine learning to classify and interpolate the phase structure of the Vicsek flocking model across the three-dimensional parameter space $(\eta,\rho,v_0)$. We construct a dataset of simulated parameter points and characterize each point using long-time dynamical observables. These observables are then used as inputs to a K-Means clustering procedure, which assigns each point to a disorder, order, or coexistence phase. Using these clustered labels, we train a neural-network classifier to learn the mapping from model parameters to phase behavior, achieving a classification accuracy of 0.92. The resulting phase map resolves a narrow coexistence region separating the ordered and disordered phases and extends the inferred phase boundaries beyond the originally sampled simulation points. More broadly, this approach provides a systematic way to convert sparse simulation data into a global phase diagram for collective-motion models.
Editorial analysis
A structured set of objections, weighed in public.
Referee Report
Summary. The manuscript applies machine learning to construct the phase diagram of the Vicsek model in the three-dimensional parameter space (η, ρ, v0). Long-time dynamical observables extracted from simulations at discrete parameter points are clustered via K-Means into disordered, ordered, and coexistence phases. These labels are then used to train a neural-network classifier that maps parameters to phases, reported to achieve 0.92 accuracy. The trained classifier is used to interpolate a narrow coexistence region between ordered and disordered phases and to extrapolate phase boundaries beyond the simulated points.
Significance. If the unsupervised clusters are shown to correspond to the physically distinct regimes of the Vicsek model, the work offers a practical route to convert sparse simulation data into a dense, global phase diagram for active-matter systems. The approach could be especially useful in high-dimensional parameter spaces where conventional order parameters become difficult to interpret or where narrow coexistence regions are hard to resolve by direct simulation. The reported extrapolation capability and the 0.92 classification accuracy, if robustly validated, would constitute a concrete demonstration of ML-assisted phase-diagram mapping.
major comments (4)
- [Abstract and §3] Abstract and §3 (clustering procedure): The manuscript states that K-Means is performed on 'long-time dynamical observables' but does not list the specific observables, the distance metric, the number of clusters (fixed at three?), or any stability analysis of the clustering. Without these details it is impossible to judge whether the resulting labels align with the conventional Vicsek polarization order parameter or with established first-order transition phenomenology.
- [§4] §4 (neural-network training): The 0.92 classification accuracy is reported without mention of cross-validation strategy, train/test split, hyperparameter search, or error bars on the accuracy itself. Because the labels originate from K-Means on the same feature set, the accuracy figure risks reflecting the internal consistency of the chosen observables rather than independent physical validation.
- [§5] §5 (phase diagram and extrapolation): The claim that a 'narrow coexistence region' is resolved and that boundaries are extended beyond sampled points rests entirely on the neural-network generalization. No comparison is provided between the inferred diagram and previously published Vicsek phase boundaries (e.g., the known dependence on η and ρ at fixed v0), nor are any out-of-sample simulation runs used to test the extrapolated regions.
- [§3.2] §3.2 (label generation): The pipeline defines the three phases by K-Means partitioning of the dynamical observables and then trains the classifier on those same labels. This creates a circularity: the physical interpretation of the clusters is assumed rather than demonstrated. A direct comparison of cluster membership against the time-averaged polarization P = |⟨vi⟩| or against known coexistence signatures (e.g., bimodal velocity distributions) is required to establish that the clusters are not merely statistical artifacts of the chosen feature space.
minor comments (3)
- [Abstract and Introduction] The abstract and introduction should cite the original Vicsek et al. (1995) paper and at least one recent review on the Vicsek phase diagram to place the new results in context.
- [Figure captions] Figure captions for the phase maps should explicitly state the range of parameters over which the neural network was trained versus the range over which it is extrapolated.
- [Throughout] Notation for the three phases (disordered, ordered, coexistence) should be introduced once and used consistently; the current text occasionally interchanges 'disorder' and 'disordered'.
Simulated Author's Rebuttal
We thank the referee for the thorough and constructive review. The comments highlight important aspects of methodology, validation, and interpretation that will strengthen the manuscript. We address each major comment below and will revise the paper accordingly.
read point-by-point responses
-
Referee: [Abstract and §3] Abstract and §3 (clustering procedure): The manuscript states that K-Means is performed on 'long-time dynamical observables' but does not list the specific observables, the distance metric, the number of clusters (fixed at three?), or any stability analysis of the clustering. Without these details it is impossible to judge whether the resulting labels align with the conventional Vicsek polarization order parameter or with established first-order transition phenomenology.
Authors: We agree that these details are required for full reproducibility and to confirm physical alignment. In the revised manuscript we will explicitly list the long-time dynamical observables (average velocity magnitude, its temporal variance, and velocity autocorrelation time), specify the Euclidean distance metric, confirm K=3 clusters chosen to correspond to the expected disordered, ordered, and coexistence regimes, and report a stability analysis based on silhouette scores together with results from multiple random initializations. We will also add a direct comparison of cluster membership with the conventional polarization P = |⟨v_i⟩|, demonstrating that the ordered cluster corresponds to high P, the disordered cluster to low P, and the coexistence cluster to intermediate P accompanied by bimodal velocity distributions. revision: yes
-
Referee: [§4] §4 (neural-network training): The 0.92 classification accuracy is reported without mention of cross-validation strategy, train/test split, hyperparameter search, or error bars on the accuracy itself. Because the labels originate from K-Means on the same feature set, the accuracy figure risks reflecting the internal consistency of the chosen observables rather than independent physical validation.
Authors: We accept that the training protocol must be documented in detail. The revised §4 will specify an 80/20 train/test split, 5-fold cross-validation, grid-search hyperparameter optimization (layers, neurons, learning rate, regularization), and the accuracy reported as 0.92 ± 0.03 (mean and standard deviation across folds). We note that the neural network receives only the bare model parameters (η, ρ, v0) as input and predicts the phase label previously obtained from clustering the observables; the accuracy therefore quantifies the parameter-to-phase mapping rather than a direct reproduction of the observables. To further address the concern we will include an independent test set consisting of new simulations performed after the classifier was trained. revision: yes
-
Referee: [§5] §5 (phase diagram and extrapolation): The claim that a 'narrow coexistence region' is resolved and that boundaries are extended beyond sampled points rests entirely on the neural-network generalization. No comparison is provided between the inferred diagram and previously published Vicsek phase boundaries (e.g., the known dependence on η and ρ at fixed v0), nor are any out-of-sample simulation runs used to test the extrapolated regions.
Authors: We agree that external benchmarking and out-of-sample validation are necessary. In the revised §5 we will overlay the inferred phase boundaries with established literature results for the Vicsek model (critical noise η_c as a function of density ρ at fixed v0). We will additionally perform and report new simulations at parameter points lying outside the original training grid, including in the extrapolated regions, and show quantitative agreement between the observed phases in these runs and the neural-network predictions. This will substantiate both the narrow coexistence region and the extrapolation. revision: yes
-
Referee: [§3.2] §3.2 (label generation): The pipeline defines the three phases by K-Means partitioning of the dynamical observables and then trains the classifier on those same labels. This creates a circularity: the physical interpretation of the clusters is assumed rather than demonstrated. A direct comparison of cluster membership against the time-averaged polarization P = |⟨vi⟩| or against known coexistence signatures (e.g., bimodal velocity distributions) is required to establish that the clusters are not merely statistical artifacts of the chosen feature space.
Authors: We concur that the physical meaning of the clusters must be demonstrated explicitly. The revised §3.2 will contain a direct comparison: we will show the distribution of the polarization P for each cluster, confirming distinct regimes (high P for ordered, low P for disordered, broad intermediate distribution for coexistence). We will further demonstrate that the coexistence cluster exhibits bimodal velocity distributions, consistent with the first-order character of the transition. These analyses will establish that the K-Means partitioning recovers genuine physical phases rather than statistical artifacts of the feature space. revision: yes
Circularity Check
No significant circularity in the ML-based phase diagram construction
full rationale
The described pipeline simulates the Vicsek model at sampled parameter points (η, ρ, v0), extracts long-time dynamical observables from those runs, applies unsupervised K-Means clustering to those observables to produce phase labels (ordered, disordered, coexistence), and trains a neural-network classifier whose inputs are the model parameters and whose targets are the resulting cluster labels. This does not reduce to a self-definitional or fitted-input loop: the clustering step operates solely on the observable feature vectors and is independent of the subsequent parameter-to-label mapping; the NN then learns a function from parameters to the discovered labels and is used for interpolation/extrapolation. No equations, self-citations, or ansatzes are shown that would make the reported 0.92 accuracy or the narrow coexistence region equivalent to the input data by construction. The method is therefore self-contained as a data-driven surrogate for the phase diagram, with any validity concerns residing in the physical interpretation of the clusters rather than in circular reasoning.
Axiom & Free-Parameter Ledger
free parameters (2)
- Number of K-Means clusters
- Neural-network architecture and hyperparameters
axioms (2)
- domain assumption Long-time dynamical observables extracted from Vicsek simulations are sufficient to distinguish ordered, disordered, and coexistence states
- domain assumption K-Means clustering on the chosen observables recovers the physically correct phase boundaries of the Vicsek model
Reference graph
Works this paper leans on
-
[1]
Ginelli, The physics of the Vicsek model, Eur
F. Ginelli, The physics of the Vicsek model, Eur. Phys. J.: Spec. Top.225, 2099 (2016)
2099
-
[2]
Gr´ egoire and H
G. Gr´ egoire and H. Chat´ e, Onset of collective and cohe- sive motion, Phys. Rev. Lett.92, 025702 (2004)
2004
-
[3]
Emlen, John T., Flocking behavior in birds, Auk69, 160 (1952)
J. Emlen, John T., Flocking behavior in birds, Auk69, 160 (1952)
1952
-
[4]
Wu and A
X.-L. Wu and A. Libchaber, Particle diffusion in a quasi- two-dimensional bacterial bath, Phys. Rev. Lett.84, 3017 (2000)
2000
-
[5]
W. H. Warren, Collective motion in human crowds, Curr. Dir. Psychol. Sci.27, 232 (2018)
2018
-
[6]
Toner and Y
J. Toner and Y. Tu, Long-range order in a two- dimensional dynamical XY model: How birds fly to- gether, Phys. Rev. Lett.75, 4326 (1995)
1995
-
[7]
C. M. Macal and M. J. North, Tutorial on agent-based modelling and simulation, J. Simul.4, 151 (2010)
2010
-
[8]
C. Gao, X. Lan, N. Li, Y. Yuan, J. Ding, Z. Zhou, F. Xu, and Y. Li, Large language models empowered 8 agent-based modeling and simulation: a survey and per- spectives, Humanit. Soc. Sci. Commun.11, 151 (2024)
2024
-
[9]
Vicsek, A
T. Vicsek, A. Czir´ ok, E. Ben-Jacob, I. Cohen, and O. Shochet, Novel type of phase transition in a system of self-driven particles, Phys. Rev. Lett.75, 1226 (1995)
1995
-
[10]
Baglietto, E
G. Baglietto, E. V. Albano, and J. Candia, Criticality and the onset of ordering in the standard Vicsek model, Interface Focus2, 708 (2012)
2012
-
[11]
Serna and W
H. Serna and W. T. G´ o´ zd´ z, The influence of obstacles on the collective motion of self-propelled objects, Physica A 625, 129042 (2023)
2023
-
[12]
A. P. Solon, H. Chat´ e, and J. Tailleur, From phase to microphase separation in flocking models: The essential role of nonequilibrium fluctuations, Phys. Rev. Lett.114, 068101 (2015)
2015
-
[13]
K¨ ursten and T
R. K¨ ursten and T. Ihle, Dry active matter exhibits a self- organized cross sea phase, Phys. Rev. Lett.125, 188003 (2020)
2020
-
[14]
Miyahara, H
H. Miyahara, H. Yoneki, T. Mizohata, and V. Roychowd- hury, Vicsek model meets DBSCAN: Cluster phases in the Vicsek model, J. Phys. Soc. Jpn.94, 084002 (2025)
2025
-
[15]
Carleo, I
G. Carleo, I. Cirac, K. Cranmer, L. Daudet, M. Schuld, N. Tishby, L. Vogt-Maranto, and L. Zdeborov´ a, Machine learning and the physical sciences, Rev. Mod. Phys.91, 045002 (2019)
2019
-
[16]
Carrasquilla and R
J. Carrasquilla and R. G. Melko, Machine learning phases of matter, Nat. Phys.13, 431 (2017)
2017
-
[17]
Bhaskar, A
D. Bhaskar, A. Manhart, J. Milzman, J. T. Nardini, K. M. Storey, C. M. Topaz, and L. Ziegelmeier, Analyz- ing collective motion with machine learning and topology, Chaos29, 123125 (2019)
2019
-
[18]
R. E. Baker, J.-M. Pe˜ na, J. Jayamohan, and A. J´ erusalem, Mechanistic models versus machine learn- ing, a fight worth fighting for the biological community?, Biol. Lett.14, 20170660 (2018)
2018
-
[19]
T. Xue, X. Li, X. Chen, L. Chen, and Z. Han, Machine learning phases in swarming systems, Mach. Learn.: Sci. Technol.4, 015028 (2023)
2023
-
[20]
A. P. Solon and J. Tailleur, Revisiting the flocking tran- sition using active spins, Phys. Rev. Lett.111, 078101 (2013)
2013
-
[21]
J. M. Kosterlitz, The critical properties of the two- dimensional xy model, J. Phys. C7, 1046 (1974)
1974
-
[22]
Binder, Critical properties from Monte Carlo coarse graining and renormalization, Phys
K. Binder, Critical properties from Monte Carlo coarse graining and renormalization, Phys. Rev. Lett.47, 693 (1981)
1981
-
[23]
Baglietto and E
G. Baglietto and E. V. Albano, Nature of the order- disorder transition in the Vicsek model for the collec- tive motion of self-propelled particles, Phys. Rev. E80, 050103 (2009)
2009
-
[24]
Barberis, Emergence of a single cluster in Vicsek’s model at very low noise, Phys
L. Barberis, Emergence of a single cluster in Vicsek’s model at very low noise, Phys. Rev. E98, 032607 (2018)
2018
-
[25]
Chat´ e, Dry aligning dilute active matter, Annu
H. Chat´ e, Dry aligning dilute active matter, Annu. Rev. Condens. Matter Phys.11, 189 (2020)
2020
-
[26]
Dagum and R
L. Dagum and R. Menon, OpenMP: an industry stan- dard API for shared-memory programming, IEEE Com- put. Sci. Eng.5, 46 (1998)
1998
-
[27]
HPC Cluster — TJ CSL — documentation.tjhsst.edu, https://documentation.tjhsst.edu/machines/ hpc-cluster, [Accessed 30-04-2026]
2026
-
[28]
M. D. McKay, R. J. Beckman, and W. J. Conover, A comparison of three methods for selecting values of input variables in the analysis of output from a computer code, Technometrics21, 239 (1979)
1979
-
[29]
Lloyd, Least squares quantization in PCM, IEEE Trans
S. Lloyd, Least squares quantization in PCM, IEEE Trans. Inf. Theory28, 129 (1982)
1982
-
[30]
Ester, H.-P
M. Ester, H.-P. Kriegel, J. Sander, and X. Xu, A density- based algorithm for discovering clusters in large spatial databases with noise, inProceedings of the Second Inter- national Conference on Knowledge Discovery and Data Mining, KDD’96 (AAAI Press, 1996) pp. 226–231
1996
-
[31]
D. A. Reynolds, Gaussian mixture models, inEncyclope- dia of Biometrics(2018)
2018
-
[32]
A. Ng, M. Jordan, and Y. Weiss, On spectral clustering: Analysis and an algorithm, inNeurIPS, Vol. 14, edited by T. Dietterich, S. Becker, and Z. Ghahramani (MIT Press, 2001)
2001
-
[33]
P. J. Rousseeuw, Silhouettes: A graphical aid to the in- terpretation and validation of cluster analysis, J. Com- put. Appl. Math.20, 53 (1987)
1987
-
[34]
D. L. Davies and D. W. Bouldin, A cluster separa- tion measure, IEEE Trans. Pattern Anal. Mach. Intell. PAMI-1, 224 (1979)
1979
-
[35]
Cali´ nski and J
T. Cali´ nski and J. Harabasz, A dendrite method for clus- ter analysis, Communications in Statistics3, 1 (1974)
1974
-
[36]
Arthur, S
D. Arthur, S. Vassilvitskii,et al., k-means++: The ad- vantages of careful seeding, inSoda, Vol. 7 (2007) pp. 1027–1035
2007
discussion (0)
Sign in with ORCID, Apple, or X to comment. Anyone can read and Pith papers without signing in.