Recognition: unknown
Dynamics of finger-type convection in double-diffusive instability
Pith reviewed 2026-05-09 19:15 UTC · model grok-4.3
The pith
Buoyancy anomaly evolution links finger-type convection growth phases to a time-dependent force balance.
A machine-rendered reading of the paper's core claim, the machinery that carries it, and where it could break.
Core claim
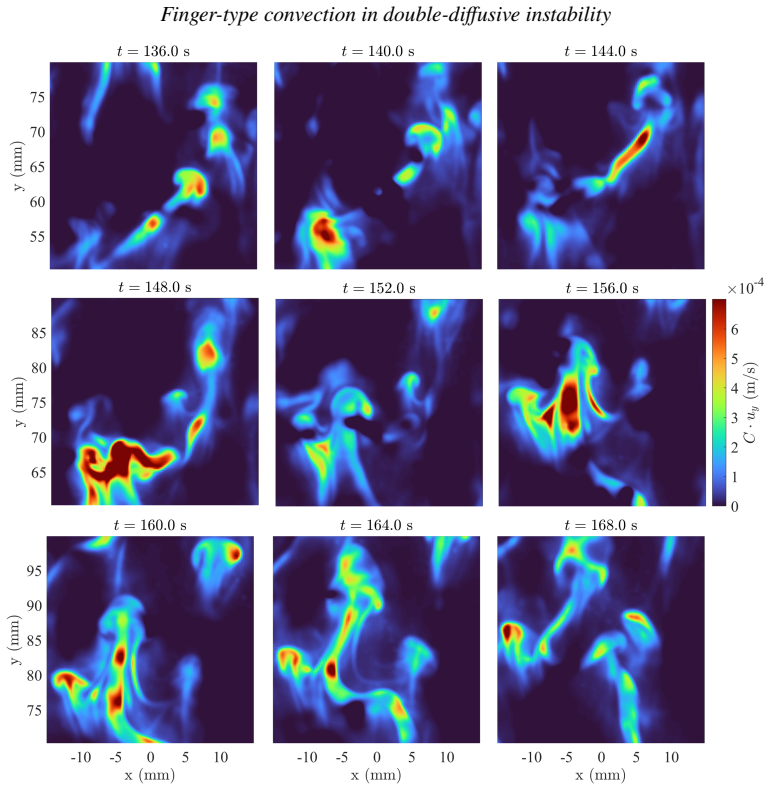
In experiments and matched DNS at fixed thermal contrast and salinity contrasts of 350, 450, and 550 ppm, fingertip growth curves display three phases whose peak rates increase with salinity contrast while nondimensional height histories collapse. The evolution of the buoyancy anomaly supplies the connection to a time-dependent force balance: rising buoyancy produces acceleration, shear-induced resistance maintains quasi-steady propagation, and progressive dilution together with boundary influence produces late deceleration. At 450 ppm the fingertips develop symmetric vortex rings that organize vertical transport; at 550 ppm stronger buoyancy destabilizes the rings into asymmetric roll-up, z
What carries the argument
The evolving buoyancy anomaly at the fingertips, which supplies the time-dependent force balance that sequences acceleration, quasi-steady propagation, and decay.
Load-bearing premise
The sealed-surface laboratory facility with the chosen salinity contrasts accurately represents the intermediate regime of finger-type double-diffusive instability without dominant boundary artifacts or detection bias from the fingertip tracking framework.
What would settle it
Direct time series of the buoyancy anomaly measured at tracked fingertips that fail to show the predicted increase during acceleration, balance during quasi-steady propagation, and decrease during decay would falsify the claimed link between anomaly evolution and growth-rate phases.
Figures


read the original abstract
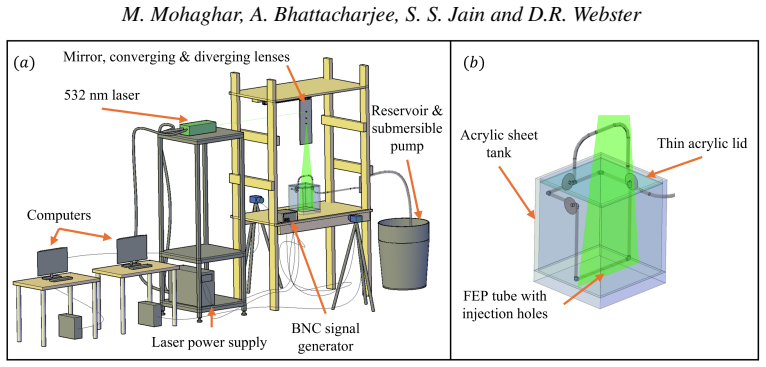
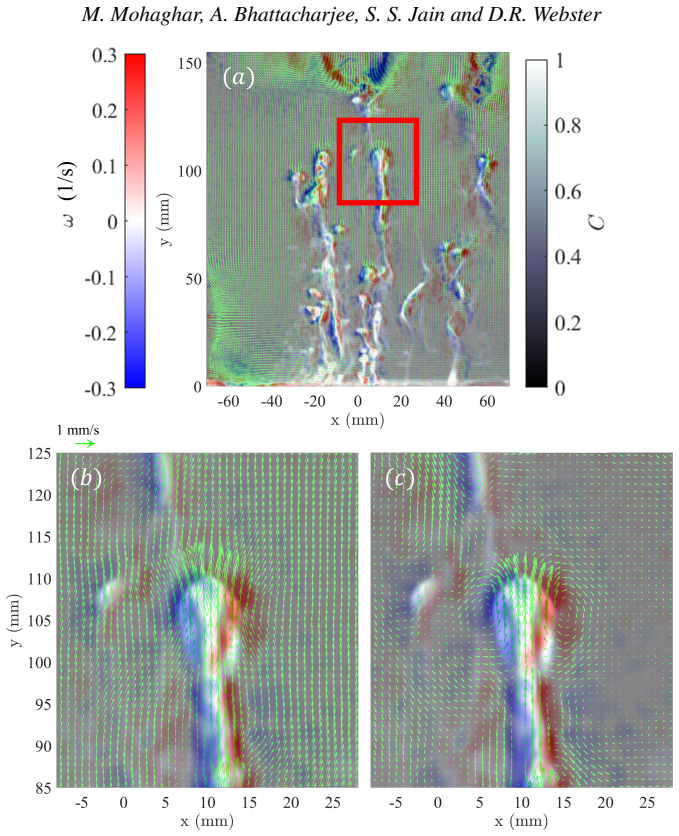
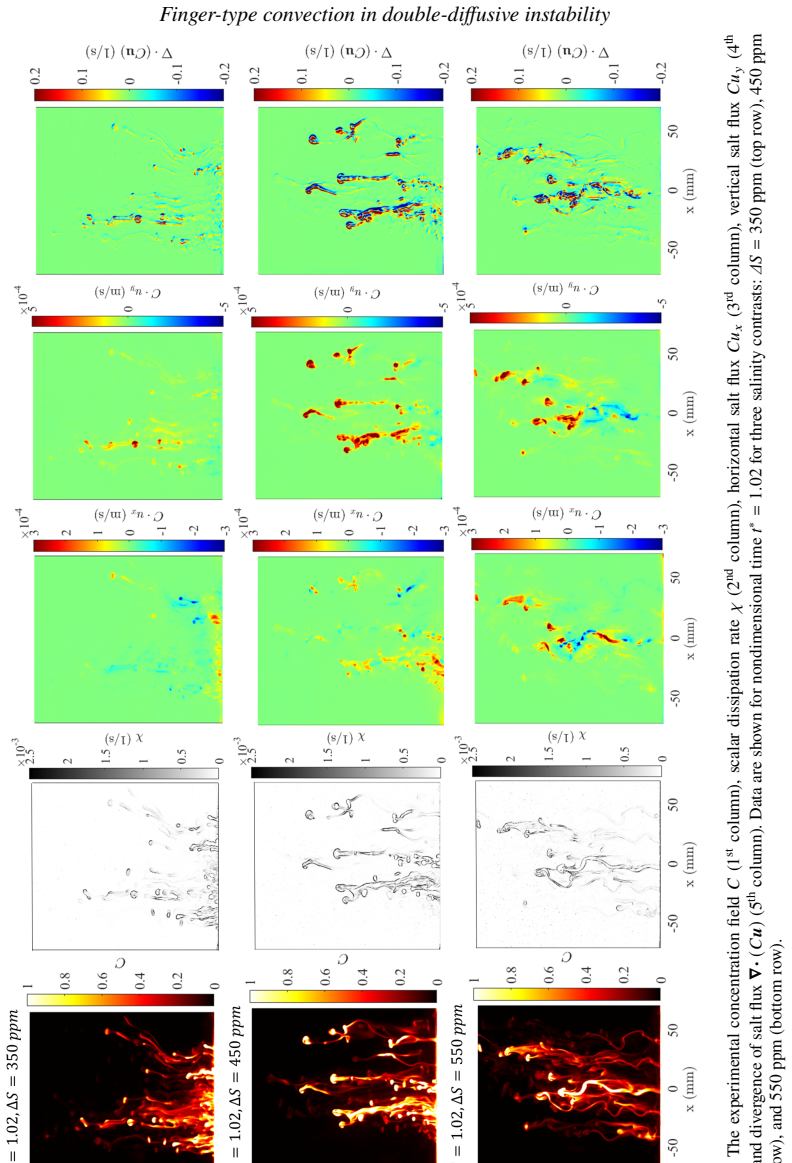
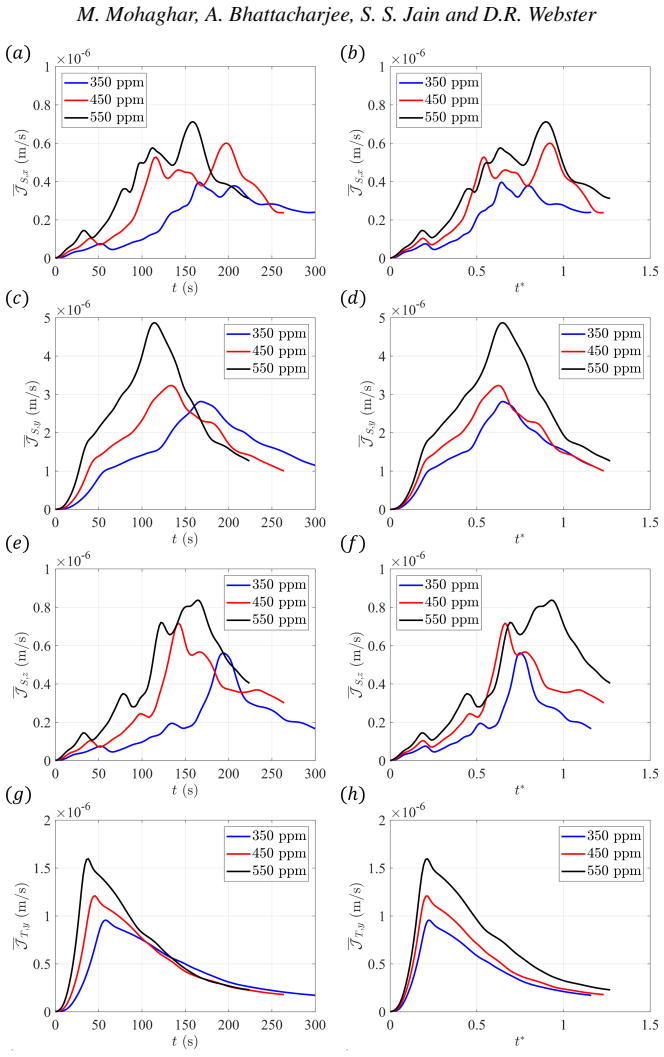
Finger-type convection in double-diffusive instability (DDI) controls mixing and scalar transport in many stratified flows, yet a quantitative, finger-resolved description of the transient growth, transport, and saturation pathways has been limited. Here, finger-type DDI is analyzed in a sealed-surface laboratory facility using synchronized planar laser-induced fluorescence (PLIF) and particle image velocimetry (PIV) at fixed thermal contrast $\Delta T=5^\circ$C and three salinity contrasts, $\Delta S=350$, 450, and 550 ppm, complemented by a matched high-resolution three-dimensional DNS. A systematic fingertip detection and tracking framework generates ensemble growth curves. Fingertip growth follows a sequence of three stages (acceleration, quasi-steady propagation, and decay). The peak growth rates increase monotonically with $\Delta S$, and nondimensional fingertip-height histories collapse onto a common trend. The peak growth rates are reproduced by DNS and agree with linear stability analysis, establishing experiment--DNS--theory consistency in the intermediate regime. The mixed-material area increases with time, initially following a common nondimensional trend before transitioning to $\Delta S$-dependent interaction and breakdown. Finger-scale measurements reveal the formation of a symmetric vortex ring at the fingertips for $\Delta S=450$ ppm, inducing vertical-aligned transport. At $\Delta S=550$ ppm the roll-up becomes asymmetric: stronger buoyancy amplifies shear, destabilizes the vortex ring, and produces a zig-zag/lateral-drift mode that enhances the lateral transport. Finally, the evolution of the buoyancy anomaly links the growth-rate phases to a time-dependent force balance in which increasing buoyancy drives acceleration, shear-induced resistance regulates quasi-steady propagation, and dilution with top-boundary influence yields late-stage fingertip deceleration.
Editorial analysis
A structured set of objections, weighed in public.
Referee Report
Summary. The manuscript examines finger-type double-diffusive instability (DDI) in a sealed laboratory facility using synchronized PLIF/PIV measurements at fixed ΔT = 5°C and three salinity contrasts (ΔS = 350, 450, 550 ppm), supported by matched 3D DNS. It reports three distinct stages of fingertip growth (acceleration, quasi-steady propagation, decay), monotonic increase of peak growth rates with ΔS, collapse of nondimensional fingertip-height histories, agreement of peak rates with linear stability analysis, formation of symmetric or asymmetric vortex rings depending on ΔS, and an interpretation of the buoyancy-anomaly evolution as establishing a time-dependent force balance (buoyancy-driven acceleration, shear-regulated propagation, and late-stage deceleration from dilution plus top-boundary effects). Mixed-material area growth and lateral transport modes are also quantified.
Significance. If the reported experiment–DNS–theory consistency and the buoyancy-anomaly linkage to force-balance regimes hold, the work supplies a quantitative, finger-resolved description of transient growth and saturation pathways that is currently limited in the DDI literature. The ensemble tracking, vortex-ring observations, and nondimensional collapse are useful for refining mixing parameterizations in stratified flows. The direct comparison to existing linear stability analysis and the use of high-resolution DNS constitute clear strengths.
major comments (2)
- [abstract (buoyancy anomaly discussion) and corresponding results section on growth phases] The central claim that the evolution of the buoyancy anomaly establishes three distinct force-balance regimes (abstract, final paragraph) rests on the late-stage deceleration being caused by top-boundary influence and dilution. No domain-height variation, comparison to periodic-boundary DNS, or sensitivity test is described, leaving open the possibility that the observed decay phase and the inferred force balance reflect the sealed-surface facility rather than intrinsic finger dynamics. This is load-bearing because the three-stage interpretation and the experiment–DNS consistency are asserted for the intermediate regime.
- [methods section describing the PLIF/PIV tracking framework] The fingertip detection and tracking framework that generates the ensemble growth curves and buoyancy-anomaly time series is not validated against independent methods (e.g., manual annotation or alternative image-processing thresholds). Systematic bias in timing or amplitude of the detected peaks would directly affect the extracted force-balance phases and the reported collapse of nondimensional histories.
minor comments (2)
- [experimental parameters] Units for salinity contrast are given as ppm; explicit conversion to practical salinity units or density difference would aid reproducibility.
- [DNS methods] The manuscript would benefit from a brief statement on the grid resolution and domain aspect ratio used in the matched DNS to allow direct comparison with the laboratory facility dimensions.
Simulated Author's Rebuttal
We thank the referee for their thorough review and positive assessment of the significance of our work. We address each of the major comments point by point below.
read point-by-point responses
-
Referee: [abstract (buoyancy anomaly discussion) and corresponding results section on growth phases] The central claim that the evolution of the buoyancy anomaly establishes three distinct force-balance regimes (abstract, final paragraph) rests on the late-stage deceleration being caused by top-boundary influence and dilution. No domain-height variation, comparison to periodic-boundary DNS, or sensitivity test is described, leaving open the possibility that the observed decay phase and the inferred force balance reflect the sealed-surface facility rather than intrinsic finger dynamics. This is load-bearing because the three-stage interpretation and the experiment–DNS consistency are asserted for the intermediate regime.
Authors: We agree that the absence of domain-height variations or periodic-boundary simulations leaves the attribution of the late-stage decay open to interpretation. The DNS domain is matched to the experimental facility, including the top boundary condition, and the decay phase is observed consistently in both. The primary support for the three stages comes from the buoyancy anomaly time series and the matching of peak growth rates to linear theory in the intermediate regime. In the revised manuscript, we will expand the discussion to explicitly note this limitation and emphasize that the acceleration and quasi-steady phases are robustly supported by the multi-method agreement, while the decay phase may include boundary effects. We will also clarify that the force-balance interpretation is observational rather than definitive. revision: partial
-
Referee: [methods section describing the PLIF/PIV tracking framework] The fingertip detection and tracking framework that generates the ensemble growth curves and buoyancy-anomaly time series is not validated against independent methods (e.g., manual annotation or alternative image-processing thresholds). Systematic bias in timing or amplitude of the detected peaks would directly affect the extracted force-balance phases and the reported collapse of nondimensional histories.
Authors: We acknowledge the importance of validating the automated tracking method. In the revised version, we will add a validation subsection in the methods, where we compare the automated fingertip detection results against manual tracking on a representative sample of images from each ΔS case. This will include quantitative metrics on the agreement of detected peak times and growth rates to demonstrate that any bias is minimal and does not affect the reported trends. revision: yes
Circularity Check
No significant circularity; claims rest on direct measurements, independent DNS, and external linear stability analysis.
full rationale
The paper's core results—fingertip growth stages, peak growth rates, mixed-material area evolution, vortex structures, and buoyancy-anomaly force balance—are obtained from direct PLIF/PIV tracking in the sealed facility, ensemble averaging, and high-resolution DNS. Peak growth rates are compared to (not derived from) independent linear stability analysis. The time-dependent force balance is an interpretive link extracted from observed buoyancy anomaly histories rather than a fitted parameter or self-referential definition. No self-citations are invoked as load-bearing uniqueness theorems, no ansatzes are smuggled, and no predictions reduce by construction to inputs defined by the same dataset. The derivation chain is self-contained against external benchmarks.
Axiom & Free-Parameter Ledger
Reference graph
Works this paper leans on
-
[1]
Nonlinear Evolution and Structure of Salt Fingers , editor =. 1980 , booktitle =. doi:https://doi.org/10.1016/S0422-9894(08)71222-4 , author =
-
[2]
Experimental investigation of non-linear standing internal waves using combined density and velocity measurements , author=. Exp. Fluids , volume=. 2023 , publisher=
2023
-
[3]
, title =
Shen, C.Y. , title =. Phys. Fluids. , volume =. 1995 , month =
1995
-
[4]
The evolution of the double-diffusive instability: Salt fingers , author=. Phys. Fluids A , volume=. 1989 , publisher=
1989
-
[5]
Deep-Sea Res
An ocean curiosity: the perpetual salt fountain , author=. Deep-Sea Res. , volume=
-
[6]
salt-fountain
The “salt-fountain” and thermohaline convection , author=. Tellus , volume=. 1960 , publisher=
1960
-
[7]
Double-diffusive phenomena , author=. Annu. Rev. Fluid Mech. , volume=. 1974 , publisher=
1974
-
[8]
Double diffusion in oceanography , author=. Annu. Rev. Fluid Mech. , volume=
-
[9]
2013 , publisher=
Double-diffusive convection , author=. 2013 , publisher=
2013
-
[10]
The characteristics of salt fingers in a variety of fluid systems, including stellar interiors, liquid metals, oceans, and magmas , author=. Phys. Fluids , volume=. 1983 , publisher=
1983
-
[11]
Deep-Sea Res
The growth rate of super-critical salt fingers , author=. Deep-Sea Res. A , volume=. 1979 , publisher=
1979
-
[12]
The coupled turbulent transports of salt and heat across a sharp density interface , author=. Int. J. Heat Mass Transf. , volume=. 1965 , publisher=
1965
-
[13]
Experiments on double diffusive convection , author=. C. R. Phys. , volume=
-
[14]
A new case of convection in the presence of combined vertical salinity and temperature gradients , author=. Proc. Natl. Acad. Sci. U.S.A. , volume=
-
[15]
Collective instability of salt fingers , author=. J. Fluid Mech. , volume=. 1969 , publisher=
1969
-
[16]
Deep-Sea Res
Salt fingers and convecting layers , author=. Deep-Sea Res. Oceanogr. Abstr. , volume=. 1969 , organization=
1969
-
[17]
Deep-Sea Res
Laboratory experiments on the structure of salt fingers , author=. Deep-Sea Res. A , volume=. 1989 , publisher=
1989
-
[18]
Anisotropy of salt fingers , author=. J. Phys. Oceanogr. , volume=
-
[19]
Observations of the cell structure of salt fingers , author=. J. Fluid Mech. , volume=. 1970 , publisher=
1970
-
[20]
Flux measurements across a finger interface at low values of the stability ratio , author=. J. Mar. Res. , volume=
-
[21]
Double-diffusive convection with imposed vertical mass flux , author=. J. Mar. Res. , volume=
-
[22]
Double-diffusive interleaving on horizontal gradients , author=. J. Fluid Mech. , volume=. 2006 , publisher=
2006
-
[23]
High Rayleigh number convection with double diffusive fingers , author=. Phys. Fluids , volume=. 2010 , publisher=
2010
-
[24]
Transition to finger convection in double-diffusive convection , author=. Phys. Fluids , volume=. 2014 , publisher=
2014
-
[25]
Origin of thermohaline staircases , author=. J. Phys. Oceanogr. , volume=
-
[26]
Astrophys
Turbulent mixing and layer formation in double-diffusive convection: Three-dimensional numerical simulations and theory , author=. Astrophys. J. , volume=. 2011 , publisher=
2011
-
[27]
Scaling laws and flow structures of double diffusive convection in the finger regime , author=. J. Fluid Mech. , volume=. 2016 , publisher=
2016
-
[28]
From convection rolls to finger convection in double-diffusive turbulence , author=. Proc. Natl. Acad. Sci. U.S.A. , volume=. 2016 , publisher=
2016
-
[29]
Multiple states and transport properties of double-diffusive convection turbulence , author=. Proc. Natl. Acad. Sci. U.S.A. , volume=. 2020 , publisher=
2020
-
[30]
Numerical experiments on salt-finger convection , author=. Prog. Oceanogr. , volume=. 2003 , publisher=
2003
-
[31]
Direct numerical simulation of salt sheets and turbulence in a double-diffusive shear layer , author=. Geophys. Res. Lett. , volume=. 2007 , publisher=
2007
-
[32]
Copepod behavior responses around internal waves , author=. Front. Mar. Sci. , volume=. 2020 , publisher=
2020
-
[33]
2019 , type =
Effects of initial conditions and Mach number on turbulent mixing transition of shock-driven variable-density flow , author =. 2019 , type =
2019
-
[34]
Evaluation of turbulent mixing transition in a shock-driven variable-density flow , author=. J. Fluid Mech. , volume=. 2017 , publisher=
2017
-
[35]
A review of oceanic salt-fingering theory , author=. Prog. Oceanogr. , volume=. 2003 , publisher=
2003
-
[36]
Form of the temperature-salinity relationship in the central water: Evidence for double-diffusive mixing , author=. J. Phys. Oceanogr. , volume=
-
[37]
A new vision of giant planet interiors: Impact of double diffusive convection , author=. Astron. Astrophys. , volume=. 2012 , publisher=
2012
-
[38]
Layered convection as the origin of Saturn’s luminosity anomaly , author=. Nat. Geosci. , volume=. 2013 , publisher=
2013
-
[39]
Astrophys
Chemical transport and spontaneous layer formation in fingering convection in astrophysics , author=. Astrophys. J. , volume=. 2013 , publisher=
2013
-
[40]
Astrophys
Numerical simulations of thermohaline convection: implications for extra-mixing in low-mass RGB stars , author=. Astrophys. J. , volume=. 2010 , publisher=
2010
-
[41]
On finite amplitude instability in thermohaline convection , author=. J. Mar. Res. , volume=
-
[42]
On thermohaline convection with linear gradients , author=. J. Fluid Mech. , volume=. 1969 , publisher=
1969
-
[43]
Deep-Sea Res
On the structure of salt fingers , author=. Deep-Sea Res. Oceanogr. Abstr. , volume=. 1973 , organization=
1973
-
[44]
On the vertical transport due to fingers in double diffusive convection , author=. J. Fluid Mech. , volume=. 1972 , publisher=
1972
-
[45]
Experiments on double-diffusive sugar--salt fingers at high stability ratio , author=. J. Fluid Mech. , volume=. 1996 , publisher=
1996
-
[46]
Double-diffusive finger convection: influence of concentration at fixed buoyancy ratio , author=. J. Fluid Mech. , volume=. 2002 , publisher=
2002
-
[47]
A mechanism for layer formation in a double-diffusive fluid , author=. J. Fluid Mech. , volume=. 2003 , publisher=
2003
-
[48]
Staircase formation in unstably stratified double diffusive finger convection , author=. Phys. Fluids , volume=. 2022 , publisher=
2022
-
[49]
Double-diffusive transport in laboratory thermohaline staircases , author=. J. Fluid Mech. , volume=. 2003 , publisher=
2003
-
[50]
Stability analysis , author=
Double-diffusive instability in an inclined fluid layer Part 2. Stability analysis , author=. J. Fluid Mech. , volume=. 1980 , publisher=
1980
-
[51]
Double-diffusive instability in an inclined fluid layer. Part 1. Experimental investigation , author=. J. Fluid Mech. , volume=. 1980 , publisher=
1980
-
[52]
Water Resour
Experimental investigation of the stability boundary for double-diffusive finger convection in a Hele-Shaw cell , author=. Water Resour. Res. , volume=. 1997 , publisher=
1997
-
[53]
On the collective instability of salt fingers , author=. J. Fluid Mech. , volume=. 1981 , publisher=
1981
-
[54]
Astrophys
Double-diffusive mixing in stellar interiors in the presence of horizontal gradients , author=. Astrophys. J. Lett. , volume=. 2014 , publisher=
2014
-
[55]
Astrophys
2D or not 2D: the effect of dimensionality on the dynamics of fingering convection at low Prandtl number , author=. Astrophys. J. , volume=. 2015 , publisher=
2015
-
[56]
Double-diffusive transport in multicomponent vertical convection , author=. Phys. Rev. Fluids , volume=. 2023 , publisher=
2023
-
[57]
Double-diffusive convection at low Prandtl number , author=. Annu. Rev. Fluid Mech. , volume=. 2018 , publisher=
2018
-
[58]
Accurate conservative phase-field method for simulation of two-phase flows , author=. J. Comput. Phys. , volume=. 2022 , publisher=
2022
-
[59]
A model for transport of interface-confined scalars and insoluble surfactants in two-phase flows , author=. J. Comput. Phys. , volume=. 2024 , publisher=
2024
-
[60]
Stationary states of forced two-phase turbulence , author=. Chem. Eng. J. , volume=. 2025 , publisher=
2025
-
[61]
arXiv preprint arXiv:2510.10857 , year=
A model for transport of soluble surfactants in two-phase flows , author=. arXiv preprint arXiv:2510.10857 , year=
-
[62]
Vortex rings from cylinders with inclined exits , author=. Phys. Fluids , volume=. 1998 , publisher=
1998
discussion (0)
Sign in with ORCID, Apple, or X to comment. Anyone can read and Pith papers without signing in.