Recognition: unknown
How Historians Use Visualization: A Corpus-Backed Taxonomy and Analysis for Cross-Disciplinary Practice
Pith reviewed 2026-05-10 14:49 UTC · model grok-4.3
The pith
Historians use visualizations in five distinct roles but face barriers that limit their adoption.
A machine-rendered reading of the paper's core claim, the machinery that carries it, and where it could break.
Core claim
The paper establishes that visualizations serve five roles in historical scholarship—primary-source, evidence-synthesis, communicative, confirmative, and exploratory—and that epistemological barriers including uncertainty, provenance tracking, justification requirements, and publication constraints hinder broader adoption despite diverse goals.
What carries the argument
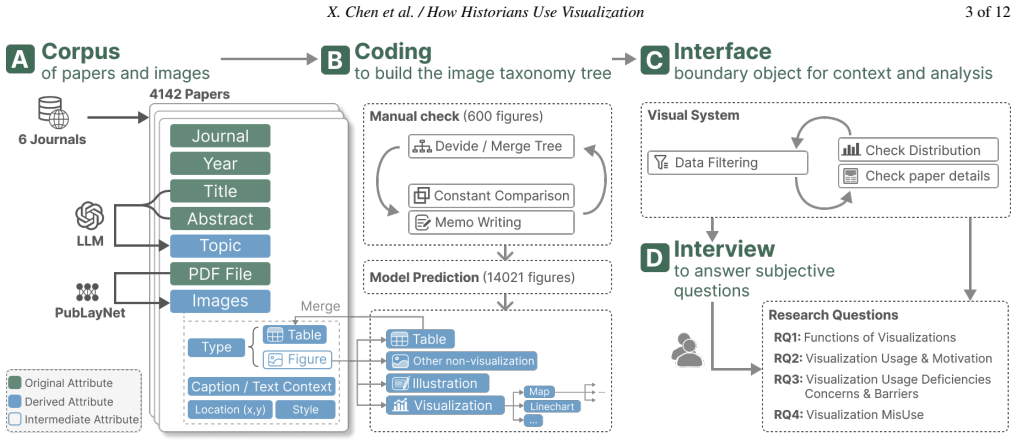
A collaboratively developed hierarchical taxonomy applied to classify 4,831 visualization instances drawn from 14,021 images across 4,142 articles, combined with semi-automatic labeling and historian interviews.
If this is right
- Visualization adoption patterns differ across history subfields, venues, and time periods.
- Historians pursue varied goals with figures, creating openings for specialized design interventions.
- Reducing the identified barriers would increase both the frequency and effectiveness of visualization use in historical work.
Where Pith is reading between the lines
- The taxonomy offers a reusable scaffold for parallel studies in adjacent fields such as anthropology or literary studies.
- Visualization systems that embed explicit uncertainty and provenance handling could directly lower the documented adoption hurdles.
- Journal policy adjustments to ease visual content requirements might accelerate integration of exploratory and confirmative figures.
Load-bearing premise
The selected journals, collaboratively built taxonomy, and semi-automatic labeling together capture historians' actual visualization practices without major selection or classification bias.
What would settle it
A new corpus drawn from additional history journals that shows markedly different role frequencies or that historians in follow-up interviews do not recognize the listed barriers would falsify the central claims.
Figures

read the original abstract
Visualization in historical research is shifting from isolated attempts to systematic practices. However, data-driven evidence about how historians actually use visualization remains scarce. We present a corpus-driven, mixed-methods study that combines analysis of images from 4,142 research articles across history and digital humanities journals with a collaboratively developed visualization taxonomy and a semi-automatic labeling pipeline. We construct a corpus of 14,021 images, classify 4,831 visualization instances using a hierarchical, domain-informed taxonomy, and analyze patterns of visualization adoption across venues, history subfields, and time. To interpret these patterns, we conduct interviews with 11 historians and use HiFigAtlas system as a boundary object to support joint inspection of the corpus. We identify distinct roles for visualizations in historical research: primary-source, evidence-synthesis, communicative, confirmative, and exploratory. We further find that while historians pursue diverse goals with figures, persistent epistemological and practical barriers, such as uncertainty, provenance, justification burden, and publication constraints, impede the adoption of visualization. This work contributes a grounded account of visualization use in historical scholarship and points to opportunities to better support domain-specific needs.
Editorial analysis
A structured set of objections, weighed in public.
Referee Report
Summary. The paper presents a corpus-driven mixed-methods study analyzing 14,021 images from 4,142 articles across history and digital humanities journals. Using a collaboratively developed hierarchical taxonomy and semi-automatic labeling, the authors classify 4,831 visualization instances, identify five roles (primary-source, evidence-synthesis, communicative, confirmative, exploratory), analyze adoption patterns across venues/subfields/time, and triangulate with 11 historian interviews plus the HiFigAtlas system to highlight barriers including uncertainty, provenance, justification burden, and publication constraints.
Significance. If the central claims hold, this provides one of the first large-scale empirical accounts of visualization use in historical scholarship, filling a noted gap in domain-specific evidence. The mixed-methods design, scale of the corpus, and collaborative taxonomy development are strengths that support cross-disciplinary insights; the HiFigAtlas boundary object and interview triangulation add interpretive depth. This can usefully inform visualization tool design tailored to historians' needs.
major comments (2)
- [Methods (corpus construction)] The corpus selection criteria for the 4,142 articles (including explicit sampling frame, journal inclusion rationale, and subfield coverage such as political vs. cultural history) are insufficiently detailed. This directly affects the representativeness of the 4,831 classified instances and the validity of patterns reported across venues and time.
- [Methods (labeling pipeline)] Validation metrics for the semi-automatic labeling pipeline (inter-rater reliability, accuracy rates, or error analysis for taxonomy category assignment) are not reported. Since the five roles and barrier interpretations rest on the accuracy of these classifications, this is a load-bearing gap even with interview triangulation.
minor comments (1)
- [Abstract] Clarify in the abstract or results how many of the 14,021 extracted images were ultimately classified versus discarded, to improve transparency on the classification scope.
Simulated Author's Rebuttal
We thank the referee for the positive evaluation of the paper's significance and for the detailed methodological feedback. The comments identify clear opportunities to strengthen transparency. We address each point below and will revise the manuscript accordingly.
read point-by-point responses
-
Referee: The corpus selection criteria for the 4,142 articles (including explicit sampling frame, journal inclusion rationale, and subfield coverage such as political vs. cultural history) are insufficiently detailed. This directly affects the representativeness of the 4,831 classified instances and the validity of patterns reported across venues and time.
Authors: We agree that additional detail is required. In the revised manuscript we will expand the Corpus Construction section to specify the sampling frame (systematic selection of articles from 2010–2022 in selected journals), the journal inclusion rationale (prioritizing high-impact history and digital humanities venues with broad subfield representation), and subfield coverage (with explicit counts and proportions for political, cultural, social, economic, and other history subfields). A supplementary table listing all journals, article counts, and subfield distributions will be added to allow direct assessment of representativeness. revision: yes
-
Referee: Validation metrics for the semi-automatic labeling pipeline (inter-rater reliability, accuracy rates, or error analysis for taxonomy category assignment) are not reported. Since the five roles and barrier interpretations rest on the accuracy of these classifications, this is a load-bearing gap even with interview triangulation.
Authors: We acknowledge this as a substantive omission. Although the taxonomy was developed collaboratively and the pipeline incorporated manual review, quantitative validation metrics were not reported. In the revision we will insert a dedicated Validation subsection reporting inter-rater reliability (Cohen’s kappa on a double-coded subset), accuracy rates on the manually validated sample, and a category-level error analysis. These additions will directly support the reliability of the role classifications and the subsequent interpretations. revision: yes
Circularity Check
No circularity: empirical corpus analysis grounded in external data
full rationale
The paper conducts a mixed-methods study by constructing a corpus from 4,142 external journal articles, extracting 14,021 images, collaboratively developing a taxonomy, applying semi-automatic labeling to 4,831 instances, analyzing patterns, and triangulating with 11 historian interviews. No mathematical derivations, fitted parameters, predictions, or self-citations reduce the identified roles or barriers to the study's own inputs by construction. Claims rest on observable data from independent sources rather than self-referential definitions or loops.
Axiom & Free-Parameter Ledger
axioms (2)
- domain assumption The selected journals and articles form a representative sample of visualization practices in historical research.
- domain assumption The hierarchical taxonomy and semi-automatic labeling pipeline correctly classify visualization instances.
Reference graph
Works this paper leans on
-
[2]
: Troubling collaboration: Matters of care for visualization design study
Akbaba D., Lange D., Correll M., Lex A., Meyer M. : Troubling collaboration: Matters of care for visualization design study. In Proceedings of the CHI Conference on Human Factors in Computing Systems (2023), ACM. https://doi.org/10.1145/3544548.3581168 doi:10.1145/3544548.3581168
-
[3]
: Thematic Analysis: A Practical Guide
Braun V., Clarke V. : Thematic Analysis: A Practical Guide. SAGE Publications, 2021
2021
-
[5]
J., El-Assady M., Coles K., Alexander E., Chen M., Collins C., J \"a nicke S., Wrisley D
Bradley A. J., El-Assady M., Coles K., Alexander E., Chen M., Collins C., J \"a nicke S., Wrisley D. J. : Visualization and the digital humanities. IEEE Computer Graphics and Applications 38, 6 (2018), 26--38. https://doi.org/10.1109/MCG.2018.2878900 doi:10.1109/MCG.2018.2878900
-
[7]
: Eyewitnessing: The Uses of Images as Historical Evidence
Burke P. : Eyewitnessing: The Uses of Images as Historical Evidence. Cornell University Press, 2001
2001
-
[9]
: Constructing Grounded Theory, 3 ed
Charmaz K. : Constructing Grounded Theory, 3 ed. Introducing Qualitative Methods. SAGE Publications, Thousand Oaks, CA, USA, 2024
2024
-
[10]
https://clarivate.com/academia-government/scientific-and-academic-research/research-discovery-and-referencing/web-of-science/web-of-science-core-collection/, 1997
Clarivate : Web of science core collection. https://clarivate.com/academia-government/scientific-and-academic-research/research-discovery-and-referencing/web-of-science/web-of-science-core-collection/, 1997
1997
-
[12]
Collingwood R. G. : The Idea of History: With Lectures 1926-1928. Oxford University Press, 1994
1926
-
[13]
: Ethical dimensions of visualization research
Correll M. : Ethical dimensions of visualization research. In Proceedings of the CHI Conference on Human Factors in Computing Systems (2019), ACM, pp. 1--13. https://doi.org/10.1145/3290605.3300418 doi:10.1145/3290605.3300418
-
[15]
D'Ignazio C., Klein L. F. : Feminist data visualization. In Proceedings of the IEEE VIS Workshop on Visualization for the Digital Humanities (2016), IEEE
2016
-
[18]
Esri : ArcMap , 1999
1999
-
[20]
W., Engerman S
Fogel R. W., Engerman S. L. : Time on the Cross: The Economics of American Negro Slavery. W. W. Norton & Company, 1995
1995
-
[21]
: Network Visualization and the Labor of Reference Work: Three Case Studies Touching Medieval and Early Modern Book History
Fischer L. : Network Visualization and the Labor of Reference Work: Three Case Studies Touching Medieval and Early Modern Book History. PhD thesis, The University of Texas at Austin, 2023
2023
-
[23]
: Data visualization for history
Grandjean M. : Data visualization for history. In Handbook of Digital Public History, Noiret S., Tebeau M., Zaagsma G., (Eds.). De Gruyter Oldenbourg, 2022, pp. 291--300. https://doi.org/10.1515/9783110430295-024 doi:10.1515/9783110430295-024
-
[27]
: Valuable research for visualization and digital humanities: A balancing act
J \"a nicke S. : Valuable research for visualization and digital humanities: A balancing act. In Proceedings of the IEEE VIS Workshop on Visualization for the Digital Humanities (2016), IEEE
2016
-
[28]
J \"a nicke S., Franzini G., Cheema M. F., Scheuermann G. : Visual text analysis in digital humanities. Computer Graphics Forum 36, 6 (2017), 226--250. https://doi.org/10.1111/cgf.12873 doi:10.1111/cgf.12873
-
[32]
S., Wu J., Giles C
Karishma Z., Rohatgi S., Puranik K. S., Wu J., Giles C. L. : ACL - Fig : A dataset for scientific figure classification. In Proceedings of the AAAI Workshop on Scientific Document Understanding (2023)
2023
-
[33]
: When the tech kids are running too fast: Data visualisation through the lens of art history research
Lamqaddam H., Brosens K., Truyen F., Beerens J., de Prekel I., Aerts J., Verbert K. : When the tech kids are running too fast: Data visualisation through the lens of art history research. In Proceedings of the IEEE VIS Workshop on Visualization for the Digital Humanities (2018), IEEE
2018
-
[38]
Mordechai L., Stahl A., Pyzyk M., Pelle I. C. : Systematic bias in humanities datasets: Ancient and medieval coin finds in the FLAME project. Digital Humanities Quarterly 019, 1 (2025)
2025
-
[39]
: Visualization Analysis and Design
Munzner T. : Visualization Analysis and Design. CRC Press, 2014
2014
-
[42]
: Cartographies of Time: A History of the Timeline, 1 ed
Rosenberg D., Grafton A. : Cartographies of Time: A History of the Timeline, 1 ed. Princeton Architectural Press, 2010
2010
-
[43]
W., Hallacy C., Ramesh A., Goh G., Agarwal S., Sastry G., Askell A., Mishkin P., Clark J., Krueger G., Sutskever I
Radford A., Kim J. W., Hallacy C., Ramesh A., Goh G., Agarwal S., Sastry G., Askell A., Mishkin P., Clark J., Krueger G., Sutskever I. : Learning transferable visual models from natural language supervision. In Proceedings of the International Conference on Machine Learning (2021), Meila M., Zhang T., (Eds.), vol. 139, PMLR, pp. 8748--8763
2021
-
[54]
Web of Science Core Collection , author =
-
[55]
Data Visualization for History , doi =
Grandjean, Martin , booktitle =. Data Visualization for History , doi =
-
[56]
Art Documentation: Journal of the Art Libraries Society of North America , _month = sep, publisher =
Ewalt, Jillian , title =. Art Documentation: Journal of the Art Libraries Society of North America , _month = sep, publisher =. doi:10.1086/688723 , issn =
-
[57]
Ethical Dimensions of Visualization Research , doi =
Correll, Michael , booktitle =. Ethical Dimensions of Visualization Research , doi =
-
[58]
IEEE Transactions on Visualization and Computer Graphics , mendeley-tags =
Zhang, Yu and Chen, Xinyue and Zheng, Weili and Guo, Yuhan and Li, Guozheng and Chen, Siming and Yuan, Xiaoru , title =. IEEE Transactions on Visualization and Computer Graphics , mendeley-tags =. doi:10.1109/TVCG.2025.3567132 , number =
-
[59]
IEEE Transactions on Visualization and Computer Graphics , mendeley-tags =
Chen, Jian and Ling, Meng and Li, Rui and Isenberg, Petra and Isenberg, Tobias and Sedlmair, Michael and M. IEEE Transactions on Visualization and Computer Graphics , mendeley-tags =. doi:10.1109/TVCG.2021.3054916 , issn =
-
[60]
The American Historical Review , _month = sep, publisher =
Kliger, Gili , title =. The American Historical Review , _month = sep, publisher =. doi:10.1093/ahr/rhac220 , issn =
-
[61]
The American Historical Review , _month = oct, publisher =
Index of Topics. The American Historical Review , _month = oct, publisher =. doi:10.1093/ahr/rhz1009 , issn =
-
[62]
IEEE Transactions on Visualization and Computer Graphics , mendeley-tags =
Deng, Dazhen and Wu, Yihong and Shu, Xinhuan and Wu, Jiang and Fu, Siwei and Cui, Weiwei and Wu, Yingcai , title =. IEEE Transactions on Visualization and Computer Graphics , mendeley-tags =. doi:10.1109/TVCG.2022.3155440 , issn =
-
[63]
Glaser, Barney Galland and Strauss, Anselm Leonard , title =
-
[64]
Visual Text Analysis in Digital Humanities , doi =
J. Visual Text Analysis in Digital Humanities , doi =. Computer Graphics Forum , keywords =
-
[65]
Journal of Chinese History , _month = jul, publisher =
Tsui, Lik Hang and Wang, Hongsu , title =. Journal of Chinese History , _month = jul, publisher =. doi:10.1017/jch.2020.21 , issn =
-
[66]
An Overview of the Tesseract OCR Engine
Smith, R. , booktitle =. An Overview of the. doi:10.1109/ICDAR.2007.4376991 , pages =
-
[67]
Collingwood, Robin George , title =
-
[68]
Lee, Charlotte P. , title =. Computer Supported Cooperative Work , keywords =. doi:10.1007/s10606-007-9044-5 , issn =
-
[69]
, booktitle =
D'Ignazio, Catherine and Klein, Lauren F. , booktitle =. Feminist Data Visualization , publisher =
-
[70]
Klein, Lauren F. , title =. American Literature , _month = dec, publisher =. doi:10.1215/00029831-2367310 , issn =
-
[71]
Fischer, Liz , title =
-
[72]
Rosenberg, Daniel and Grafton, Anthony , title =
-
[73]
Munzner, Tamara , title =
-
[74]
Quantitative Science Studies , _month = feb, publisher =
Hendricks, Ginny and Tkaczyk, Dominika and Lin, Jennifer and Feeney, Patricia , title =. Quantitative Science Studies , _month = feb, publisher =. doi:10.1162/qss_a_00022 , issn =
-
[75]
doi:10.63744/r4ysrh7ae534 , number =
Drucker, Johanna , title =. doi:10.63744/r4ysrh7ae534 , number =
-
[76]
IEEE Transactions on Visualization and Computer Graphics , mendeley-tags =
Zhang, Yu and Jiang, Ruike and Xie, Liwenhan and Zhao, Yuheng and Liu, Can and Ding, Tianhong and Chen, Siming and Yuan, Xiaoru , title =. IEEE Transactions on Visualization and Computer Graphics , mendeley-tags =. doi:10.1109/TVCG.2023.3326908 , issn =
-
[77]
2025.Nurturing Capabilities: Unpacking the Gap in Human-Centered Evaluations of AI-Based Systems
Mei, Xiyao and Zhang, Yu and Yang, Chaofan and Shi, Rui and Yuan, Xiaoru , booktitle =. doi:10.1145/3706598.3713276 , isbn =
-
[78]
IEEE Transactions on Visualization and Computer Graphics , keywords =
Panagiotidou, Georgia and Lamqaddam, Houda and Poblome, Jeroen and Brosens, Koenraad and Verbert, Katrien and Vande Moere, Andrew , title =. IEEE Transactions on Visualization and Computer Graphics , keywords =. doi:10.1109/TVCG.2022.3209436 , issn =
-
[79]
Troubling Collaboration: Matters of Care for Visualization Design Study , doi =
Akbaba, Derya and Lange, Devin and Correll, Michael and Lex, Alexander and Meyer, Miriah , booktitle =. Troubling Collaboration: Matters of Care for Visualization Design Study , doi =
-
[80]
doi:10.1093/llc/fqy051 , issn =
Hinrichs, Uta and Forlini, Stefania and Moynihan, Bridget , title =. doi:10.1093/llc/fqy051 , issn =
-
[81]
IEEE Transactions on Visualization and Computer Graphics , keywords =
Hinrichs, Uta and Forlini, Stefania and Moynihan, Bridget , title =. IEEE Transactions on Visualization and Computer Graphics , keywords =. doi:10.1109/TVCG.2015.2467452 , issn =
-
[82]
Proceedings of the IEEE VIS Workshop on Visualization for the Digital Humanities , title =
J. Proceedings of the IEEE VIS Workshop on Visualization for the Digital Humanities , title =
-
[83]
IEEE Transactions on Visualization and Computer Graphics , keywords =
Lamqaddam, Houda and Vande Moere, Andrew and Vanden Abeele, Vero and Brosens, Koenraad and Verbert, Katrien , title =. IEEE Transactions on Visualization and Computer Graphics , keywords =. doi:10.1109/TVCG.2020.3030426 , issn =
-
[84]
Visualization and the Digital Humanities , doi =
Bradley, Adam James and. Visualization and the Digital Humanities , doi =. IEEE Computer Graphics and Applications , keywords =
-
[85]
Visual Resources , publisher =
Martinez, Katharine , title =. Visual Resources , publisher =. doi:10.1080/01973762.1995.9658317 , number =
-
[86]
Studying Large-Scale Behavioral Differences in
T. Studying Large-Scale Behavioral Differences in. doi:10.63744/53wts95vs45u , issn =
-
[87]
doi:10.1093/llc/fqab043 , issn =
Giovannetti, Emiliano and Albanesi, Davide and Bellandi, Andrea and Dattilo, David and Del Grosso, Angelo Mario and Marchi, Simone , title =. doi:10.1093/llc/fqab043 , issn =
-
[88]
Exploring the Transformation of French Trade in the Long Eighteenth Century (1713--1823): The
Charles, Lo. Exploring the Transformation of French Trade in the Long Eighteenth Century (1713--1823): The. Historical Methods: A Journal of Quantitative and Interdisciplinary History , keywords =. doi:10.1080/01615440.2022.2032522 , issn =
-
[89]
Historical Manufacturing Census of
Alm. Historical Manufacturing Census of. Historical Methods: A Journal of Quantitative and Interdisciplinary History , keywords =. doi:10.1080/01615440.2025.2527132 , issn =
-
[90]
Mordechai, Lee and Stahl, Alan and Pyzyk, Mark and Pelle, Ilia Curto , title =
-
[91]
Storey, Emanuel A. , title =. Historical Methods: A Journal of Quantitative and Interdisciplinary History , keywords =. doi:10.1080/01615440.2018.1502641 , issn =
-
[92]
Mengel, David C. , title =. doi:10.1093/pastj/gtq069 , issn =
-
[93]
Charmaz, Kathy , title =
-
[94]
Science, Technology, & Human Values , publisher =
Star, Susan Leigh , title =. Science, Technology, & Human Values , publisher =. doi:10.1177/0162243910377624 , issn =
-
[95]
Braun, Virginia and Clarke, Victoria , title =
-
[96]
2019 International Conference on Document Analysis and Recognition (ICDAR) , pages=
Zhong, Xu and Tang, Jianbin and Jimeno Yepes, Antonio , booktitle =. doi:10.1109/ICDAR.2019.00166 , pages =
-
[97]
Learning Transferable Visual Models From Natural Language Supervision , editor =
Radford, Alec and Kim, Jong Wook and Hallacy, Chris and Ramesh, Aditya and Goh, Gabriel and Agarwal, Sandhini and Sastry, Girish and Askell, Amanda and Mishkin, Pamela and Clark, Jack and Krueger, Gretchen and Sutskever, Ilya , booktitle =. Learning Transferable Visual Models From Natural Language Supervision , editor =
-
[98]
Jobin, K. V. and Mondal, Ajoy and Jawahar, C. V. , booktitle =. doi:10.1109/ICDARW.2019.00018 , pages =
-
[99]
Lee , booktitle =
Karishma, Zeba and Rohatgi, Shaurya and Puranik, Kavya Shrinivas and Wu, Jian and Giles, C. Lee , booktitle =
-
[100]
Bai, Shuai and Cai, Yuxuan and Chen, Ruizhe and Chen, Keqin and Chen, Xionghui and Cheng, Zesen and Deng, Lianghao and Ding, Wei and Gao, Chang and Ge, Chunjiang and Ge, Wenbin and Guo, Zhifang and Huang, Qidong and Huang, Jie and Huang, Fei and Hui, Binyuan and Jiang, Shutong and Li, Zhaohai and Li, Mingsheng and Li, Mei and Li, Kaixin and Lin, Zicheng a...
work page internal anchor Pith review Pith/arXiv arXiv doi:10.48550/arxiv.2511.21631 2025
-
[101]
, title =
Fogel, Robert William and Engerman, Stanley L. , title =
-
[102]
Historical Methods: A Journal of Quantitative and Interdisciplinary History , keywords =
Geocoding and Mapping Historical Census Data: The Geographical Component of the. Historical Methods: A Journal of Quantitative and Interdisciplinary History , keywords =. doi:10.3200/HMTS.40.2.76-91 , issn =
-
[103]
Burke, Peter , title =
-
[104]
Proceedings of the IEEE VIS Workshop on Visualization for the Digital Humanities , title =
Lamqaddam, Houda and Brosens, Koenraad and Truyen, Frederik and Beerens, Jos and. Proceedings of the IEEE VIS Workshop on Visualization for the Digital Humanities , title =
-
[105]
doi:10.1609/icwsm.v3i1.13937 , pages =
Bastian, Mathieu and Heymann, Sebastien and Jacomy, Mathieu , booktitle =. doi:10.1609/icwsm.v3i1.13937 , pages =
-
[106]
doi:10.5281/zenodo.19401570 , urldate =
Dawson, Nyall and Fischer, J. doi:10.5281/zenodo.19401570 , urldate =
discussion (0)
Sign in with ORCID, Apple, or X to comment. Anyone can read and Pith papers without signing in.