Recognition: 1 theorem link
NeuroViz: Real-time Interactive Visualization of Forward and Backward Passes in Neural Network Training
Pith reviewed 2026-05-08 19:25 UTC · model grok-4.3
The pith
NeuroViz enables real-time interactive visualization of forward and backward passes during neural network training to improve interpretability.
A machine-rendered reading of the paper's core claim, the machinery that carries it, and where it could break.
Core claim
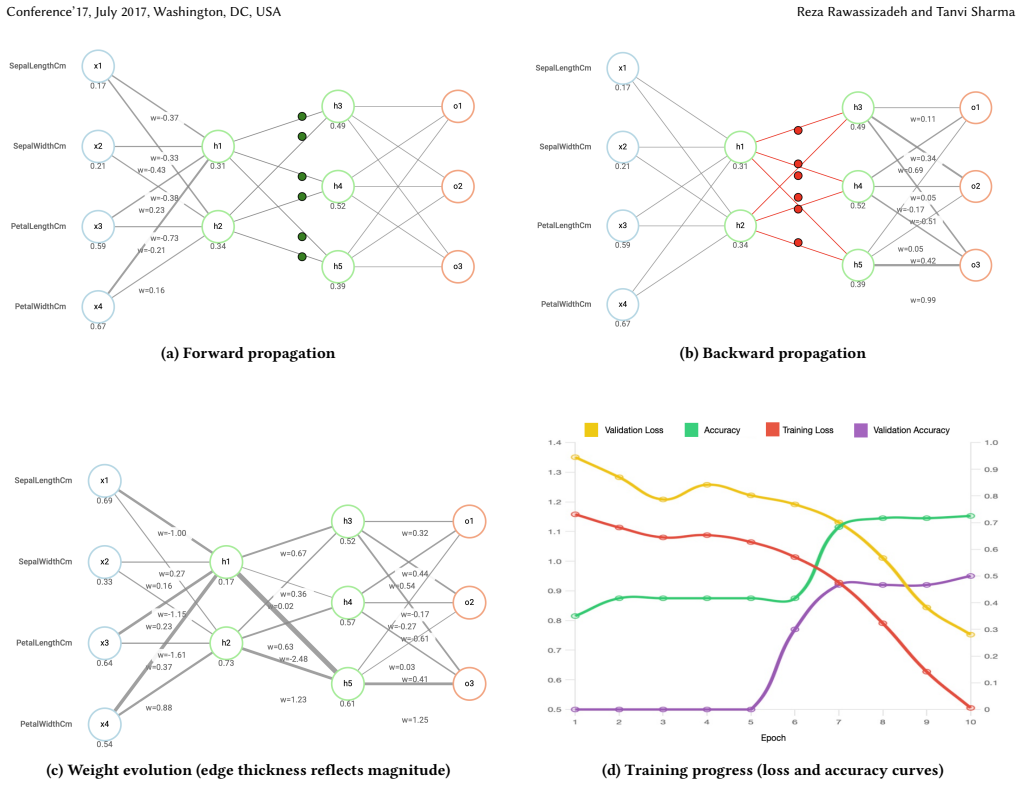
NeuroViz is an interactive visualization tool that supports real-time exploration of fully connected neural network training by visualizing weight changes in direct correspondence with activation signals in both forward and backward passes, enabling users to distinguish pre- and post-update states within individual epochs and view dynamically updating per-neuron equations.
What carries the argument
Real-time interactive display of forward and backward passes that maps activation signals directly to weight updates while showing pre/post-update states and live per-neuron equations.
If this is right
- Users can observe how specific activation signals drive particular weight adjustments during each training step.
- Pre-update and post-update network states become distinguishable within the same epoch.
- Live configuration of architecture, activation functions, learning rates, and datasets produces immediate visual feedback on training dynamics.
- Perceptions of neural network training transparency increase for the majority of users according to the reported study.
Where Pith is reading between the lines
- The visualization approach could support debugging by surfacing unexpected activation-to-weight relationships that are hard to spot in code.
- Extending the same live mapping to convolutional or recurrent layers would test whether the core insight generalizes beyond fully connected networks.
- Adding objective tests of users' ability to forecast loss curves or diagnose issues would provide stronger evidence than perceived transparency alone.
Load-bearing premise
A user study with 31 participants comparing NeuroViz to six other tools is assumed to supply sufficient evidence of superior clarity and usefulness without full details on study design, biases, or objective learning gains.
What would settle it
A follow-up experiment in which participants show no measurable improvement in explaining or predicting network behavior after using NeuroViz versus the compared tools.
Figures


read the original abstract
Training neural networks is difficult to interpret, particularly for newcomers. We introduce NeuroViz, an interactive visualization tool that supports real-time exploration of fully connected neural network training. Users can configure network architecture, activation functions, learning rates, and datasets, then observe activations, weight updates, and loss progression. NeuroViz visualizes weight changes in direct correspondence with activation signals in both forward and backward passes, enabling users to distinguish pre- and post-update states within individual epochs and view dynamically updating per-neuron equations. We conduct a comparative user study with 31 participants against six established visualization tools and we achieved the highest usability score (SUS 80.97, in the 'excellent' range), with mean rankings of 2.47 for clarity and 2.23 for usefulness (lower is better). Over 70% of participants reported that the visualizations substantially increased their perception of neural network training transparency. The implemented instance is accessible at https://neuroviz.org.
Editorial analysis
A structured set of objections, weighed in public.
Referee Report
Summary. The manuscript introduces NeuroViz, an interactive visualization tool for real-time exploration of fully connected neural network training. It enables configuration of architecture, activations, learning rates, and datasets, with visualizations of activations, weight updates, loss curves, forward/backward pass correspondences, pre/post-update states per epoch, and dynamically updating per-neuron equations. A comparative user study with 31 participants against six other tools reports the highest SUS score of 80.97 (excellent range), mean rankings of 2.47 for clarity and 2.23 for usefulness, and over 70% of participants reporting substantially increased perception of training transparency. The tool is publicly available at https://neuroviz.org.
Significance. If the evaluation holds, NeuroViz offers a practical, accessible resource for improving interpretability of NN training dynamics, particularly for educational use with newcomers. The open implementation and focus on linking weight changes directly to activation signals in both passes represent a concrete contribution to visualization tools in ML. The reported SUS score and participant feedback provide initial evidence of usability, though the broader impact depends on whether the visualizations deliver objective gains in understanding beyond self-reports.
major comments (2)
- [User Study] User Study section: The comparative evaluation with 31 participants reports SUS 80.97 and >70% reporting increased transparency, but provides no details on task design (e.g., specific exercises on forward/backward passes or weight updates), counterbalancing of tool order, blinding, objective outcome measures (such as pre/post concept quizzes or error-identification tasks), or adjustments for multiple comparisons. This is load-bearing for the superiority claim, as subjective perceptions alone cannot distinguish genuine insight gains from novelty or polish effects.
- [Abstract] Abstract and Evaluation: The headline usability metrics rest on a study whose protocol is not described sufficiently to evaluate controls or generalizability, directly limiting support for the claim that NeuroViz substantially increases perception of neural network training transparency compared to existing tools.
minor comments (2)
- The manuscript would benefit from additional screenshots or figures explicitly showing the dynamic per-neuron equations and pre/post-update state distinctions to illustrate the core visualization features more concretely.
- Consider adding a brief discussion of limitations, such as restriction to fully connected networks or potential scalability issues with larger architectures.
Simulated Author's Rebuttal
We thank the referee for the constructive and detailed feedback on our manuscript. We have revised the paper to address the concerns about the user study by expanding the methodological description. Our point-by-point responses to the major comments follow.
read point-by-point responses
-
Referee: [User Study] User Study section: The comparative evaluation with 31 participants reports SUS 80.97 and >70% reporting increased transparency, but provides no details on task design (e.g., specific exercises on forward/backward passes or weight updates), counterbalancing of tool order, blinding, objective outcome measures (such as pre/post concept quizzes or error-identification tasks), or adjustments for multiple comparisons. This is load-bearing for the superiority claim, as subjective perceptions alone cannot distinguish genuine insight gains from novelty or polish effects.
Authors: We agree that the original User Study section lacked sufficient methodological detail. In the revised manuscript we have expanded this section to describe the task design (participants performed specific exercises involving network configuration, observation of forward/backward passes, weight updates, and loss curves), the within-subjects design with counterbalancing of tool presentation order, and the fact that full blinding was not feasible given the interactive tools (though participants were not informed of hypotheses). The evaluation relied on standard subjective usability instruments (SUS, rankings, and self-reported transparency gains); we have added an explicit limitations paragraph noting the absence of objective measures such as pre/post quizzes and identifying this as future work. No multiple-comparison corrections were applied because the primary analyses were descriptive. These additions clarify the protocol and scope of the claims without altering the reported results. revision: yes
-
Referee: [Abstract] Abstract and Evaluation: The headline usability metrics rest on a study whose protocol is not described sufficiently to evaluate controls or generalizability, directly limiting support for the claim that NeuroViz substantially increases perception of neural network training transparency compared to existing tools.
Authors: We have revised the abstract to qualify the usability claims as arising from self-reported perceptions and to reference the expanded Evaluation section for protocol details. The revised text now makes clear that the transparency increase is participant-reported rather than objectively measured, thereby aligning the abstract with the limitations acknowledged in the main body. revision: yes
Circularity Check
No circularity: paper is tool description plus empirical user study with no derivations or self-referential predictions
full rationale
The paper introduces NeuroViz as an interactive visualization tool for neural network training and reports usability results from a 31-participant comparative study. No mathematical derivations, equations, parameter fitting, or first-principles predictions are present in the abstract or described claims. The central results (SUS score, rankings, participant reports) are presented as direct empirical outcomes from the study rather than outputs derived from the tool's own inputs or prior self-citations. No load-bearing steps reduce to self-definition, fitted inputs renamed as predictions, or uniqueness theorems imported from the authors' prior work. The paper is therefore self-contained with no circular reasoning in its derivation chain.
Axiom & Free-Parameter Ledger
Reference graph
Works this paper leans on
-
[1]
Aaron Bangor, Philip Kortum, and James Miller. 2009. Determining what indi- vidual SUS scores mean: Adding an adjective rating scale.Journal of Usability Studies4, 3 (2009), 114–123
2009
-
[2]
2006.Pattern Recognition and Machine Learning
Christopher Bishop. 2006.Pattern Recognition and Machine Learning. Springer
2006
-
[3]
Virginia Braun and Victoria Clarke. 2006. Using thematic analysis in psychology. Qualitative Research in Psychology3, 2 (2006), 77–101
2006
-
[4]
quick and dirty
John Brooke. 1996. SUS: A “quick and dirty” usability scale. InUsability Evaluation in Industry, Patrick W. Jordan, Bruce Thomas, Ian L. McClelland, and Bernard Weerdmeester (Eds.). Taylor & Francis, 189–194
1996
-
[5]
Brendan Bycroft. 2024. LLM Visualization. https://bbycroft.net/llm. Interactive visualization of transformer-based large language models
2024
-
[6]
Dylan Cashman, Genevieve Patterson, Abigail Mosca, Nathan Watts, Shannon Robinson, and Remco Chang. 2018. RNNbow: Visualizing Learning via Back- propagation Gradients in Recurrent Neural Networks.IEEE Computer Graphics and Applications(2018). https://doi.org/10.1109/MCG.2018.2878902
-
[7]
Davide Castelvecchi. 2016. Can we open the black box of AI?Nature(2016)
2016
-
[8]
1988.Statistical Power Analysis for the Behavioral Sciences(2 ed.)
Jacob Cohen. 1988.Statistical Power Analysis for the Behavioral Sciences(2 ed.). Lawrence Erlbaum Associates
1988
-
[9]
Jacob Devlin et al. 2019. BERT: Pre-training of deep bidirectional transformers for language understanding.NAACL(2019)
2019
-
[10]
Finale Doshi-Velez and Been Kim. 2017. Towards a rigorous science of inter- pretable machine learning.arXiv preprint arXiv:1702.08608(2017)
work page internal anchor Pith review arXiv 2017
-
[11]
Milton Friedman. 1937. The use of ranks to avoid the assumption of normality implicit in the analysis of variance.J. Amer. Statist. Assoc.32, 200 (1937), 675–701
1937
-
[12]
2016.Deep Learning
Ian Goodfellow, Yoshua Bengio, and Aaron Courville. 2016.Deep Learning. MIT Press
2016
-
[13]
Ian J Goodfellow, Jean Pouget-Abadie, Mehdi Mirza, Bing Xu, David Warde-Farley, Sherjil Ozair, Aaron Courville, and Yoshua Bengio. 2014. Generative adversarial nets.Advances in neural information processing systems27 (2014)
2014
-
[14]
Google Brain Team. 2016. TensorFlow Playground. https://playground.tensorflow. org/. Accessed: July 2025
2016
-
[15]
Hart and Lowell E
Sandra G. Hart and Lowell E. Staveland. 1988. Development of NASA-TLX (Task Load Index): Results of empirical and theoretical research. InAdvances in Psychology. Vol. 52. Elsevier, 139–183
1988
-
[16]
Kaiming He et al. 2016. Deep residual learning for image recognition. InCVPR
2016
-
[17]
Fred Hohman, Minsuk Kahng, Robert Pienta, and Duen Horng Chau. 2019. Visual Analytics in Deep Learning: An Interrogative Survey for the Next Frontiers.IEEE Transactions on Visualization and Computer Graphics25, 8 (2019), 2674–2693. https://doi.org/10.1109/TVCG.2018.2843369
- [18]
-
[19]
Bisantz, and Colin G
Jiun-Yin Jian, Ann M. Bisantz, and Colin G. Drury. 2000. Foundations for an empirically determined scale of trust in automated systems.International Journal of Cognitive Ergonomics4, 1 (2000), 53–71
2000
-
[20]
Minsuk Kahng, Abigail Andrews, Anuja Kalro, and Duen Horng Chau. 2017. ActiVis: Visual Exploration of Industry-Scale Deep Neural Network Models. In IEEE Transactions on Visualization and Computer Graphics. 1–10
2017
-
[21]
Alex Krizhevsky, Ilya Sutskever, and Geoffrey Hinton. 2012. ImageNet classifica- tion with deep convolutional neural networks. InNeurIPS
2012
-
[22]
2017.Research Methods in Human-Computer Interaction
Jonathan Lazar, Jinjuan Heidi Feng, and Harry Hochheiser. 2017.Research Methods in Human-Computer Interaction. Morgan Kaufmann
2017
-
[23]
Yann LeCun, Yoshua Bengio, and Geoffrey Hinton. 2015. Deep learning.Nature (2015)
2015
-
[24]
Yann LeCun, Bernhard Boser, John S Denker, Donnie Henderson, Richard E Howard, Wayne Hubbard, and Lawrence D Jackel. 1989. Backpropagation applied to handwritten zip code recognition.Neural computation1, 4 (1989), 541–551
1989
-
[25]
Lee and Katrina A
John D. Lee and Katrina A. See. 2004. Trust in automation: Designing for appro- priate reliance.Human Factors46, 1 (2004), 50–80
2004
-
[26]
Rensis Likert. 1932. A Technique for the Measurement of Attitudes.Archives of Psychology22, 140 (1932), 1–55
1932
-
[27]
Zachary Lipton. 2018. The mythos of model interpretability.Queue(2018)
2018
-
[28]
Lutz Roeder. 2022. Netron. https://netron.app/. Accessed: July 2025
2022
-
[29]
AlShami, and Jugal Kalita
Melkamu Mersha, Khang Lam, Joseph Wood, Ali K. AlShami, and Jugal Kalita
-
[30]
599(2024)
Explainable artificial intelligence: A survey of needs, techniques, ap- plications, and future direction.Neurocomputing vol. 599(2024). https: //www.sciencedirect.com/science/article/abs/pii/S0925231224008828
2024
-
[31]
Brent Mittelstadt et al. 2019. Explaining explanations in AI.FAT*(2019)
2019
-
[32]
Chris Olah et al. 2018. The building blocks of interpretability.Distill(2018)
2018
-
[33]
Chris Olah et al. 2020. Zoom In: An introduction to circuits.Distill(2020)
2020
-
[34]
Chris Olah, Alexander Mordvintsev, and Ludwig Schubert. 2017. Feature Visual- ization.Distill2, 11 (2017). https://doi.org/10.23915/distill.00007
-
[35]
Polo Club of Data Science. 2018. GAN Lab. https://poloclub.github.io/ganlab/. Accessed: July 2025
2018
-
[36]
Polo Club of Data Science. 2020. CNN Explainer. https://poloclub.github.io/cnn- explainer/. Accessed: July 2025
2020
-
[37]
Polo Club of Data Science. 2023. Transformer Explainer: Interactive Visualiza- tion of Transformer Models. https://poloclub.github.io/transformer-explainer/. Accessed: 2026-02-10
2023
-
[38]
Rauber, Samuel G
Paulo E. Rauber, Samuel G. Fadel, Alexandre X. Falcão, and Alexandru C. Telea
-
[39]
https: //doi.org/10.1109/TVCG.2016.2598838
Visualizing the Hidden Activity of Artificial Neural Networks.IEEE Transactions on Visualization and Computer Graphics23, 1 (2017), 101–110. https: //doi.org/10.1109/TVCG.2016.2598838
-
[40]
2025.Machine learning and artificial intelligence: concepts, algorithms and models
Reza Rawassizadeh. 2025.Machine learning and artificial intelligence: concepts, algorithms and models. Reza Rawassizadeh
2025
-
[41]
Jürgen Schmidhuber. 2015. Deep learning in neural networks: An overview. Neural Networks(2015)
2015
-
[42]
Ben Shneiderman. 1996. The Eyes Have It: A Task by Data Type Taxonomy for Information Visualizations. InProceedings of the IEEE Symposium on Visual Languages. IEEE, 336–343
1996
-
[43]
Hendrik Strobelt, Sebastian Gehrmann, Hanspeter Pfister, and Alexander M. Rush. 2018. LSTMVis: A Tool for Visual Analysis of Hidden State Dynamics in Recurrent Neural Networks.IEEE Transactions on Visualization and Computer Graphics24, 1 (2018), 667–676. https://doi.org/10.1109/TVCG.2017.2744158
-
[44]
John Sweller. 1994. Cognitive load theory, learning difficulty, and instructional design.Learning and Instruction4, 4 (1994), 295–312
1994
-
[45]
Ashish Vaswani et al. 2017. Attention is all you need. InNeurIPS
2017
-
[46]
Junpeng Wang, Liang Gou, Hao Yang, and Han-Wei Shen. 2018. GANViz: A Visual Analytics Approach to Understand the Adversarial Game.IEEE Transactions on Visualization and Computer Graphics24, 6 (2018), 1905–1917
2018
-
[47]
Frank Wilcoxon. 1945. Individual comparisons by ranking methods.Biometrics Bulletin1, 6 (1945), 80–83
1945
-
[48]
Viégas, and Martin Wattenberg
Kanit Wongsuphasawat, Daniel Smilkov, James Wexler, Jimbo Wilson, Dandelion Mané, Doug Fritz, Dilip Krishnan, Fernanda B. Viégas, and Martin Wattenberg
-
[49]
IEEE Transactions on Visualization and Computer Graphics24, 1 (2018), 1–12
Visualizing Dataflow Graphs of Deep Learning Models in TensorFlow. IEEE Transactions on Visualization and Computer Graphics24, 1 (2018), 1–12. https://doi.org/10.1109/TVCG.2017.2744878
-
[50]
Wenli Yang, Yuchen Wei, Hanyu Wei, Yanyu Chen, Guan Huang, Xiang Li, Ren- jie Li, Naimeng Yao, Xinyi Wang, Xiaotong Gu, Muhammad Bilal Amin, and Byeong Kang. 2023. Survey on Explainable AI: From Approaches, Limitations and Applications Aspects.Human-Centric Intelligent Systems3 (2023), 161–188. https://doi.org/10.1007/s44230-023-00038-y
- [51]
discussion (0)
Sign in with ORCID, Apple, or X to comment. Anyone can read and Pith papers without signing in.