Recognition: unknown
Systematic Spectral Distortion from Digital Whitening in Radio Telescopes and Implications for 21 cm Cosmology
Pith reviewed 2026-05-08 15:35 UTC · model grok-4.3
The pith
Digital whitening of radio signals followed by re-quantization introduces systematic spectral distortions at levels problematic for 21 cm cosmology.
A machine-rendered reading of the paper's core claim, the machinery that carries it, and where it could break.
Core claim
The central claim is that the whitening-plus-re-quantization sequence, routinely used to enable efficient low-bit processing of wideband radio signals, creates a systematic distortion in the telescope's gain-versus-frequency response. This distortion is visible in OVRO-LWA observations and reproduced in simulations; it reaches levels that compromise the spectral precision required for 21 cm cosmology while remaining small enough for most other applications.
What carries the argument
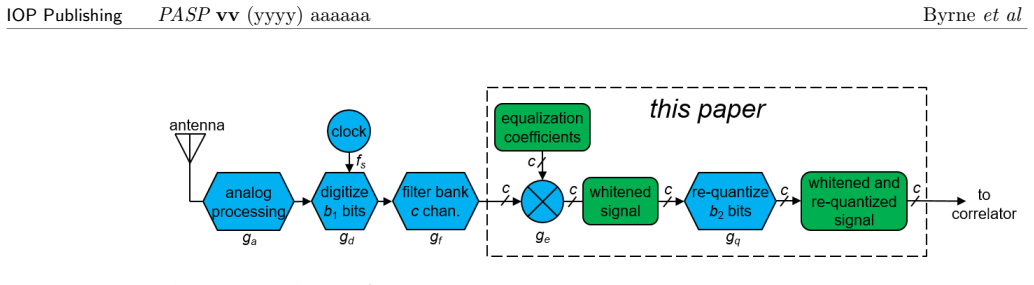
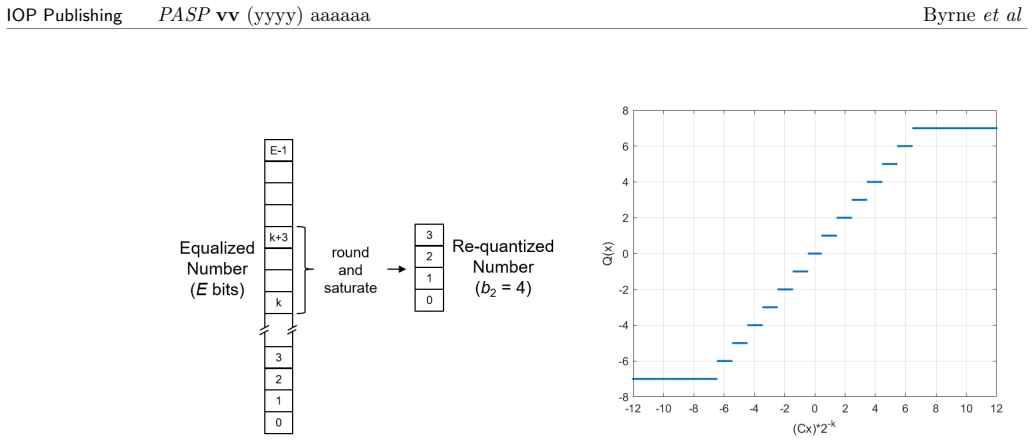
The whitening-plus-re-quantization sequence, which flattens signal power across frequency to fit within a limited number of bits and then re-quantizes the channelized data.
If this is right
- Precision spectral experiments such as 21 cm cosmology must either correct for or avoid the whitening-induced distortion in their data pipelines.
- Choosing a different gain distribution along the analog and digital signal path can substantially reduce the size of the distortion.
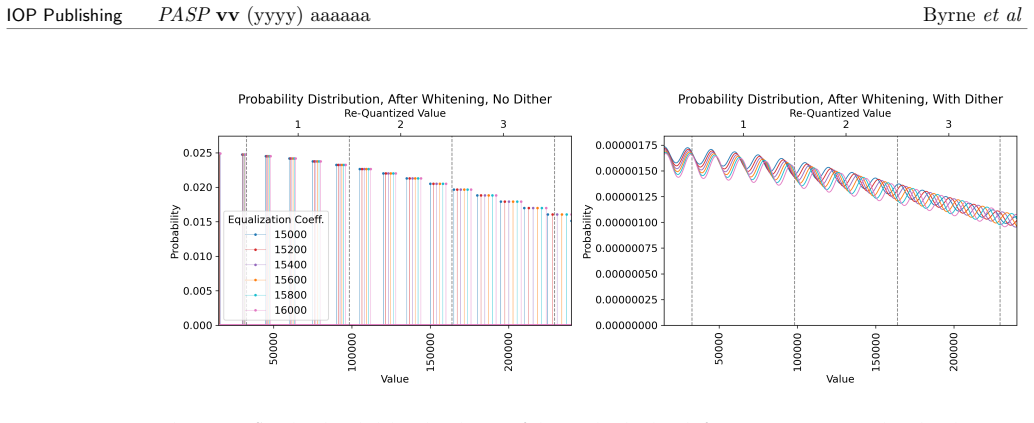
- Adding dithering noise before the re-quantization step further suppresses the systematic error.
- Any telescope using similar wideband digital processing may carry unrecognized spectral artifacts that affect faint-signal science.
- Calibration strategies that assume a smooth instrumental response will need to incorporate this effect to reach the required accuracy.
Where Pith is reading between the lines
- The same processing sequence could introduce comparable artifacts in other radio-astronomy domains that rely on accurate broad-band spectra, such as fast radio burst studies or spectral-line surveys.
- Future instrument designs could embed dithering hardware at the re-quantization stage to eliminate the distortion at the source rather than correcting it later.
- The effect may interact with existing calibration models, suggesting that joint fitting of whitening parameters with other instrumental terms could improve overall data fidelity.
Load-bearing premise
The distortion measured in OVRO-LWA data and simulations is caused specifically by the whitening and re-quantization steps rather than by unrelated instrumental or environmental effects.
What would settle it
High-precision spectral measurements taken with the whitening step deliberately disabled or bypassed, compared directly against the same observations processed through the standard whitening-plus-re-quantization chain, would show whether the distortion disappears.
Figures


read the original abstract
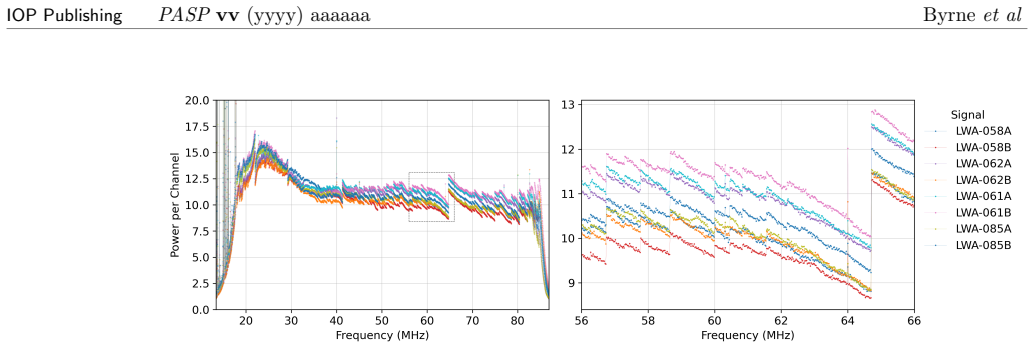
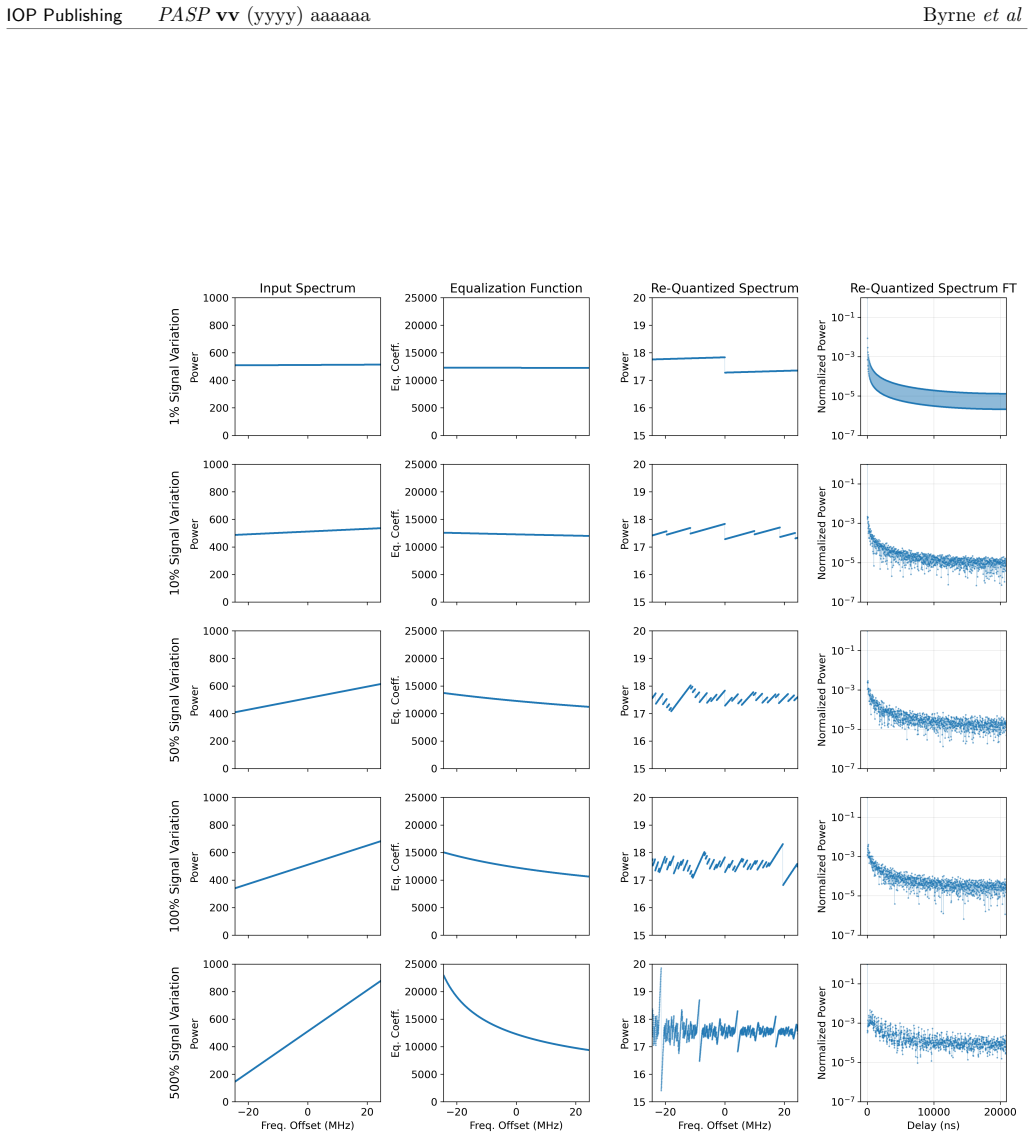
We identify a systematic distortion of the gain-vs.-frequency function of radio telescopes caused by digital flattening ("whitening") of the signal's spectrum followed by re-quantization, a common pair of processes in the signal processing of modern telescopes. Wide-bandwidth telescopes often have a large variation of signal power over frequency. Flattening of the spectrum allows samples of the channelized signal to be represented in a small number of bits, allowing efficient downstream processing. However, we show that this produces subtle systematic error in the measured spectra. We explore this effect in data from the Owens Valley Radio Observatory's Long Wavelength Array (OVRO-LWA) and through detailed semi-analytic simulations. Although the effect can be small so that it has heretofore been unrecognized, we demonstrate that it produces distortion of the spectrum at a level that is problematic for some science, in particular 21 cm cosmology. Finally, we explore mitigation strategies, showing that the effect can be substantially reduced by careful choice of the gain distribution along the signal path or by incorporating dithering in the re-quantization step.
Editorial analysis
A structured set of objections, weighed in public.
Referee Report
Summary. The paper claims that digital whitening (spectral flattening) followed by re-quantization, a common processing step in wide-bandwidth radio telescopes, introduces a subtle but systematic distortion in the measured gain-vs-frequency response. This is demonstrated via OVRO-LWA observations and semi-analytic simulations; the distortion is shown to reach levels problematic for 21 cm cosmology, and mitigation via gain distribution choices or dithering is explored.
Significance. If the attribution holds, the result is significant for precision 21 cm cosmology because it identifies a previously unrecognized instrumental systematic capable of producing spectral structure at levels that can contaminate the cosmological signal. The combination of real telescope data with semi-analytic modeling and the explicit discussion of mitigations constitute a practical contribution to instrument design and data analysis in the field.
major comments (2)
- [§4] §4 (OVRO-LWA data analysis): the observed spectral distortion is attributed to the whitening-plus-re-quantization sequence, yet the manuscript does not present a control dataset acquired with whitening bypassed under otherwise identical conditions; without this isolation, contributions from analog front-end variations, calibration residuals, or environmental effects cannot be ruled out at the required level.
- [§3] §3 (semi-analytic simulations): the model is constructed to embed the whitening and re-quantization steps, so agreement with the OVRO-LWA data demonstrates consistency but does not independently falsify alternative origins; an explicit quantitative error budget comparing predicted versus observed distortion amplitudes (including residual mismatch after mitigation) is needed to establish the mechanism as load-bearing.
minor comments (2)
- Figure captions and axis labels should explicitly state the distortion amplitude in units directly comparable to the expected 21 cm signal (e.g., mK or fractional power) to aid readers in assessing impact.
- The abstract states the effect 'can be small so that it has heretofore been unrecognized'; a brief literature search or citation to prior 21 cm analyses that may have been affected would strengthen context.
Simulated Author's Rebuttal
We thank the referee for their careful and constructive review of our manuscript. The comments highlight important aspects of evidence presentation that we address point by point below. We have revised the manuscript accordingly where feasible.
read point-by-point responses
-
Referee: [§4] §4 (OVRO-LWA data analysis): the observed spectral distortion is attributed to the whitening-plus-re-quantization sequence, yet the manuscript does not present a control dataset acquired with whitening bypassed under otherwise identical conditions; without this isolation, contributions from analog front-end variations, calibration residuals, or environmental effects cannot be ruled out at the required level.
Authors: We agree that a direct control dataset with whitening disabled would offer the cleanest isolation. However, the OVRO-LWA digital signal processing chain is hard-wired to apply whitening as a standard step for dynamic-range management, and obtaining an otherwise identical control dataset would require non-trivial hardware reconfiguration that was not available during the observations. The semi-analytic simulations isolate the whitening-plus-re-quantization sequence by design and reproduce both the amplitude and spectral shape of the observed distortion. In the revised manuscript we will expand §4 with a dedicated discussion of alternative origins (analog gain ripples, calibration residuals, and environmental effects), showing that none reproduce the specific frequency-dependent structure seen in the data at the observed level. revision: partial
-
Referee: [§3] §3 (semi-analytic simulations): the model is constructed to embed the whitening and re-quantization steps, so agreement with the OVRO-LWA data demonstrates consistency but does not independently falsify alternative origins; an explicit quantitative error budget comparing predicted versus observed distortion amplitudes (including residual mismatch after mitigation) is needed to establish the mechanism as load-bearing.
Authors: We accept that a quantitative error budget is required to strengthen the attribution. The revised manuscript will add this analysis to §3, reporting (i) the distortion amplitude predicted by the semi-analytic model, (ii) the amplitude measured in the OVRO-LWA data, (iii) the residual mismatch after each mitigation strategy, and (iv) a direct comparison of how well alternative mechanisms (e.g., analog front-end variations) would match the observed frequency dependence. This will include numerical metrics such as amplitude ratios and goodness-of-fit measures to demonstrate that the whitening model provides the best quantitative description. revision: yes
Circularity Check
No circularity; empirical demonstration and simulations are independent of the target claim
full rationale
The paper identifies a spectral distortion mechanism via direct OVRO-LWA observations and semi-analytic modeling of the whitening-plus-re-quantization chain. No step reduces a claimed prediction or first-principles result to its own inputs by definition, fitted parameter, or self-citation chain. The simulations implement the physical model under test rather than presupposing the measured distortion; comparison to real data therefore constitutes external validation, not tautology. The central attribution is presented as an empirical finding open to alternative explanations, with no load-bearing uniqueness theorem or ansatz imported from prior author work. This is the normal case of a self-contained instrumental analysis.
Axiom & Free-Parameter Ledger
axioms (1)
- domain assumption Wide-bandwidth radio telescopes commonly flatten the signal spectrum before re-quantization to enable efficient low-bit sampling.
Reference graph
Works this paper leans on
-
[1]
Abdurashidova, Z., Aguirre, J. E., Alexander, P., et al. 2022, HERA Phase I Limits on the Cosmic 21 Cm Signal: Constraints on Astrophysics and Cosmology during the Epoch of Reionization, The Astrophysical Journal, 924, 51, doi:10.3847/1538-4357/ac2ffc
-
[2]
Acedo, E. d. L., Trott, C. M., Wayth, R. B., et al. 2017, Spectral Performance of SKA Log-periodic Antennas I: Mitigating Spectral Artefacts in SKA1-LOW 21-Cm Cosmology Experiments, Monthly Notices of the Royal Astronomical Society, 469, 2662, doi:10.1093/mnras/stx904
-
[3]
Anderson, M. M., Hallinan, G., Eastwood, M. W., et al. 2019, New Limits on the Low-frequency Radio Transient Sky Using 31 Hr of All-sky Data with the OVRO–LWA, The Astrophysical Journal, 886, 123, doi:10.3847/1538-4357/ab4f87
-
[4]
Barry, N., Hazelton, B., Sullivan, I., Morales, M. F., & Pober, J. C. 2016, Calibration Requirements for Detecting the 21 Cm Epoch of Reionization Power Spectrum and Implications for the SKA, Monthly Notices of the Royal Astronomical Society, doi:10.1093/mnras/stw1380
-
[5]
Barry, N., Wilensky, M., Trott, C. M., et al. 2019, Improving the Epoch of Reionization Power Spectrum Results from Murchison Widefield Array Season 1 Observations, The Astrophysical Journal, 884, 1, doi:10.3847/1538-4357/ab40a8
-
[6]
Byrne, R. 2023, Delay-Weighted Calibration: Precision Calibration for 21 Cm Cosmology with Resilience to Sky Model Error, Astrophysical Journal, 943, 117, doi:10.3847/1538-4357/acac95
-
[7]
Byrne, R., Morales, M. F., Hazelton, B., et al. 2021a, A Map of Diffuse Radio Emission at 182 MHz to Enhance Epoch of Reionization Observations in the Southern Hemisphere, Monthly Notices of the Royal Astronomical Society, 510, 2011, doi:10.1093/mnras/stab3276
-
[8]
Byrne, R., Morales, M. F., Hazelton, B. J., & Wilensky, M. 2021b, A Unified Calibration Framework for 21 Cm Cosmology, Monthly Notices of the Royal Astronomical Society, 503, 2457, doi:10.1093/mnras/stab647
-
[9]
Carroll, P. A., Line, J., Morales, M. F., et al. 2016, A High Reliability Survey of Discrete Epoch of Reionization Foreground Sources in the MWA EoR0 Field, Monthly Notices of the Royal Astronomical Society, doi:10.1093/mnras/stw1599
-
[10]
E., & Rabiner, L
Crochiere, R. E., & Rabiner, L. R. 1983, Multirate Digital Signal Processing, 1st edn. (Prentice-Hall)
1983
-
[11]
Cumner, J., Acedo, E. D. L., de Villiers, D. I. L., et al. 2023, Radio Antenna Design for Sky-averaged 21 Cm Cosmology Experiments: The REACH Case, arXiv, doi:10.48550/arXiv.2109.10098 D’Addario, L. R., & Wang, D. 2016, An Integrated Circuit for Radio Astronomy Correlators Supporting Large Arrays of Antennas, Journal of Astronomical Instrumentation, 5, 16...
-
[12]
Dillon, J. S., Kohn, S. A., Parsons, A. R., et al. 2018, Polarized Redundant-Baseline Calibration for 21 Cm Cosmology Without Adding Spectral Structure, Monthly Notices of the Royal Astronomical Society, 12, 1, doi:10.1093/mnras/sty1060 16 IOP PublishingPASPvv(yyyy) aaaaaa Byrneet al
-
[13]
Dillon, J. S., Lee, M., Ali, Z. S., et al. 2020, Redundant-Baseline Calibration of the Hydrogen Epoch of Reionization Array, Monthly Notices of the Royal Astronomical Society, 499, 5840, doi:10.1093/mnras/staa3001
-
[14]
Eastwood, M. W., Anderson, M. M., Monroe, R. M., et al. 2018, The Radio Sky at Meter Wavelengths: M-Mode Analysis Imaging with the OVRO-LWA, The Astronomical Journal, 156, 32, doi:10.3847/1538-3881/aac721
-
[15]
Eastwood, M. W., Anderson, M. M., Monroe, R. M., et al. 2019, The 21 Cm Power Spectrum from the Cosmic Dawn: First Results from the OVRO-LWA, The Astronomical Journal, 158, 84, doi:10.3847/1538-3881/ab2629
-
[16]
Ewall-Wice, A., Dillon, J. S., Gehlot, B., et al. 2022, Precision Calibration of Radio Interferometers for 21 Cm Cosmology with No Redundancy and Little Knowledge of Antenna Beams and the Radio Sky, The Astrophysical Journal, 938, 151, doi:10.3847/1538-4357/ac87b3
-
[17]
R., et al
Fagnoni, N., de Lera Acedo, E., DeBoer, D. R., et al. 2020, Understanding the HERA Phase I Receiver System with Simulations and Its Impact on the Detectability of the EoR Delay Power
2020
-
[18]
Spectrum, Monthly Notices of the Royal Astronomical Society, 500, 1232, doi:10.1093/mnras/staa3268
-
[19]
Furlanetto, S. R., Peng Oh, S., & Briggs, F. H. 2006, Cosmology at Low Frequencies: The 21 Cm Transition and the High-redshift Universe, Physics Reports, 433, 181, doi:10.1016/j.physrep.2006.08.002
-
[20]
Grobler, T. L., Bernardi, G., Kenyon, J. S., Parsons, A. R., & Smirnov, O. M. 2018, Redundant Interferometric Calibration as a Complex Optimization Problem, Monthly Notices of the Royal Astronomical Society, 476, 2410, doi:10.1093/mnras/sty357
-
[21]
Gustafsson, F., & Karlsson, R. 2013, Generating Dithering Noise for Maximum Likelihood Estimation from Quantized Data, Automatica, 49, 554, doi:10.1016/j.automatica.2012.11.028
-
[22]
The DSA-2000 -- A Radio Survey Camera
Hallinan, G., Ravi, V., Weinreb, S., et al. 2019, The DSA-2000 – A Radio Survey Camera, arXiv, doi:10.48550/arXiv.1907.07648
work page internal anchor Pith review doi:10.48550/arxiv.1907.07648 2019
-
[23]
2025, First Results from HERA Phase II, arXiv e-prints
HERA, Abdurashidova, Z., Adams, T., et al. 2025, First Results from HERA Phase II, arXiv e-prints
2025
-
[24]
J., Barsdell, B
Kocz, J., Greenhill, L. J., Barsdell, B. R., et al. 2014, A Scalable Hybrid FPGA/GPU FX
2014
-
[25]
Correlator, Journal of Astronomical Instrumentation, 03, 1450002, doi:10.1142/S2251171714500020
-
[26]
1992, Quantization and Dither: A Theoretical
Lipshitz, S., Wannamaker, R., & Vanderkooy, J. 1992, Quantization and Dither: A Theoretical
1992
-
[27]
Liu, A., & Shaw, J. R. 2020, Data Analysis for Precision 21 Cm Cosmology, Publications of the Astronomical Society of the Pacific, 132, 062001, doi:10.1088/1538-3873/ab5bfd
-
[28]
Liu, A., Tegmark, M., Morrison, S., Lutomirski, A., & Zaldarriaga, M. 2010, Precision Calibration of Radio Interferometers Using Redundant Baselines, Monthly Notices of the Royal Astronomical Society, 408, 1029, doi:10.1111/j.1365-2966.2010.17174.x
-
[29]
Lynch, C. R., Galvin, T. J., Line, J. L. B., et al. 2021, The MWA Long Baseline Epoch of Reionisation Survey—I. Improved Source Catalogue for the EoR 0 Field, Publications of the Astronomical Society of Australia, 38, e057, doi:10.1017/pasa.2021.50
-
[30]
F., Hazelton, B., Sullivan, I., & Beardsley, A
Morales, M. F., Hazelton, B., Sullivan, I., & Beardsley, A. 2012, Four Fundamental Foreground Power Spectrum Shapes for 21 Cm Cosmology Observations, The Astrophysical Journal, 752, 137, doi:10.1088/0004-637X/752/2/137
-
[31]
Morales, M. F., & Wyithe, J. S. B. 2010, Reionization and Cosmology with 21 Cm Fluctuations, Annual Review of Astronomy and Astrophysics, 48, doi:10.1146/annurev-astro-081309-130936 17 IOP PublishingPASPvv(yyyy) aaaaaa Byrneet al
-
[32]
S., Crosse, B., Sleap, G., et al
Morrison, I. S., Crosse, B., Sleap, G., et al. 2023, MWAX: A New Correlator for the Murchison Widefield Array, Publications of the Astronomical Society of Australia, 40, e019, doi:10.1017/pasa.2023.15
-
[33]
Offringa, A. R. 2016, Compression of Interferometric Radio-Astronomical Data, Astronomy & Astrophysics, 595, A99, doi:10.1051/0004-6361/201629565 O’Hara, O. S. D., Dulwich, F., de Lera Acedo, E., et al. 2024, Understanding Spectral Artefacts in SKA-Low 21-Cm Cosmology Experiments: The Impact of Cable Reflections, Monthly Notices of the Royal Astronomical ...
-
[34]
Parsons, A., Backer, D., Siemion, A., et al. 2008, A Scalable Correlator Architecture Based on Modular FPGA Hardware, Reuseable Gateware, and Data Packetization, Publications of the Astronomical Society of the Pacific, 120, 1207, doi:10.1086/593053
-
[35]
H., Yatawatta, S., Koopmans, L
Patil, A. H., Yatawatta, S., Koopmans, L. V. E., et al. 2017, Upper Limits on the 21-Cm Epoch of Reionization Power Spectrum from One Night with LOFAR, The Astrophysical Journal, 7, doi:10.3847/1538-4357/aa63e7
-
[36]
S., Roshi, D
Prabu, T., Srivani, K. S., Roshi, D. A., et al. 2015, A Digital-Receiver for the Murchison Widefield
2015
-
[37]
Array, Experimental Astronomy, 39, 73, doi:10.1007/s10686-015-9444-3
-
[38]
Pritchard, J. R., & Loeb, A. 2012, 21 Cm Cosmology in the 21st Century, Reports on Progress in Physics, 75, 86901, doi:10.1088/0034-4885/75/8/086901
-
[39]
Schuchman, L. 1964, Dither Signals and Their Effect on Quantization Noise, IEEE Transactions on Communication Technology, 12, 162, doi:10.1109/TCOM.1964.1088973
-
[40]
Selina, R. J., Murphy, E. J., McKinnon, M., et al. 2018, The Next Generation Very Large Array: A Technical Overview, arXiv, doi:10.48550/arXiv.1806.08405
-
[41]
Shimwell, T. W., R¨ ottgering, H. J. A., Best, P. N., et al. 2017, The LOFAR Two-metre Sky Survey - I. Survey Description and Preliminary Data Release, A&A, 598, A104, doi:10.1051/0004-6361/201629313
-
[42]
Sims, P. H., Pober, J. C., & Sievers, J. L. 2022, A Bayesian Approach to High Fidelity Interferometric Calibration I: Mathematical Formalism, Monthly Notices of the Royal Astronomical Society, 517, 910, doi:10.1093/mnras/stac1861
-
[43]
R., Moran, J
Thompson, A. R., Moran, J. M., & Jr., G. W. S. 2001, Interferometry and Synthesis in Radio Astronomy, 3rd edn. (Springer)
2001
-
[44]
Thyagarajan, N., Parsons, A. R., DeBoer, D. R., et al. 2016, Effects of Antenna Beam Chromaticity on Redshifted 21 Cm Power Spectrum and Implications for Hydrogen Epoch of Reionization Array, The Astrophysical Journal, 825, 9, doi:10.3847/0004-637X/825/1/9
-
[45]
Wagdy, M. 1989, Effect of Various Dither Forms on Quantization Errors of Ideal A/D Converters, IEEE Transactions on Instrumentation and Measurement, 38, 850, doi:10.1109/19.31003
-
[46]
Wagdy, M., & Goff, M. 1994, Linearizing Average Transfer Characteristics of Ideal ADC’s via Analog and Digital Dither, IEEE Transactions on Instrumentation and Measurement, 43, 146, doi:10.1109/19.293411
-
[47]
Wagdy, M., & Ng, W.-M. 1989, Validity of Uniform Quantization Error Model for Sinusoidal Signals Without and With Dither, IEEE Transactions on Instrumentation and Measurement, 38, 718, doi:10.1109/19.32180
-
[48]
2000, A Theory of Nonsubtractive
Wannamaker, R., Lipshitz, S., Vanderkooy, J., & Wright, J. 2000, A Theory of Nonsubtractive
2000
-
[49]
Dither, IEEE Transactions on Signal Processing, 48, 499, doi:10.1109/78.823976
-
[50]
2020, Fundamental Physics with the Square Kilometre
Weltman, A., Bull, P., Camera, S., et al. 2020, Fundamental Physics with the Square Kilometre
2020
-
[51]
Array, Publications of the Astronomical Society of Australia, 37, e002, doi:10.1017/pasa.2019.42
-
[52]
2010, Quantization Noise (Cambridge University Press), doi:10.1017/CBO9780511754661
Widrow, B., & Koll´ ar, I. 2010, Quantization Noise (Cambridge University Press), doi:10.1017/CBO9780511754661
-
[53]
Zames, G., & Shneydor, N. 1976, Dither in Nonlinear Systems, IEEE Transactions on Automatic Control, 21, 660, doi:10.1109/TAC.1976.1101357 18
discussion (0)
Sign in with ORCID, Apple, or X to comment. Anyone can read and Pith papers without signing in.