Recognition: unknown
Jovian Zonal Winds Revealed from Cassini/VIMS Observations
Pith reviewed 2026-05-08 04:36 UTC · model grok-4.3
The pith
A correlation method extracts Jupiter zonal winds at multiple altitudes from Cassini near-infrared pixel light curves.
A machine-rendered reading of the paper's core claim, the machinery that carries it, and where it could break.
Core claim
A correlation-based method that exploits Jupiter's rotation to scan the planet and analyze light-curves of specific pixels in Cassini/VIMS spectral data retrieves zonal winds at multiple altitudes from three wavebands and maps the vertical wind structure at the equator, revealing significant tropospheric shear that is weaker than previously reported.
What carries the argument
The correlation-based method that analyzes light-curves of pixels over the Jovian disc as the planet rotates to retrieve winds from near-infrared spectral data.
If this is right
- Zonal winds are obtained at five main latitudes from three distinct wavebands that probe different altitudes.
- The equatorial vertical wind structure shows significant shear within the troposphere.
- The measured shear is weaker than values reported in prior studies.
- The method enables wind retrieval from low-resolution, non-uniform-cadence spectral cubes that would otherwise be difficult to use.
Where Pith is reading between the lines
- Multi-altitude wind constraints from this approach could be combined with cloud-tracking or thermal-wind relations to test whether deep convection or shallow forcing dominates Jupiter's jets.
- The same pixel-correlation technique might be adapted to other rotating planets or moons observed by future spectrometers with similar cadence limitations.
- Weaker shear implies that several dynamical processes must balance to sustain the observed winds, which could be checked by running high-resolution atmospheric models with the new shear profile as a boundary condition.
Load-bearing premise
Correlations in the pixel light curves directly and accurately trace only the zonal wind motion without major contamination from other atmospheric effects, viewing geometry, or data irregularities.
What would settle it
Higher-resolution wind profiles from Juno or ground-based adaptive-optics imaging at the same latitudes and depths that show substantially stronger vertical shear or different speeds would falsify the reported values.
Figures
read the original abstract
Understanding Jupiter's zonal winds is crucial to unraveling the dynamics of its atmosphere. Over the last decades, multiple data sources and techniques have been used to study zonal winds in Jupiter. Here, we develop a correlation-based method for the near-infrared data from the Cassini spacecraft to investigate zonal winds at different altitudes. The new method uses Jupiter's rotation to scan the planet as it rotates, allowing retrieval of winds from the analysis of light-curves of specific pixels over the Jovian disc. The method allows the retrieval of winds at multiple wavelengths from the Cassini/VIMS spectral data despite the low spatial resolution and the non-uniform cadence of the data. By applying this method to two VIMS data cubes acquired on 15 January 2001 at 09:42 UT and 16 January 2001 at 03:22 UT, we reveal the zonal winds at five main latitudes using information from three different wavebands, as well as the wind vertical structure at the equator, showing significant vertical wind shear in the troposphere. The vertical wind shear we derived is weaker than as reported in previous studies, highlighting the intricate interactions among multiple dynamical processes in Jupiter's atmosphere and reflecting the complexity of its atmospheric circulation. Despite the uncertainty due to the low spatial/temporal resolution and non-uniform cadence of the Cassini/VIMS-IR spectral data, the new method established in this study maximizes the value of the Cassini/VIMS in understanding Jupiter's zonal winds. Further observations are essential to explore the underlying mechanisms in Jupiter's atmosphere.
Editorial analysis
A structured set of objections, weighed in public.
Referee Report
Summary. The paper develops a correlation-based method to retrieve Jupiter's zonal winds from Cassini/VIMS near-infrared data by tracking temporal shifts in pixel light-curves as the planet rotates. Applied to two VIMS cubes from 15-16 January 2001, it reports zonal winds at five latitudes using three wavebands (1.0-1.1 µm, 1.6-1.7 µm, 4.5-5.0 µm) that probe distinct pressure levels, plus the vertical wind structure at the equator showing significant tropospheric shear that is weaker than in previous studies. The method includes interpolation to handle non-uniform cadence.
Significance. If validated, the approach would provide a useful technique for extracting wind information from low-resolution, irregularly sampled spectral datasets, adding to the multi-altitude view of Jovian dynamics and potentially constraining models of vertical coupling in the troposphere. The weaker shear result, if confirmed, would highlight the role of competing dynamical processes.
major comments (2)
- [Results and Discussion (application to the two VIMS cubes)] The manuscript lacks explicit validation of the retrieved winds against independent zonal wind profiles (e.g., from Hubble or ground-based observations) at the same latitudes and epochs. Without this, the claim of weaker vertical shear at the equator rests primarily on internal consistency of the light-curve correlations rather than external benchmarking, which is load-bearing for the central result.
- [Methods (correlation-based retrieval and waveband selection)] Error propagation and uncertainty quantification for the correlation-derived velocities are not detailed, particularly how non-uniform cadence, interpolation artifacts, and possible contamination from viewing geometry or other atmospheric variability are folded into the reported wind values and shear. This directly affects the reliability of the five-latitude and vertical-structure claims.
minor comments (2)
- [Abstract] The abstract contains a minor grammatical issue: 'weaker than as reported in previous studies' should read 'weaker than reported in previous studies'.
- [Figures] Figure captions and axis labels should explicitly state the pressure levels or altitudes corresponding to each waveband to aid interpretation of the multi-altitude results.
Simulated Author's Rebuttal
We thank the referee for their constructive comments on our manuscript. We address each major comment below and describe the revisions we will make to strengthen the paper.
read point-by-point responses
-
Referee: [Results and Discussion (application to the two VIMS cubes)] The manuscript lacks explicit validation of the retrieved winds against independent zonal wind profiles (e.g., from Hubble or ground-based observations) at the same latitudes and epochs. Without this, the claim of weaker vertical shear at the equator rests primarily on internal consistency of the light-curve correlations rather than external benchmarking, which is load-bearing for the central result.
Authors: We agree that contemporaneous external validation would provide valuable additional support. No Hubble or ground-based zonal wind profiles exist for the precise epochs (15-16 January 2001) and latitudes analyzed here. Our manuscript already compares results to literature profiles from other epochs and discusses temporal variability. In revision we will add an explicit paragraph in the Discussion section that (i) states the absence of same-epoch independent data, (ii) compares our five-latitude winds and equatorial shear to the closest available profiles (e.g., Cassini/ISS and HST observations from nearby dates), and (iii) clarifies how the multi-wavelength internal consistency of the correlation method underpins the weaker-shear conclusion while acknowledging the limitation. revision: partial
-
Referee: [Methods (correlation-based retrieval and waveband selection)] Error propagation and uncertainty quantification for the correlation-derived velocities are not detailed, particularly how non-uniform cadence, interpolation artifacts, and possible contamination from viewing geometry or other atmospheric variability are folded into the reported wind values and shear. This directly affects the reliability of the five-latitude and vertical-structure claims.
Authors: We accept that a more complete uncertainty analysis is required. The revised Methods section will include a new subsection on error propagation that quantifies (1) uncertainties from correlation-peak fitting, (2) effects of the interpolation scheme used for non-uniform cadence (via sensitivity tests), (3) possible contributions from viewing-geometry variations and short-term atmospheric changes, and (4) how these uncertainties are propagated into the reported zonal winds and the equatorial vertical shear. Error bars will be added to the relevant figures and tables. revision: yes
Circularity Check
No significant circularity; purely observational data reduction
full rationale
The paper introduces a correlation-based retrieval applied directly to two Cassini/VIMS data cubes. Zonal winds at five latitudes and equatorial vertical structure are extracted from pixel light-curve shifts under the explicit assumption that rotation dominates temporal variability. No equations, fitted parameters, or self-citations are invoked in a load-bearing way that would make the reported winds or shear equivalent to the inputs by construction. The method description includes explicit handling of non-uniform cadence via interpolation and selection of three wavebands for distinct pressure levels; the weaker shear is presented as a direct output of this pipeline rather than a renamed or self-referential result. The derivation chain is self-contained against the external VIMS observations.
Axiom & Free-Parameter Ledger
Reference graph
Works this paper leans on
-
[1]
• Zonal winds are retrieved at several altitudes and latitudes, demonstrating their complexity with altitude
manuscript submitted to JGR: Planets Jovian Zonal Winds Revealed from Cassini/VIMS Observations Shenghan Ma1,2, Yuming Wang1,2,3,*, Tao Li1,2, Quanhao Zhang1,2, Jiajia Liu1,2 and Ru-obing Zheng1,2 1 National Key Laboratory of Deep Space Exploration/School of Earth and Space Sciences, University of Science and Technology of China, Hefei 230026, China 2 CAS...
2001
-
[2]
on the James Webb Space Telescope (JWST) to obtain the zonal winds at various latitudes and altitudes. They compared 10-hr separated F164N images (CH4 absorption band at 1.64 µm), F212N images (H2 – H2 and H2 – He collision-induced absorption band at 2.12 µm), and F335M images (CH4 absorption band at 3.35 µm) (Tokunaga & Vacca, 2005). They found an intens...
2005
-
[3]
likely penetrates the upper tropo-sphere. JESO has a variable period of 3.9 to 5.7 years and shares some common char-acteristics with the quasi-biennial oscillation (QBO) on Earth (Antuñano et al., 2020; Giles et al., 2020). Temperature variations in the upper troposphere at about 330 mbar at the equator have been found to anticorrelate with those in the ...
2020
-
[4]
2 Cassini/VIMS Data Sets and Data Processing The Cassini spacecraft reached Jupiter in October 2000 and began its nearly 5-month flyby mission. Cassini was equipped with the advanced Visual and Infrared Mapping Spectrometer (VIMS), which consists of two distinct mapping spectrome-ters for different wavelength ranges: VIMS-V from 0.35 µm to 1.0 µm and VIMS...
2000
-
[5]
The brightness scale corresponds to I/F values as expressed in the color bar associated to each image
Cassini/VIMS images of Jupiter on 2000 December 31 crossing the entire wavelength range at five representative wavebands of 0.75 μm, 0.89 μm, 2.12 μm, manuscript submitted to JGR: Planets 2.58 μm, and 4.31 μm. The brightness scale corresponds to I/F values as expressed in the color bar associated to each image. The raw cube images are processed and calibr...
2000
-
[6]
Jupiter's out-line is visible
An example cube image from our interest period at 4.97 µm. Jupiter's out-line is visible. Three pixels, denoted by three color-coded dots, have center positions at 0.9°N, 86.5°E (S10 L07), 0.2°N, 72.9°E (S11 L07), and 0.3°S, 61.1°E (S12 L07). 3 Methodology of Zonal Wind Measurements 3.1 A Correlation-Based Method Correlation-based methods are widely used ...
1989
-
[7]
VIMS data have low spatial resolutions and a non-uniform cadence
or indi-rectly inferred from temperature measurements by applying the thermal wind equa-tion (Flasar et al., 2004; Benmahi et al., 2021). VIMS data have low spatial resolutions and a non-uniform cadence. Thus, they were never used to study the Jovian zonal winds. However, VIMS’s broad wave-length coverage is a strength and motivates us to develop a correl...
2004
-
[8]
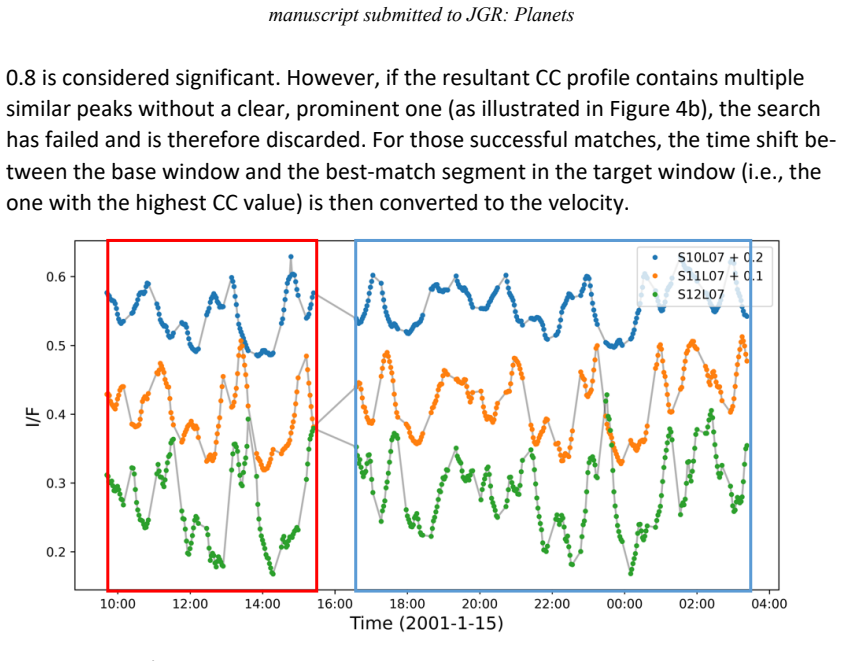
All these issues have to be taken into account. First, the big data gap around 16:00 UT on January 15 allows us to separate the data into two windows: the base window, shown in the red rectangle on the left in Figure 3, and the target window, shown in the blue rectangle on the right. The base window contains 127 data points per pixel and spans about 6 hr,...
2001
-
[9]
The target window contains 239 data points for each pixel and spans about 11 hr from 2001 January 15, 16:35 UT to January 16, 3:22 UT, covering more than a Jovian rotation period
Thus, light curves for these pixels over this base window cover 60% of a full rotation of the planet. The target window contains 239 data points for each pixel and spans about 11 hr from 2001 January 15, 16:35 UT to January 16, 3:22 UT, covering more than a Jovian rotation period. We then search the target window for the segment that best matches the data...
2001
-
[10]
2005, Malathy Devi et al
Two of them are centered at 2.58 µm and 4.31 µm, corresponding to CH₄ and PH₃ absorption bands, respectively, and the waveband widths are 0.048 and 0.032 µm, respectively (Baines et al. 2005, Malathy Devi et al. 2014, Lemière et al. 2021). The other waveband, centered at 2.12 µm with a bandwidth of 0.032 µm, is selected for comparison because it overlaps ...
2005
-
[11]
The black line represents the response curve with the two-way vertical optical depth (τ) equal to 1, and the shaded region gives the range where τ varies from 1 to 2 (Hueso et al
The pressure-wavelength response curve based on Sromovsky & Fry (2018). The black line represents the response curve with the two-way vertical optical depth (τ) equal to 1, and the shaded region gives the range where τ varies from 1 to 2 (Hueso et al. 2023). Key absorption features for different molecules are highlighted with vertical color columns: 2.58 ...
2018
-
[12]
The actual correspondence still depends on cloud and haze distributions and varies across different regions of Jupiter (Sromovsky & Fry, 2010, 2018)
The model assumes the absence of aerosols in Jupiter's atmosphere and that incoming solar radiation is dissipated only through gas absorption or Rayleigh scattering. The actual correspondence still depends on cloud and haze distributions and varies across different regions of Jupiter (Sromovsky & Fry, 2010, 2018). Based on Figure 7, we adopted an optical ...
2010
-
[13]
However, at approximately 8°N and 8°S, corresponding to the northern and southern boundaries of the EZ, the derived wind velocities from adjacent levels show noticeable devia-tions of about 50 - 80 m/s. These mainly arise from comparisons between the 4.31 µm band (the purple circles) and the cloud top (the black diamonds), and between the 2.12 µm band (th...
2004
-
[14]
Their shaded regions represent the mean of all standard de-viations (1σ) between 20°S and 20°N, which is about 8 m/s
and JWST/NIRCam observations (Hueso et al., 2023), respectively. Their shaded regions represent the mean of all standard de-viations (1σ) between 20°S and 20°N, which is about 8 m/s. The unfilled diamonds represent the mean velocities over the latitudinal extents denoted by the stripes on the left-hand side. The positive value of velocity means an eastwar...
2023
-
[15]
Unfilled circles and their er-ror bars represent zonal winds from previous measurements
In contrast, the horizontal (velocity) er-ror bars are based on the calibration described in Sec.3. Unfilled circles and their er-ror bars represent zonal winds from previous measurements. Their vertical (pres-sure) uncertainties are taken from West et al. (2004) and Hueso et al. (2023), manuscript submitted to JGR: Planets whereas the horizontal (velocit...
2004
-
[16]
Ac-cording to the thermal wind relationship, the equatorial temperature anomaly is in thermal wind balance with the vertical shear of zonal wind. At the equator, the warm anomaly is associated with eastward zonal wind shear, while the cold anomaly corresponds to westward zonal wind shear (Tanii & Hasebe, 2002; Pascoe et al., 2005; Antuñano et al., 2020; G...
2002
-
[17]
Later observations from apo-joves during the Jupiter tour (Fletcher et al.,
onboard the Jupiter Icy Moons Explorer (JUICE) dur-ing the approach phase to the planet in 2031 might consider the use of this tech-nique to provide early wind data at multiple heights. Later observations from apo-joves during the Jupiter tour (Fletcher et al.,
2031
-
[18]
Acknowledgments We are grateful to all the reviewers for their constructive suggestions on my work
could take advantage of this tech-nique to obtain regular winds at a low observational cost. Acknowledgments We are grateful to all the reviewers for their constructive suggestions on my work. We thank the Cassini team for their invaluable work in planning and carrying out the mission and the ISIS software team for data calibration. The Cassini/VIMS data ...
-
[19]
Lunar and Planetary Sci-ence Conference. Antuñano, A., Cosentino, R. G., Fletcher, L. N., Simon, A. A., Greathouse, T. K., & Orton, G. S. (2020). Fluctuations in Jupiter’s equatorial stratospheric oscillation. Nature Astronomy, 5(1), 71–77. https://doi.org/10.1038/s41550-020-1165-5 Asay-Davis, X. S., Marcus, P. S., Wong, M. H., & de Pater, I. (2011). Chan...
-
[20]
N., Kaspi, Y., Guillot, T., & Showman, A
https://doi.org/10.1007/s11214-023-00996-6 Fletcher, L. N., Kaspi, Y., Guillot, T., & Showman, A. P. (2020). How Well Do We Understand the Belt/Zone Circulation of Giant Planet Atmospheres? Space Science Reviews, 216(2),
-
[21]
https://doi.org/10.1007/s11214-019-0631-9 Fry, P. M., & Sromovsky, L. A. (2023). Investigating temporal changes in Jupiter’s aerosol structure with rotationally-averaged 2015–2020 HST WFC3 images. Icarus, 389, 115224. https://doi.org/10.1016/j.icarus.2022.115224 García-Melendo, E. (2001). A Study of the Stability of Jovian Zonal Winds from HST Images: 199...
-
[22]
https://doi.org/10.1016/j.icarus.2020.113905 Horner, S
Icarus, 350, 113905. https://doi.org/10.1016/j.icarus.2020.113905 Horner, S. D., & Rieke, M. J. (2004). The near-infrared camera (NIRCam) for the James Webb Space Telescope (JWST) (J. C. Mather, Ed.; p. 628). https://doi.org/10.1117/12.552281 Hueso, R., Sánchez-Lavega, A., Fouchet, T., De Pater, I., Antuñano, A., Fletcher, L. N., Wong, M. H., Rodríguez-Ov...
-
[23]
https://doi.org/10.1007/s11214-024-01057-2 Sánchez‐Arregui, M., Antuñano, A., Hueso, R., & Sánchez‐Lavega, A. (2025). A Long‐Term Study of Jupiter’s Equatorial Winds at the Top of the Troposphere. Journal of Geophysical Re-search: Planets, 130(12), e2025JE009332. https://doi.org/10.1029/2025JE009332 Sánchez‐Lavega, A., Hueso, R., Piccioni, G., Drossart, P...
-
[24]
https://doi.org/10.3847/1538-4357/ad47a0
discussion (0)
Sign in with ORCID, Apple, or X to comment. Anyone can read and Pith papers without signing in.