Recognition: 2 theorem links
· Lean TheoremWideband RFI Monitor Requirements, Design, and Commissioning at DRAO
Pith reviewed 2026-05-12 01:56 UTC · model grok-4.3
The pith
The RFI monitor at DRAO now provides 2 GHz bandwidth for transient detection and long-term environment monitoring after calibration upgrades.
A machine-rendered reading of the paper's core claim, the machinery that carries it, and where it could break.
Core claim
The commissioned RFI monitor supplies 2 GHz instantaneous bandwidth with flexible resolution and integration settings, operating reliably as both a transient detector and long-term radio environment characterization instrument once calibration, temperature, and gain stability are improved. Novel applications of the monitor are introduced, and a new calculation method is derived for quantifying the effect of gain drift on integrated observations.
What carries the argument
The wideband RFI monitor instrument with its 2 GHz bandwidth and channel/integration flexibility, together with the derived method for calculating gain drift effects on integrated data.
Load-bearing premise
The improvements in calibration method, analog section temperature, and gain stability are assumed to be sufficient for reliable long-term operation and accurate transient detection without introducing new systematic errors.
What would settle it
Long-term data sets showing residual gain drift signatures in integrated products or missed transients attributable to calibration drift would demonstrate that the commissioning changes fall short.
Figures


read the original abstract
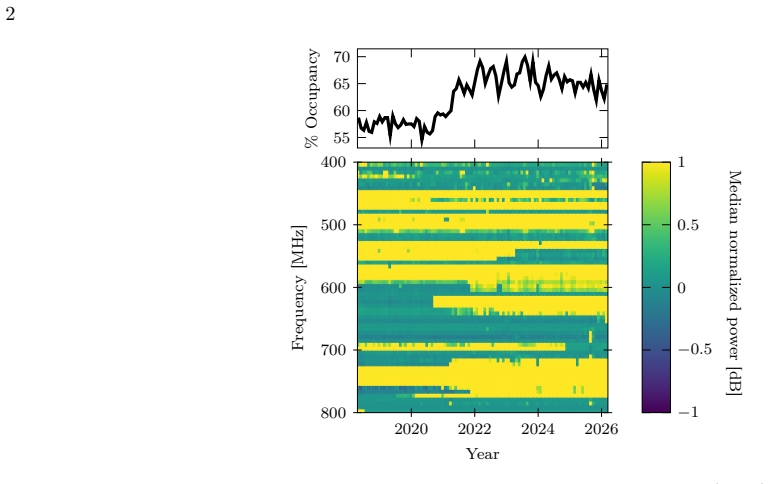
In this paper, we introduce the radio frequency interference monitor deployed at the Dominion Radio Astrophysical Observatory. It provides 2 GHz of instantaneous bandwidth, supporting channel bandwidths as fine as ~100 Hz for 1 s integrations, or integration times as low as ~50 ms for the standard 3.33 kHz channel bandwidth. After operating as a prototype instrument for several years, the monitor was commissioned to improve the calibration method, analog section temperature, and gain stability. It now operates both as a transient detector and as a long-term radio environment characterization tool. We introduce novel applications for the monitor and derive a new method for calculating the effect of gain drift on integrated data.
Editorial analysis
A structured set of objections, weighed in public.
Referee Report
Summary. The manuscript describes the requirements, design, and commissioning of a wideband RFI monitor at the Dominion Radio Astrophysical Observatory (DRAO). The instrument delivers 2 GHz instantaneous bandwidth, supporting channel widths as fine as ~100 Hz for 1 s integrations or integration times down to ~50 ms for the standard 3.33 kHz channels. After several years as a prototype, the monitor was commissioned with revisions to the calibration method, analog-section temperature control, and gain stability. It now operates as both a transient detector and a long-term radio-environment characterization tool. The authors introduce novel applications and derive a new method for calculating the effect of gain drift on integrated data.
Significance. If the commissioning changes and the gain-drift calculation method prove robust, the work supplies a practical wideband RFI monitoring capability that can support transient searches and long-term environmental characterization at DRAO and comparable facilities. The engineering focus on stability improvements and the explicit derivation of a gain-drift correction represent concrete contributions to radio-astronomy instrumentation.
major comments (2)
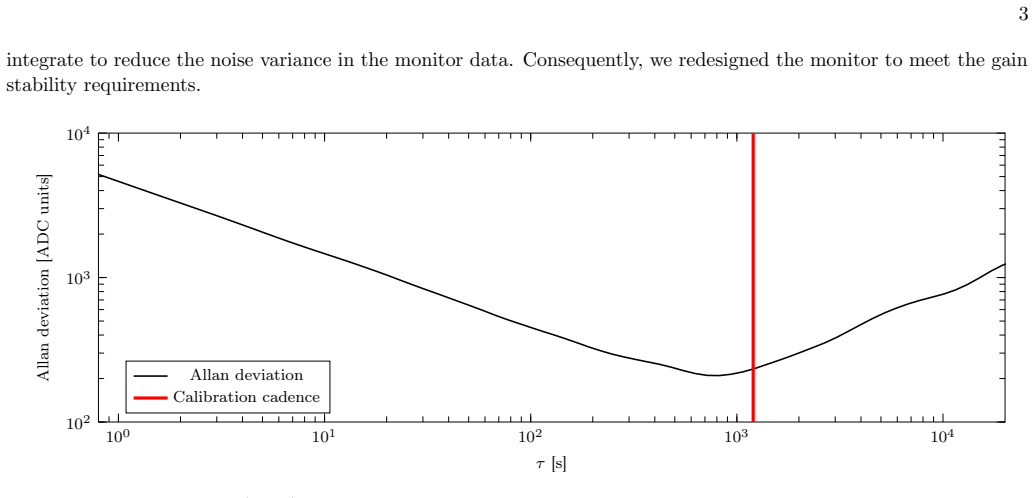
- [Commissioning section] The central claim that the revised calibration method, stabilized analog-section temperature, and improved gain stability now enable reliable long-term operation and accurate transient detection rests on the assertion that residuals are negligible for 50 ms integrations and 100 Hz channels. However, the commissioning section provides no quantitative error budget, Allan-variance stability curves, or side-by-side pre-/post-commissioning metrics that would demonstrate the residuals meet the required thresholds. This absence is load-bearing for the claim that the instrument supports the novel applications without introducing new systematics.
- [Gain-drift calculation section] The new method for calculating the effect of gain drift on integrated data is presented as a key contribution, yet the derivation, underlying assumptions, and any validation against measured data are not shown in sufficient detail to allow independent assessment of its accuracy for the stated integration times and channel bandwidths.
minor comments (1)
- [Abstract] The abstract refers to 'novel applications' without enumerating them; a brief list or forward reference in the introduction would improve clarity.
Simulated Author's Rebuttal
We thank the referee for their thorough review and constructive feedback on our manuscript. We address each of the major comments below and outline the revisions we will make to improve the clarity and robustness of our presentation.
read point-by-point responses
-
Referee: [Commissioning section] The central claim that the revised calibration method, stabilized analog-section temperature, and improved gain stability now enable reliable long-term operation and accurate transient detection rests on the assertion that residuals are negligible for 50 ms integrations and 100 Hz channels. However, the commissioning section provides no quantitative error budget, Allan-variance stability curves, or side-by-side pre-/post-commissioning metrics that would demonstrate the residuals meet the required thresholds. This absence is load-bearing for the claim that the instrument supports the novel applications without introducing new systematics.
Authors: We agree that the commissioning section would benefit from additional quantitative support to substantiate the improvements. In the revised manuscript, we will incorporate a detailed error budget for the 50 ms integrations and 100 Hz channels, Allan-variance stability curves, and direct pre-/post-commissioning metric comparisons. These additions will demonstrate that residuals remain negligible and confirm the instrument's suitability for transient detection and long-term characterization without introducing new systematics. revision: yes
-
Referee: [Gain-drift calculation section] The new method for calculating the effect of gain drift on integrated data is presented as a key contribution, yet the derivation, underlying assumptions, and any validation against measured data are not shown in sufficient detail to allow independent assessment of its accuracy for the stated integration times and channel bandwidths.
Authors: We acknowledge that the gain-drift calculation method requires expanded detail for independent assessment. In the revised manuscript, we will present the full derivation, explicitly enumerate all underlying assumptions, and include validation against measured data for the relevant integration times and channel bandwidths. This will enable readers to evaluate the method's accuracy and applicability. revision: yes
Circularity Check
No significant circularity; engineering derivation is self-contained
full rationale
The paper describes RFI monitor hardware, commissioning changes to calibration/temperature/gain, novel applications, and a derived method for gain-drift effects on integrated data. No load-bearing step reduces by construction to a fitted parameter, self-definition, or self-citation chain. The gain-drift calculation is presented as an independent engineering derivation rather than a renaming or tautology. Commissioning claims rest on implemented improvements without quantitative self-referential validation loops. This matches the default expectation of a non-circular hardware/engineering paper.
Axiom & Free-Parameter Ledger
Lean theorems connected to this paper
-
IndisputableMonolith/Cost/FunctionalEquation.leanwashburn_uniqueness_aczel unclearWe derive a simple and measurable relationship... √N/τ ∫[G(t)−G(0)]/G(0) dt ≤ 0.1 (eq. 9)
Reference graph
Works this paper leans on
-
[1]
2024, Compact Monitoring Antenna, Alaris Antennas
Alaris Antennas. 2024, Compact Monitoring Antenna, Alaris Antennas. https://alaris.tech/storage/antennas/ datasheets/98 OMNI-A0190Version2.3.pdf
work page 2024
-
[2]
2016, Journal of Astronomical Instrumentation, 5, 1641005 26
Bandura, K., Bender, A., Cliche, J., et al. 2016, Journal of Astronomical Instrumentation, 5, 1641005 26
work page 2016
-
[3]
2022, in Proceedings for RFI 2022, doi: 10.46620/RFI22-011
Bruce, N., Harrison, S., & Driessen, P. 2022, in Proceedings for RFI 2022, doi: 10.46620/RFI22-011
-
[4]
Bruce, N., Moa, B., Harrison, S., & Driessen, P. F. 2025, in Proceedings of Radio Frequency Interference Conference — PoS(RFI2024), Vol. 471, 025, doi: 10.22323/1.471.0025
-
[5]
F., Graham-Smith, F., & Wilkinson, P
Burke, B. F., Graham-Smith, F., & Wilkinson, P. N. 2019, An Introduction to Radio Astronomy, 4th edn. (Cambridge University Press), doi: 10.1017/9781316987506
-
[6]
2019, in RFI2019: Coexisting with Radio Frequency Interference
Harrison, S., Coles, R., Robishaw, T., & Del Rizzo, D. 2019, in RFI2019: Coexisting with Radio Frequency Interference
work page 2019
-
[7]
Harrison, S., Lakhani, A., Lavigne, J.-P., et al. 2021, in 2021 XXXIVth General Assembly and Scientific Symposium of the International Union of Radio Science (URSI GASS) (Rome, Italy: IEEE), 1–4, doi: 10.23919/URSIGASS51995.2021.9560505
-
[8]
Harrison, S. T., Robishaw, T., & Hovey, G. 2018b, in 2018 2nd URSI Atlantic Radio Science Meeting (AT-RASC), IEEE, 1–4
work page 2018
-
[9]
Hobbs, G., Manchester, R. N., Dunning, A., et al. 2020, PASA, 37, e012, doi: 10.1017/pasa.2020.2 ITU-R. 2003, Protection criteria used for radio astronomical measurements, Tech. Rep. RA.769-2, ITU-R ITU-R. 2015, Levels of data loss to radio astronomy observations and percentage-of-time criteria resulting from degradation by interference for frequency band...
-
[10]
J., Di Vruno, F., Nkawu, T., et al
Otto, A. J., Di Vruno, F., Nkawu, T., et al. 2021, SKA RFI/EMC STANDARD, Tech. Rep. SKA-TEL-SKO-0000202 Rev. 4, SKAO
work page 2021
-
[11]
Riley, W. J. 2008, Handbook of Frequency Stability
work page 2008
-
[12]
Boulder, CO Rohde and Schwarz GmbH & Co. KG. 2025, FSWX Signal and Spectrum Analyzer, Rohde and Schwarz GmbH & Co. KG. https://cdn.rohde-schwarz.com.cn/pws/dl downloads/ pdm/cl brochures and datasheets/product brochure/ 3684 1314 12/FSWX bro en 3684-1314-12 v0400.pdf Tango Controls software community. 2025, Tango Controls,, https://tango-controls.org Tekt...
work page 2025
-
[13]
Datasheet, Tektronix Inc. https://download.tek.com/datasheet/ RSA7100B Datasheet-EN US 37W-61645-5.pdf The CHIME Collaboration, Amiri, M., Bandura, K., et al. 2022, The Astrophysical Journal Supplement Series, 261, 29, doi: 10.3847/1538-4365/ac6fd9
-
[14]
Ulaby, F. T., Moore, R. K., & Fung, A. K. 1981, Microwave remote sensing : active and passive, Remote sensing ; no. 2-4 (Reading, Mass: Addison-Wesley Pub. Co., Advanced Book Program/World Science Division) VITA developers. 2015, VITA Radio Transport (VRT), Tech. Rep. VITA 49.0, ANSI
work page 1981
discussion (0)
Sign in with ORCID, Apple, or X to comment. Anyone can read and Pith papers without signing in.