Recognition: no theorem link
Beyond power spectrum to unveil systematics on HI intensity maps
Pith reviewed 2026-05-12 01:18 UTC · model grok-4.3
The pith
The starlet l1-norm applied to HI intensity maps improves constraints on cosmological parameters by nearly three times over the angular power spectrum.
A machine-rendered reading of the paper's core claim, the machinery that carries it, and where it could break.
Core claim
We extend the starlet l1-norm, a multi-scale higher-order statistic previously applied to weak lensing maps, to the brightness temperature fluctuations of the HI density field. The HI signal is highly non-Gaussian at late times due to nonlinear structure growth. The starlet l1-norm significantly outperforms the angular power spectrum in constraining cosmological parameters, achieving almost a 3x improvement in the figure of merit relative to the angular power spectrum by capturing non-Gaussian features missed by two-point statistics. Moreover, our results suggest that the starlet l1-norm is robust to several of the systematic effects included in our simulations. Our findings highlight the潜在l
What carries the argument
The starlet l1-norm, which measures the l1-norm of wavelet coefficients across multiple scales to summarize non-Gaussian fluctuations in the brightness temperature maps.
If this is right
- Cosmological parameters such as the matter density can be constrained more tightly using the same HI maps.
- The statistic continues to deliver improved constraints when realistic noise and telescope beam effects are present.
- Non-Gaussian information in the HI field at z approximately 0.4 becomes accessible for parameter estimation.
- The approach can be applied directly to data from ongoing or future intensity mapping surveys like MeerKLASS.
Where Pith is reading between the lines
- The method may help isolate cosmological signals from certain instrumental systematics that affect power spectra more strongly.
- Similar multi-scale statistics could be tested on other tracers of large-scale structure where non-Gaussianity is also important.
- Combining the starlet l1-norm with power spectrum measurements on the same maps might yield even stronger constraints than either alone.
Load-bearing premise
The lognormal model used to generate the simulated HI brightness temperature maps faithfully reproduces the true non-Gaussian statistics of real data, and the neural density estimation recovers unbiased posteriors without hidden biases from the simulation choices or training procedure.
What would settle it
A direct measurement showing that the starlet l1-norm distributions from actual MeerKLASS HI observations deviate substantially from those in the lognormal simulations, or that parameter constraints from real data are no tighter than those from the power spectrum.
Figures


read the original abstract
HI intensity mapping is a promising technique to probe large-scale structure, traditionally analyzed via two-point statistics such as the angular power spectrum. This technique has proven very powerful but may miss key non-Gaussian information present in the signal. We extend the starlet l1-norm, a multi-scale higher-order statistic previously applied to weak lensing maps, to the brightness temperature fluctuations of the HI density field. The HI signal is highly non-Gaussian at late times (z < 1) due to nonlinear structure growth, motivating the use of advanced summary statistics. We simulated full-sky HI lognormal brightness temperature maps using CAMB and GLASS, generating 10,000 realizations with associated cosmological parameters. We extracted both the starlet l1-norm and angular power spectrum from these maps. Using the JaxILI framework, we performed neural density estimation for implicit likelihood inference. The analysis considered simulated maps incorporating realistic noise and telescope beam, capturing the impact of observational effects on parameter inference. In this work, we focus on the redshift range 0.4 < z < 0.45, chosen to match the interval already targeted by existing MeerKLASS observations. The starlet l1-norm significantly outperforms the angular power spectrum in constraining cosmological parameters, achieving almost a 3x improvement in the figure of merit relative to the angular power spectrum by capturing non-Gaussian features missed by two-point statistics. Moreover, our results suggest that the starlet l1-norm is robust to several of the systematic effects included in our simulations. Our findings highlight the potential of multi-scale higher-order statistics such as the starlet l1-norm to enhance cosmological inference from future HI intensity mapping surveys.
Editorial analysis
A structured set of objections, weighed in public.
Referee Report
Summary. The paper claims that the starlet l1-norm, a multi-scale higher-order statistic, significantly outperforms the angular power spectrum for cosmological parameter inference from HI intensity maps. Using 10,000 full-sky lognormal brightness-temperature realizations generated with CAMB+GLASS at 0.4<z<0.45 (including noise and beam), neural density estimation via JaxILI yields an almost 3x improvement in figure of merit by capturing non-Gaussian information missed by two-point statistics; the analysis targets the MeerKLASS redshift range and reports robustness to included systematics.
Significance. If the central result holds, the work would demonstrate the potential of multi-scale higher-order statistics to improve constraints from future HI intensity mapping surveys beyond standard power-spectrum analyses. The use of 10,000 realizations and an implicit-likelihood neural framework is a clear strength, enabling direct, simulation-based comparison of summary statistics. The significance is limited by the reliance on lognormal fields, whose non-Gaussian properties may not match those of realistic N-body or hydrodynamical HI maps.
major comments (2)
- [§2] §2 (simulation setup): The central claim of a ~3x FoM gain rests on lognormal realizations whose one-point PDF and higher-order correlations are imposed by construction; this functional form differs from the skewness, kurtosis, and filamentary structure produced by gravitational instability, so the reported performance advantage of the starlet l1-norm may not generalize beyond the training distribution.
- [§3] §3 (neural inference): No validation of the JaxILI neural density estimator is reported (e.g., parameter recovery on held-out simulations, coverage tests, or posterior calibration), which is required to confirm that the FoM comparison is unbiased and that error bars are correctly calibrated.
minor comments (2)
- [Abstract] The exact definition and numerical value of the figure of merit should be stated explicitly in the text (currently only 'almost 3x' appears in the abstract).
- [§2] Notation for the starlet l1-norm coefficients and the precise redshift binning should be clarified when first introduced.
Simulated Author's Rebuttal
We thank the referee for the constructive comments and positive assessment of the potential of our work. We address each major comment below, making revisions to the manuscript where appropriate to strengthen the presentation and add necessary validations and caveats.
read point-by-point responses
-
Referee: [§2] §2 (simulation setup): The central claim of a ~3x FoM gain rests on lognormal realizations whose one-point PDF and higher-order correlations are imposed by construction; this functional form differs from the skewness, kurtosis, and filamentary structure produced by gravitational instability, so the reported performance advantage of the starlet l1-norm may not generalize beyond the training distribution.
Authors: We agree that lognormal realizations impose specific non-Gaussian properties by construction and do not fully reproduce the filamentary structures arising from gravitational instability in N-body or hydrodynamical simulations. Lognormal fields remain a standard and computationally efficient approximation in the HI intensity mapping literature for capturing the one-point PDF and testing summary statistics in a controlled setting. In the revised manuscript we have expanded the discussion in Section 2 to explicitly acknowledge this limitation, cite relevant comparisons in the literature, and state that extension to more realistic simulations is planned for future work. The reported ~3x FoM improvement is therefore demonstrated within this established framework. revision: partial
-
Referee: [§3] §3 (neural inference): No validation of the JaxILI neural density estimator is reported (e.g., parameter recovery on held-out simulations, coverage tests, or posterior calibration), which is required to confirm that the FoM comparison is unbiased and that error bars are correctly calibrated.
Authors: We concur that explicit validation of the neural density estimator is required. We have added a new subsection in Section 3 that reports parameter recovery tests on held-out simulations, coverage probability diagnostics, and posterior calibration checks for both summary statistics. These tests confirm that the JaxILI model produces well-calibrated posteriors and that the FoM comparison is not biased by the inference method. revision: yes
Circularity Check
No significant circularity in the derivation chain
full rationale
The paper conducts an empirical numerical experiment: it generates 10,000 lognormal HI brightness-temperature maps via CAMB+GLASS, extracts the starlet l1-norm and angular power spectrum from those maps (with added noise and beam), trains a neural density estimator (JaxILI) on the resulting summary statistics, and reports the resulting figure-of-merit comparison. This is a standard mock-based validation exercise whose output (the relative performance) is not mathematically forced by the inputs; the lognormal model is an explicit, stated modeling choice rather than a hidden self-definition. No equations, self-citations, or fitted-parameter renamings are present that would reduce the central claim to a tautology. The analysis is therefore self-contained against its own simulation benchmark.
Axiom & Free-Parameter Ledger
axioms (2)
- domain assumption HI brightness temperature fluctuations can be accurately modeled as a lognormal random field
- domain assumption Neural density estimation inside JaxILI recovers the true likelihood without systematic bias when trained on these simulations
Reference graph
Works this paper leans on
-
[1]
Ajani, V ., Harnois-Déraps, J., Pettorino, V ., & Starck, J.-L. 2023, A&A, 672, L10
work page 2023
- [2]
- [3]
-
[4]
Alsing, J., Charnock, T., Feeney, S., & Wandelt, B. 2019, MNRAS, 488, 4440
work page 2019
-
[5]
Ansari, R., Campagne, J. E., Colom, P., et al. 2012, A&A, 540, A129
work page 2012
-
[6]
Battye, R. A., Browne, I. W. A., Dickinson, C., et al. 2013, MNRAS, 434, 1239
work page 2013
-
[7]
Bernardeau, F., Colombi, S., Gaztañaga, E., & Scoccimarro, R. 2002, Phys. Rep., 367, 1
work page 2002
- [8]
-
[9]
Bull, P., Ferreira, P. G., Patel, P., & Santos, M. G. 2015, ApJ, 803, 21
work page 2015
-
[10]
P., Pettorino, V ., Camera, S., & Martinelli, M
Casas, S., Carucci, I. P., Pettorino, V ., Camera, S., & Martinelli, M. 2023, Physics of the Dark Universe, 39, 101151
work page 2023
-
[11]
Cerardi, N., Giri, S. K., Bianco, M., et al. 2025, arXiv e-prints, arXiv:2511.11568
-
[12]
2020, Proceedings of the National Academy of Science, 117, 30055
Cranmer, K., Brehmer, J., & Louppe, G. 2020, Proceedings of the National Academy of Science, 117, 30055
work page 2020
- [13]
-
[14]
Gkogkou, A., Bonjean, V ., Starck, J.-L., Spinelli, M., & Tsakalides, P. 2026, A&A, 706, A3
work page 2026
-
[15]
Jennings, W. D., Watkinson, C. A., & Abdalla, F. B. 2020, MNRAS, 498, 4518
work page 2020
- [16]
-
[17]
G., Grainge, K., Harper, S., & Wang, J
Li, Y ., Santos, M. G., Grainge, K., Harper, S., & Wang, J. 2021, MNRAS, 501, 4344 MeerKLASS Collaboration, M., Bernal, J. L., Bull, P., et al. 2025, MNRAS, 537, 3632
work page 2021
-
[18]
Mertens, F. G., Bobin, J., & Carucci, I. P. 2024, MNRAS, 527, 3517
work page 2024
-
[19]
2017, in Advances in Neural Infor- mation Processing Systems, ed
Papamakarios, G., Pavlakou, T., & Murray, I. 2017, in Advances in Neural Infor- mation Processing Systems, ed. I. Guyon, U. V . Luxburg, S. Bengio, H. Wal- lach, R. Fergus, S. Vishwanathan, & R. Garnett, V ol. 30 (Curran Associates, Inc.)
work page 2017
-
[20]
Peebles, P. J. E. 1980, The large-scale structure of the universe
work page 1980
-
[21]
Pourtsidou, A., Bacon, D., & Crittenden, R. 2017, MNRAS, 470, 4251
work page 2017
-
[22]
Pritchard, J. R. & Loeb, A. 2012, Reports on Progress in Physics, 75, 086901
work page 2012
-
[23]
2015, in Advancing Astrophysics with the Square Kilometre Array (AASKA14), 19
Santos, M., Bull, P., Alonso, D., et al. 2015, in Advancing Astrophysics with the Square Kilometre Array (AASKA14), 19
work page 2015
-
[24]
Shimabukuro, H., Liu, S., & Li, B. 2025, arXiv e-prints, arXiv:2512.00402 Square Kilometre Array Cosmology Science Working Group, Bacon, D. J., Bat- tye, R. A., et al. 2020, PASA, 37, e007
-
[25]
Starck, J.-L., Moudden, Y ., Abrial, P., & Nguyen, M. 2006, A&A, 446, 1191
work page 2006
-
[26]
Villaescusa-Navarro, F., Genel, S., Castorina, E., et al. 2018, ApJ, 866, 135
work page 2018
- [27]
-
[28]
Wolz, L., Abdalla, F. B., Alonso, D., et al. 2015, in Advancing Astrophysics with the Square Kilometre Array (AASKA14), 35
work page 2015
-
[29]
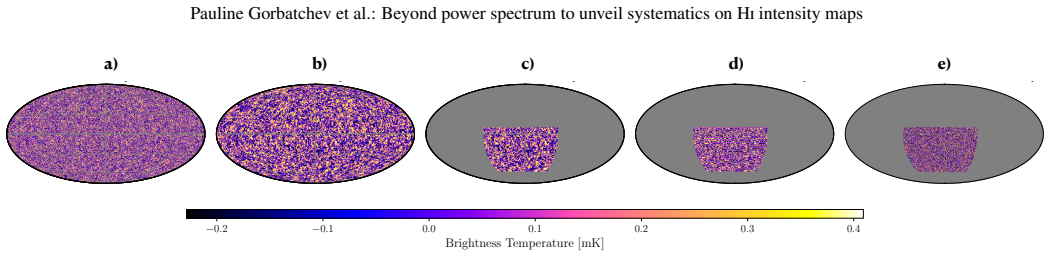
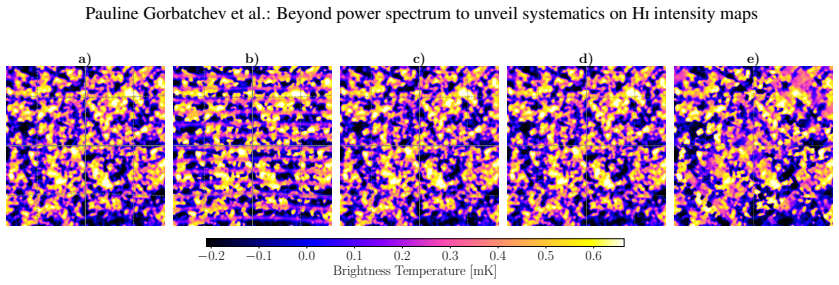
Zonca, A., Thorne, B., Krachmalnicoff, N., & Borrill, J. 2021, The Journal of Open Source Software, 6, 3783 Article number, page 12 of 20 Pauline Gorbatchev et al.: Beyond power spectrum to unveil systematics on Hiintensity maps Fig. B.1: Mollweide projection generated from the code detailed in Sect. 2 for different cosmologies. Fig. B.2: Mollweide projec...
work page 2021
discussion (0)
Sign in with ORCID, Apple, or X to comment. Anyone can read and Pith papers without signing in.