Recognition: 2 theorem links
· Lean TheoremUniversal 3:1 Scaling of Quantum-Confined Stark Spectra Revealed by a Three-Dimensional Profile
Pith reviewed 2026-05-12 05:03 UTC · model grok-4.3
The pith
Quantum-confined Stark spectra keep fixed peak spacings as electric field strength increases, with sub-bandgap and above-bandgap spacings in a 3:1 ratio set only by well width and carrier masses.
A machine-rendered reading of the paper's core claim, the machinery that carries it, and where it could break.
Core claim
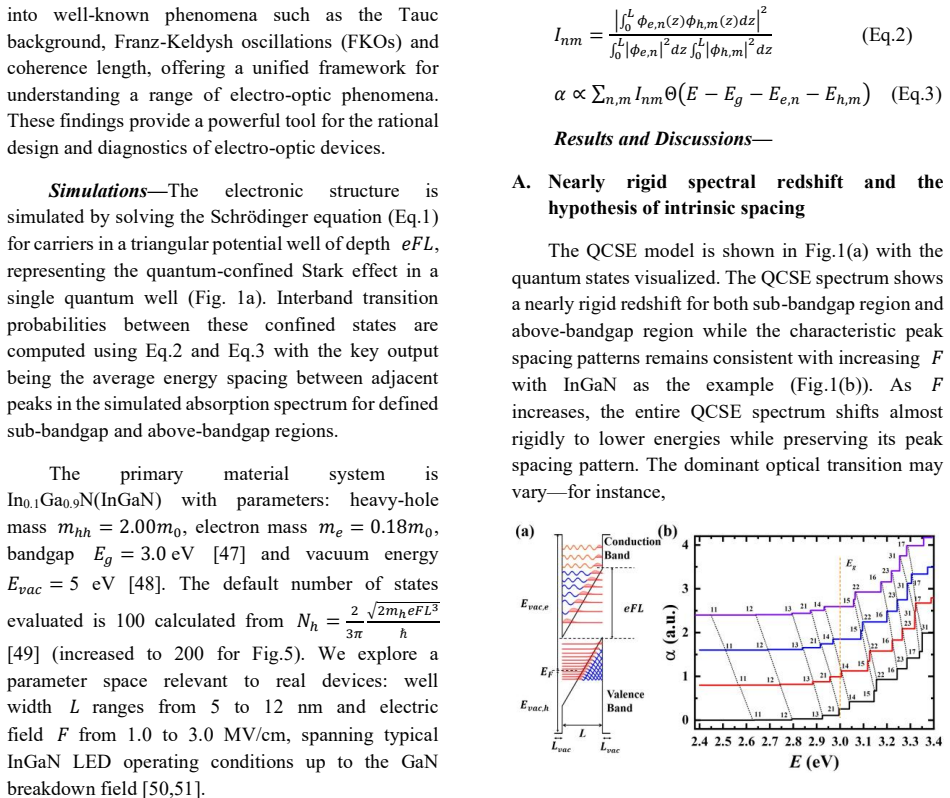
In the quantum-confined Stark effect the spectrum redshifts rigidly while preserving its characteristic peak spacing patterns as the electric field strength F increases. A three-dimensional visualization of the spectra reveals two electric-field-independent scaling laws: sub-bandgap peak spacings follow 12πℏ²/(L²√(m_e m_h)) while above-bandgap spacings follow 4πℏ²/(L²√(m_e m_h)), directly accounting for the 3:1 ratio. Increasing F only expands the energy range and increases the number of observable peaks without altering the spacing itself. The scaling is confirmed in both InGaN and GaAs systems and remains valid at electroluminescence working conditions.
What carries the argument
Three-dimensional profile visualization of the Stark spectra that isolates field-independent peak spacings arising from quantum confinement parameters L, m_e and m_h.
If this is right
- The field strength only widens the spectral window and adds more peaks while the spacing values stay fixed.
- The same scaling laws apply across different material systems including InGaN and GaAs.
- The 3D profile supplies separate information on the Tauc background, Franz-Keldysh oscillations and coherence length.
- The relations enable direct calculation of well width and effective masses from measured spacings under operating conditions.
Where Pith is reading between the lines
- The scaling could be used to extract quantum-well parameters from electroluminescence spectra without separate zero-field measurements.
- Similar three-dimensional spectral profiling might reveal analogous invariants in other field-tunable optical systems such as quantum dots or superlattices.
- If the coherence length extracted from the 3D profile limits device performance, the method offers a diagnostic for optimizing electro-optic structures.
Load-bearing premise
The observed peak spacings remain strictly independent of electric field strength and are produced solely by the quantum confinement length and carrier masses without field-induced changes to the effective potential or coherence.
What would settle it
Measuring peak spacings in InGaN quantum wells at several different electric field strengths and finding that the spacings vary systematically with F would falsify the claimed field independence.
Figures


read the original abstract
We report that the quantum-confined Stark effect spectrum exhibits a nearly rigid redshift while preserving its characteristic peak spacing patterns when increasing the electric field strength F. Using InGaN as a model system, we uncover two electric-field-independent scaling laws for the spectral peaks in both the sub-bandgap and above-bandgap regions and the coefficient ratio is near 3:1. With a novel three-dimensional (3D) visualization, we reveal that the sub-bandgap peak spacings scale as $\frac{12\pi\hbar^2}{L^2\sqrt{m_em_h}}$ while the above-bandgap peak spacings scale as $\frac{4\pi\hbar^2}{L^2\sqrt{m_em_h}}$, explaining the origin of the 3:1 ratio. This scaling behavior, validated in both InGaN and GaAs systems and at electroluminescence working conditions, shows that increasing F only expands the energy range and increases the number of peaks without altering the spacing. Beyond these laws, the 3D profile offers new insights into the Tauc background, Franz-Keldysh oscillations and coherence length, providing a powerful tool for the design and diagnostics of electro-optic devices.
Editorial analysis
A structured set of objections, weighed in public.
Referee Report
Summary. The manuscript reports a nearly rigid redshift in the quantum-confined Stark effect (QCSE) spectrum with increasing electric field strength F, while the characteristic peak spacing patterns remain preserved. Using InGaN as a model system and a novel three-dimensional (3D) visualization of the spectra, the authors uncover field-independent scaling laws for the spectral peaks: sub-bandgap peak spacings scale as 12πℏ²/(L²√(m_e m_h)) and above-bandgap peak spacings as 4πℏ²/(L²√(m_e m_h)), which explains the observed 3:1 ratio. These findings are validated in both InGaN and GaAs systems under electroluminescence conditions, and the 3D profile is used to gain insights into the Tauc background, Franz-Keldysh oscillations, and coherence length.
Significance. If the reported scaling laws and their field independence hold, this work would be significant for condensed matter and materials science, particularly in the design of electro-optic devices such as quantum well lasers and modulators. It provides simple, predictive scaling relations based on well width and effective masses that could simplify spectral analysis and device optimization. The 3D spectral profiling technique offers a new methodological tool for dissecting complex spectra involving multiple physical contributions, potentially applicable to other systems beyond the ones studied here.
major comments (2)
- [3D profile analysis] The claim that peak spacings are independent of F is central to the scaling laws but requires stronger support. The QCSE Hamiltonian contains the -e F z term, which transforms the eigenstates to Airy functions whose energy spacings are not constant and acquire F-dependent shifts. The manuscript should demonstrate, perhaps in the section presenting the 3D visualization, that inter-peak differences remain constant across the F range after subtracting the rigid redshift, including quantitative error bars or statistical analysis of the extracted spacings. Without such evidence, the reported coefficients could be influenced by the specific F window or peak identification procedure amid the Tauc background and FK oscillations.
- [validation in GaAs] While validation in InGaN is detailed, the extension to GaAs systems is mentioned but lacks sufficient comparative data or figures showing the same scaling laws hold with the expected parameters for GaAs effective masses and well widths. A table comparing extracted spacings to the predicted values for both materials would strengthen the generality claim.
minor comments (4)
- The abstract could more explicitly state the range of F values over which the rigid redshift and constant spacings are observed.
- [figures] The 3D profile figures would benefit from additional annotations, such as lines indicating the extracted peak positions or color scales for intensity, to aid reader interpretation.
- Ensure consistent use of symbols; for example, the reduced mass term √(m_e m_h) should be clearly defined in the text near the scaling equations.
- A brief discussion of potential limitations, such as the assumption of infinite barriers or neglect of exciton binding energy variations with F, would improve the manuscript's balance.
Simulated Author's Rebuttal
We thank the referee for the constructive comments and for recognizing the potential significance of our work for electro-optic device design. We address each major comment below and will revise the manuscript accordingly.
read point-by-point responses
-
Referee: The claim that peak spacings are independent of F is central to the scaling laws but requires stronger support. The QCSE Hamiltonian contains the -e F z term, which transforms the eigenstates to Airy functions whose energy spacings are not constant and acquire F-dependent shifts. The manuscript should demonstrate, perhaps in the section presenting the 3D visualization, that inter-peak differences remain constant across the F range after subtracting the rigid redshift, including quantitative error bars or statistical analysis of the extracted spacings. Without such evidence, the reported coefficients could be influenced by the specific F window or peak identification procedure amid the Tauc background and FK oscillations.
Authors: We appreciate the referee's call for stronger quantitative validation of the field independence. Our 3D visualization is intended to reveal this by displaying spectra as a surface in which constant spacings appear as parallel features after the rigid redshift. To address the concern directly, the revised manuscript will expand the 3D profile section with explicit tabulation and plotting of inter-peak differences (after redshift subtraction) across the full experimental F range. These will include error bars obtained from Lorentzian/Gaussian peak fitting and a statistical summary (mean and standard deviation of spacings). This addition will confirm constancy within experimental precision and rule out artifacts from the Tauc background or FK oscillations. revision: yes
-
Referee: While validation in InGaN is detailed, the extension to GaAs systems is mentioned but lacks sufficient comparative data or figures showing the same scaling laws hold with the expected parameters for GaAs effective masses and well widths. A table comparing extracted spacings to the predicted values for both materials would strengthen the generality claim.
Authors: We agree that an explicit side-by-side comparison would better demonstrate generality. In the revised manuscript we will insert a new table that reports the extracted sub-bandgap and above-bandgap peak spacings from both the InGaN and GaAs datasets, together with the corresponding theoretical predictions calculated from each material's effective masses (m_e, m_h) and well width L. This table will also list the observed 3:1 ratio for each system, allowing immediate verification that the scaling coefficients match the expected values. revision: yes
Circularity Check
No significant circularity; derivation chain remains self-contained
full rationale
The paper reports empirical observation of field-independent peak spacings in QCSE spectra via 3D visualization, then states that these spacings match the given theoretical expressions involving L, m_e and m_h. The 3:1 ratio follows arithmetically from the coefficients 12 and 4 in those expressions. No quoted step defines the observed spacing in terms of the claimed scaling law, fits a parameter to a subset and renames the output as a prediction, or relies on a load-bearing self-citation whose content reduces to the present claim. The formulas are presented as matching established quantum-confinement results rather than being constructed from the data by definition. Field-independence is an empirical assertion supported by the visualization, not a tautology.
Axiom & Free-Parameter Ledger
free parameters (2)
- Well width L
- Effective masses m_e and m_h
axioms (1)
- domain assumption Peak spacings in the QCSE spectrum are determined exclusively by quantum confinement in a well of width L with effective masses m_e and m_h and remain independent of electric field F
invented entities (1)
-
Three-dimensional (3D) spectral profile
no independent evidence
Lean theorems connected to this paper
-
IndisputableMonolith/Foundation/ArithmeticFromLogic.lean; Constants.leanreality_from_one_distinction unclearnearly rigid redshift ... average peak spacing ... intrinsic property of the quantum well geometry, largely independent of ... F
Reference graph
Works this paper leans on
-
[1]
N. Bouarissa and H. Aourag, Effective masses of electrons and heavy holes in InAs, InSb, GaSb, GaAs and some of their ternary compounds, Infrared physics & techonology 40, 343 (1999)
work page 1999
-
[2]
S. Tautz, S. Opel, P. Kiesel, S. U. Dankowski, H. M. Hauenstein, A. Seilmeier, M. Krause, U. D. Keif and G. H. D öhler, Spectrally and temporally resolved investigations of the carrier dynamics in biased low temperature grown GaAs, in European Quantum Electronics Conferenc (Optica Publishing Group, 1998) p. QMC4
work page 1998
-
[3]
J. H. Davises, The physics of low -dimensional semiconductor: an introduction (Cambridge university press, 1998)
work page 1998
discussion (0)
Sign in with ORCID, Apple, or X to comment. Anyone can read and Pith papers without signing in.