Recognition: 2 theorem links
· Lean TheoremMeasuring Five-Nines Reliability: Sample-Efficient LLM Evaluation in Saturated Benchmarks
Pith reviewed 2026-05-13 02:53 UTC · model grok-4.3
The pith
A learned sampling distribution focused on failure-prone inputs estimates five-nines LLM reliability with up to 156 times fewer model calls than uniform sampling.
A machine-rendered reading of the paper's core claim, the machinery that carries it, and where it could break.
Core claim
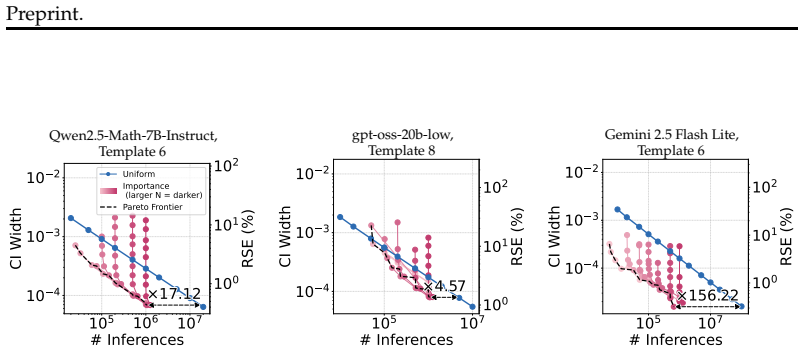
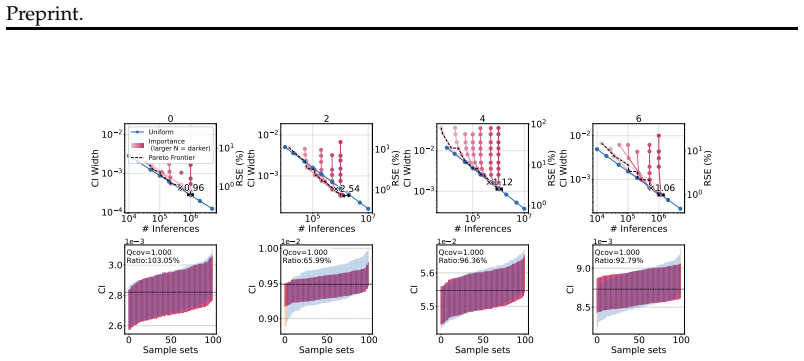
LLM failures exhibit strong systematic patterns across broad parameterized input spaces, so the cross-entropy method can iteratively learn a sampling distribution concentrated on failure-prone inputs. When applied to GSM8K templates with three LLMs, the approach produces failure-rate estimates with tight confidence bounds using up to 156.22 times fewer inferences than naive uniform sampling, and it shows that models with indistinguishable accuracy on standard benchmarks can differ substantially in estimated failure rates.
What carries the argument
The cross-entropy method used to learn an adaptive sampling distribution over parameterized inputs that concentrates evaluations where the LLM is most likely to fail.
If this is right
- Models that match on standard accuracy benchmarks can still be ranked by their estimated failure rates at the five-nines level.
- Extreme reliability becomes quantifiable for LLMs without requiring prohibitive numbers of inferences.
- Reliability emerges as a measurable and separable dimension of model quality beyond accuracy on saturated tests.
- The framework makes routine evaluation of 99.999 percent reliability feasible for reliability-sensitive applications.
Where Pith is reading between the lines
- The same concentration strategy could be tested on other families of parameterized tasks such as code generation or instruction following to check whether the sample savings generalize.
- If the systematic failure patterns persist across model scales, the method might let developers track reliability improvements during training with far less compute than full Monte Carlo runs.
- The approach implies that future benchmarks should include parameterized templates by default so that tail behavior can be measured efficiently rather than relying on fixed test sets.
- Deployment pipelines could incorporate periodic re-estimation of failure rates using the learned distributions to detect when a model's reliability degrades over time.
Load-bearing premise
LLM failures cluster strongly enough in certain regions of parameterized input spaces that an iterative optimization routine can learn an effective distribution focused on those regions.
What would settle it
Applying the method to a fresh set of parameterized templates or a new model family and finding that the reduction in required inferences stays below 10x or that the estimated failure rates fail to separate models with matched accuracy would show the claimed efficiency and distinguishing power do not hold.
Figures


read the original abstract
While existing benchmarks demonstrate the near-perfect performance of large language models (LLMs) on various tasks, this apparent saturation often obscures the need for rigorous evaluation of their reliability. In real-world deployment, however, achieving extremely high reliability (e.g., "five-nines" (99.999%) vs. "three-nines" (99.9%)) is fundamentally critical, as this gap results in an order-of-magnitude increase in failures, which is catastrophic in reliability-critical applications. Still, estimating such a rare failure probability with tight confidence bounds requires prohibitively large LLM inference sizes, making standard Monte Carlo evaluation infeasible under limited compute budgets. In this paper, we observe that LLM failures exhibit strong systematic patterns: across broad parameterized input spaces, a small subset of inputs disproportionately accounts for the majority of failures. Leveraging this observation, we propose to learn a sampling distribution concentrated on failure-prone inputs via the cross-entropy method (CEM). We evaluate our framework on three LLMs, Qwen2.5-Math-7B-Instruct, gpt-oss-20b-low, and Gemini 2.5 Flash Lite, across parameterized GSM8K templates and achieve up to 156.22x reduction in required inferences compared to naive uniform sampling. Our estimates reveal that models with indistinguishable accuracy on standard benchmarks can differ substantially in estimated failure rates, underscoring that reliability is a distinct and measurable axis of model quality. Our simple yet practical framework enables the evaluation of extreme reliability in LLMs, a distinct and underexplored dimension of evaluation beyond existing benchmarks, for their growing use in reliability-sensitive applications.
Editorial analysis
A structured set of objections, weighed in public.
Referee Report
Summary. The paper claims that LLM failures on parameterized input spaces (e.g., GSM8K templates) exhibit systematic patterns that can be exploited by the cross-entropy method (CEM) to learn an importance-sampling distribution concentrated on failure-prone inputs. This yields up to 156.22× fewer LLM inferences than uniform Monte Carlo sampling while producing tight estimates of rare failure rates (five-nines regime) and revealing reliability differences among models that are indistinguishable on standard accuracy metrics. Experiments are reported on Qwen2.5-Math-7B-Instruct, gpt-oss-20b-low, and Gemini 2.5 Flash Lite.
Significance. If the empirical speedup and reliability distinctions hold under proper validation, the work supplies a concrete, sample-efficient protocol for quantifying extreme reliability—an axis that standard saturated benchmarks cannot resolve. The observation that accuracy and failure-rate estimates diverge is a useful corrective for deployment decisions in reliability-critical settings. The approach is simple enough to be adopted if the CEM parameterization and overhead accounting are made fully reproducible.
major comments (3)
- [§3] §3 (CEM procedure): the parameterization of the sampling distribution over template variables is not specified (e.g., whether it is a product of independent categorical distributions, a neural density estimator, or a mixture), nor are the initial distribution, number of CEM iterations, or elite-sample fraction given. These choices directly affect both the bias of the failure-rate estimator and the claimed reduction factor.
- [§4] §4 (experimental validation): no ground-truth comparison is provided on any restricted parameter subspace where exhaustive enumeration or exact failure probability can be computed; without such a sanity check, it is impossible to separate genuine variance reduction from possible under- or over-estimation induced by the learned distribution.
- [§5] §5 (results and reduction claim): the 156.22× figure is stated as a reduction in “required inferences,” yet the manuscript does not clarify whether the cost of the initial uniform samples and the CEM optimization iterations themselves is included in the numerator. If these overhead samples are omitted, the net efficiency gain is overstated.
minor comments (2)
- Notation for the failure probability estimator (e.g., ˆp vs. p̂) is used inconsistently across equations and text; a single consistent symbol would improve readability.
- Figure captions should explicitly state the number of CEM iterations and elite fraction used for each curve so that readers can reproduce the exact experimental conditions.
Simulated Author's Rebuttal
We thank the referee for the constructive and detailed comments, which highlight important aspects of reproducibility, validation, and cost accounting. We address each major comment point by point below and commit to revisions that strengthen the manuscript without altering its core claims.
read point-by-point responses
-
Referee: §3 (CEM procedure): the parameterization of the sampling distribution over template variables is not specified (e.g., whether it is a product of independent categorical distributions, a neural density estimator, or a mixture), nor are the initial distribution, number of CEM iterations, or elite-sample fraction given. These choices directly affect both the bias of the failure-rate estimator and the claimed reduction factor.
Authors: We agree that these details are essential for reproducibility and for evaluating estimator properties. The submitted manuscript described the CEM at a conceptual level but omitted the concrete parameterization for brevity. We will revise §3 to state explicitly that the distribution is a product of independent categorical distributions (one per template variable), initialized uniformly, run for a fixed number of iterations with a standard elite fraction, and include pseudocode. This specification preserves the unbiasedness of the importance-sampling estimator provided the support remains full, which it does. revision: yes
-
Referee: §4 (experimental validation): no ground-truth comparison is provided on any restricted parameter subspace where exhaustive enumeration or exact failure probability can be computed; without such a sanity check, it is impossible to separate genuine variance reduction from possible under- or over-estimation induced by the learned distribution.
Authors: We acknowledge the value of an explicit sanity check. While the full template space precludes exhaustive enumeration, a restricted low-dimensional subspace admits exact computation. We will add to §4 a new experiment on such a subspace that compares the CEM estimate against the exact failure probability obtained by enumeration, confirming that the observed reduction aligns with variance reduction rather than bias. This addition directly addresses the concern while remaining computationally tractable. revision: yes
-
Referee: §5 (results and reduction claim): the 156.22× figure is stated as a reduction in “required inferences,” yet the manuscript does not clarify whether the cost of the initial uniform samples and the CEM optimization iterations themselves is included in the numerator. If these overhead samples are omitted, the net efficiency gain is overstated.
Authors: The referee correctly identifies an ambiguity. The reported 156.22× factor compares the number of LLM calls needed by uniform Monte Carlo to reach a target confidence-interval width against the number of calls used in the final importance-sampling stage after the distribution has been learned. The initial uniform samples and CEM iterations constitute a one-time setup cost that is not folded into the ratio. In the revision we will (i) state this distinction explicitly in §5, (ii) report the absolute total inference count including overhead for both methods, and (iii) note that the overhead is amortized when the learned distribution is reused across multiple evaluation runs or models, preserving substantial net savings in practice. revision: yes
Circularity Check
No significant circularity; derivation is self-contained
full rationale
The paper's core procedure learns an importance sampling distribution via the standard cross-entropy method applied to observed LLM failures on parameterized templates, then computes an unbiased importance-weighted estimator of the rare-event failure probability. The reported 156.22x reduction is an empirical ratio of sample sizes needed to achieve equivalent variance or confidence bounds under uniform versus learned sampling; it is not obtained by algebraic substitution or by renaming a fitted parameter as a prediction. No equation reduces the target failure rate to a quantity defined in terms of itself, and no load-bearing premise rests on a self-citation whose content is itself unverified or tautological. The method remains externally falsifiable by repeating the sampling experiments on the cited models and benchmarks.
Axiom & Free-Parameter Ledger
free parameters (1)
- CEM sampling distribution parameters
axioms (1)
- domain assumption LLM failures exhibit strong systematic patterns across broad parameterized input spaces
Lean theorems connected to this paper
-
IndisputableMonolith/Cost/FunctionalEquation.leanwashburn_uniqueness_aczel unclear?
unclearRelation between the paper passage and the cited Recognition theorem.
we propose to learn a sampling distribution concentrated on failure-prone inputs via the cross-entropy method (CEM)... achieve up to 156.22× reduction in required inferences
-
IndisputableMonolith/Foundation/RealityFromDistinction.leanreality_from_one_distinction unclear?
unclearRelation between the paper passage and the cited Recognition theorem.
LLM failures exhibit strong systematic patterns: across broad parameterized input spaces, a small subset of inputs disproportionately accounts for the majority of failures
What do these tags mean?
- matches
- The paper's claim is directly supported by a theorem in the formal canon.
- supports
- The theorem supports part of the paper's argument, but the paper may add assumptions or extra steps.
- extends
- The paper goes beyond the formal theorem; the theorem is a base layer rather than the whole result.
- uses
- The paper appears to rely on the theorem as machinery.
- contradicts
- The paper's claim conflicts with a theorem or certificate in the canon.
- unclear
- Pith found a possible connection, but the passage is too broad, indirect, or ambiguous to say the theorem truly supports the claim.
Reference graph
Works this paper leans on
-
[1]
Seyed Iman Mirzadeh and Keivan Alizadeh and Hooman Shahrokhi and Oncel Tuzel and Samy Bengio and Mehrdad Farajtabar , booktitle=. 2025 , url=
work page 2025
-
[2]
Training Verifiers to Solve Math Word Problems
Training Verifiers to Solve Math Word Problems , author=. arXiv preprint arXiv:2110.14168 , year=
work page internal anchor Pith review Pith/arXiv arXiv
-
[3]
The Eleventh International Conference on Learning Representations , year=
Self-Consistency Improves Chain of Thought Reasoning in Language Models , author=. The Eleventh International Conference on Learning Representations , year=
-
[4]
Weighted average importance sampling and defensive mixture distributions , author=. Technometrics , volume=. 1995 , publisher=
work page 1995
-
[5]
Qwen2.5-Math Technical Report: Toward Mathematical Expert Model via Self-Improvement
Qwen2.5-Math Technical Report: Toward Mathematical Expert Model via Self-Improvement , author=. arXiv preprint arXiv:2409.12122 , year=
work page internal anchor Pith review Pith/arXiv arXiv
-
[6]
DeepSeek-R1: Incentivizing Reasoning Capability in LLMs via Reinforcement Learning
Deepseek-r1: Incentivizing reasoning capability in llms via reinforcement learning , author=. arXiv preprint arXiv:2501.12948 , year=
work page internal anchor Pith review Pith/arXiv arXiv
-
[7]
gpt-oss-120b & gpt-oss-20b Model Card
gpt-oss-120b & gpt-oss-20b model card , author=. arXiv preprint arXiv:2508.10925 , year=
work page internal anchor Pith review Pith/arXiv arXiv
- [8]
- [9]
- [10]
-
[11]
David Rein and Betty Li Hou and Asa Cooper Stickland and Jackson Petty and Richard Yuanzhe Pang and Julien Dirani and Julian Michael and Samuel R. Bowman , booktitle=. 2024 , url=
work page 2024
-
[12]
Gemini 3 Pro Model Card , year =
-
[13]
C. J. Clopper and E. S. Pearson , journal =. The Use of Confidence or Fiducial Limits Illustrated in the Case of the Binomial , urldate =
-
[14]
Methodology and computing in applied probability , volume=
The cross-entropy method for combinatorial and continuous optimization , author=. Methodology and computing in applied probability , volume=. 1999 , publisher=
work page 1999
-
[15]
Annals of operations research , volume=
A tutorial on the cross-entropy method , author=. Annals of operations research , volume=. 2005 , publisher=
work page 2005
-
[16]
The cross-entropy method: a unified approach to combinatorial optimization, Monte-Carlo simulation, and machine learning , author=. 2004 , publisher=
work page 2004
-
[17]
B. Efron , title =. The Annals of Statistics , number =. 1979 , doi =
work page 1979
-
[18]
GPT-5.4 Thinking System Card , year =
-
[19]
Maia Polo, Felipe and Weber, Lucas and Choshen, Leshem and Sun, Yuekai and Xu, Gongjun and Yurochkin, Mikhail , booktitle =. tiny. 2024 , volume =
work page 2024
-
[20]
Efficient benchmarking (of language models) , author=. Proceedings of the 2024 Conference of the North American Chapter of the Association for Computational Linguistics: Human Language Technologies (Volume 1: Long Papers) , pages=
work page 2024
-
[21]
Anchor points: Benchmarking models with much fewer examples , author=. Proceedings of the 18th Conference of the European Chapter of the Association for Computational Linguistics (Volume 1: Long Papers) , pages=
-
[22]
arXiv preprint arXiv:2509.11106 , year=
Fluid language model benchmarking , author=. arXiv preprint arXiv:2509.11106 , year=
-
[23]
Task-Completion Time Horizons of Frontier AI Models , author =. 2026 , month =
work page 2026
-
[24]
Neurips Safe Generative AI Workshop 2024 , year=
Large Language Model Benchmarks Do Not Test Reliability , author=. Neurips Safe Generative AI Workshop 2024 , year=
work page 2024
-
[25]
Efficient Evaluation of LLM Performance with Statistical Guarantees , author=. 2026 , eprint=
work page 2026
-
[26]
Forty-second International Conference on Machine Learning , year=
Reliable and Efficient Amortized Model-based Evaluation , author=. Forty-second International Conference on Machine Learning , year=
-
[27]
Proceedings of The 24th International Conference on Artificial Intelligence and Statistics , pages =
Deep Probabilistic Accelerated Evaluation: A Robust Certifiable Rare-Event Simulation Methodology for Black-Box Safety-Critical Systems , author =. Proceedings of The 24th International Conference on Artificial Intelligence and Statistics , pages =. 2021 , editor =
work page 2021
-
[28]
Bai, Yuanlu and Huang, Zhiyuan and Lam, Henry and Zhao, Ding , title =. 2022 , issue_date =. doi:10.1145/3519385 , journal =
- [29]
-
[30]
Gemini 2.5: Pushing the Frontier with Advanced Reasoning, Multimodality, Long Context, and Next Generation Agentic Capabilities , author=. 2025 , eprint=
work page 2025
-
[31]
Carlos E Jimenez and John Yang and Alexander Wettig and Shunyu Yao and Kexin Pei and Ofir Press and Karthik R Narasimhan , booktitle=. 2024 , url=
work page 2024
-
[32]
Terminal-Bench: Benchmarking Agents on Hard, Realistic Tasks in Command Line Interfaces , author=. 2026 , eprint=
work page 2026
-
[33]
MMMU: A Massive Multi-discipline Multimodal Understanding and Reasoning Benchmark for Expert AGI , author=. Proceedings of CVPR , year=
-
[34]
MMMU-Pro: A More Robust Multi-discipline Multimodal Understanding Benchmark , author=. Proceedings of ACL , year=
-
[35]
A benchmark of expert-level academic questions to assess. Nature , volume =. 2026 , doi =. 2501.14249 , archivePrefix =
work page internal anchor Pith review Pith/arXiv arXiv 2026
-
[36]
ARC-AGI-3: A New Challenge for Frontier Agentic Intelligence , author=. 2026 , eprint=
work page 2026
-
[37]
Proceedings of the 57th Annual Meeting of the Association for Computational Linguistics , year=
HellaSwag: Can a Machine Really Finish Your Sentence? , author=. Proceedings of the 57th Annual Meeting of the Association for Computational Linguistics , year=
-
[38]
Wang, Alex and Singh, Amanpreet and Michael, Julian and Hill, Felix and Levy, Omer and Bowman, Samuel. GLUE : A Multi-Task Benchmark and Analysis Platform for Natural Language Understanding. Proceedings of the 2018 EMNLP Workshop B lackbox NLP : Analyzing and Interpreting Neural Networks for NLP. 2018. doi:10.18653/v1/W18-5446
-
[39]
WinoGrande: An Adversarial Winograd Schema Challenge at Scale
WinoGrande: An Adversarial Winograd Schema Challenge at Scale , author=. arXiv preprint arXiv:1907.10641 , year=
work page internal anchor Pith review arXiv 1907
discussion (0)
Sign in with ORCID, Apple, or X to comment. Anyone can read and Pith papers without signing in.