Recognition: 1 theorem link
· Lean TheoremMorphology-resolved stress contributions in sheared wet granular materials
Pith reviewed 2026-05-13 04:26 UTC · model grok-4.3
The pith
Simple two-grain capillary bridges dominate the isotropic capillary pressure in sheared wet granular materials, accounting for nearly 85% at low liquid content and enabling parameter-free reproduction of the friction coefficient.
A machine-rendered reading of the paper's core claim, the machinery that carries it, and where it could break.
Core claim
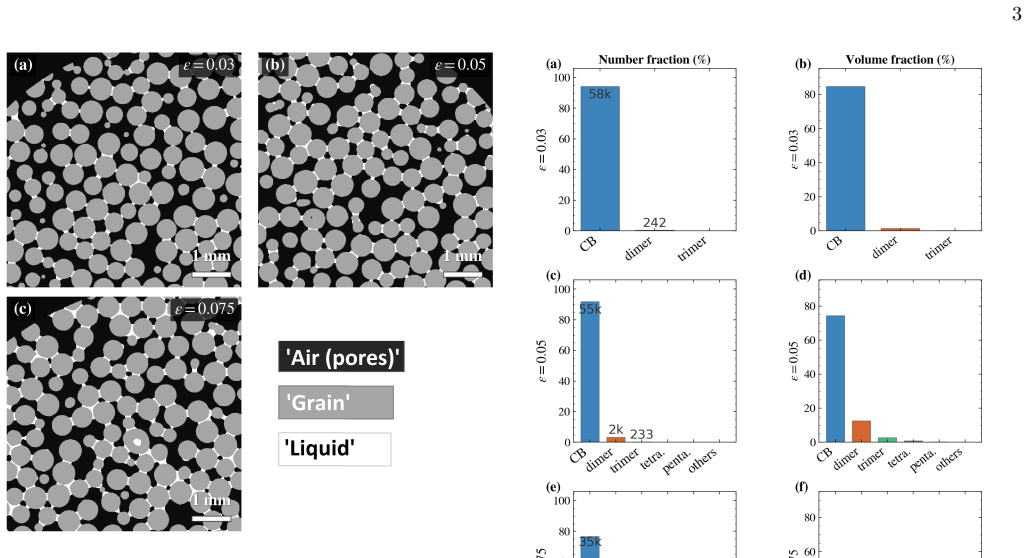
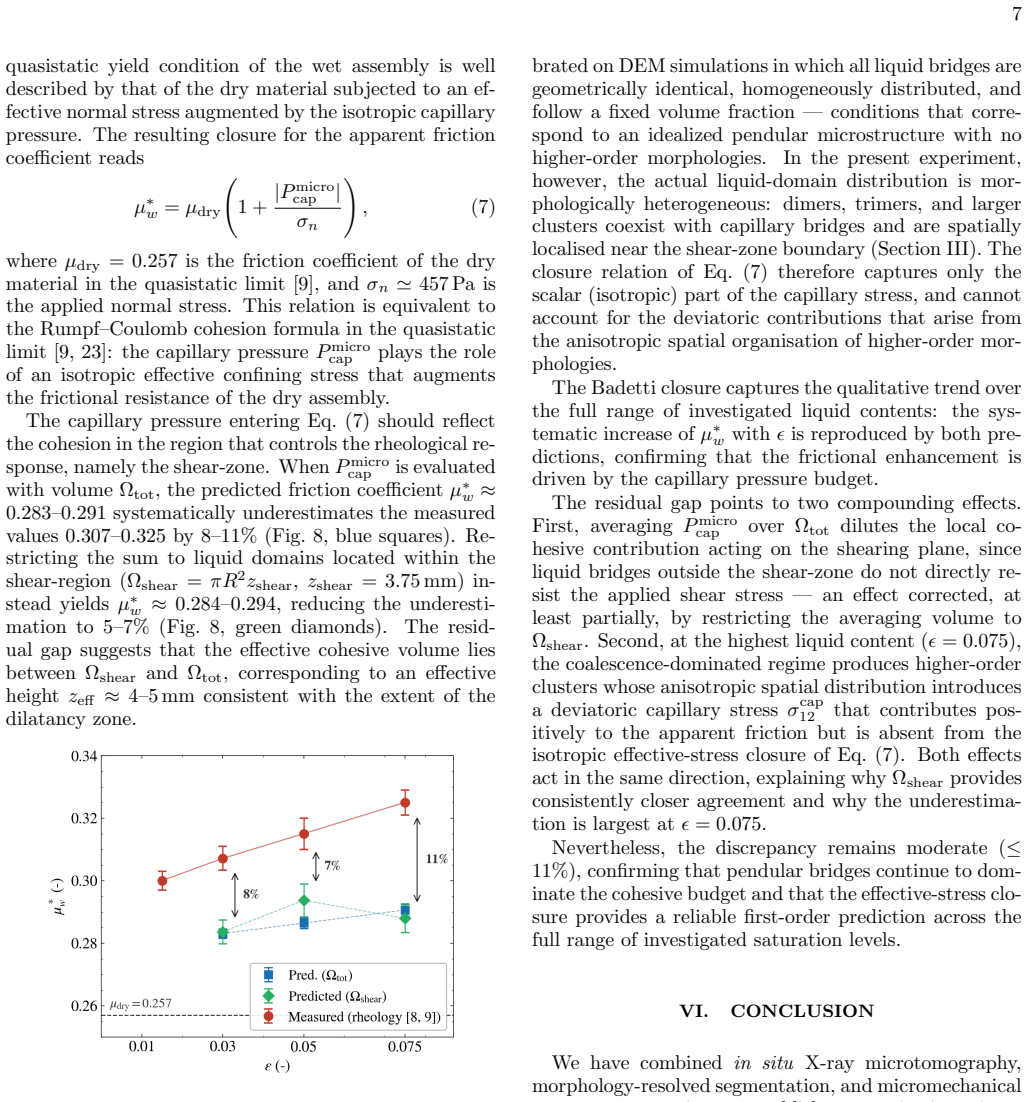
Three-dimensional X-ray microtomography coupled to rheometry allows automatic classification of liquid domains into capillary bridges, dimers, trimers, and larger clusters in sheared wet granular materials. Two-grain bridges generate the dominant contribution to the isotropic capillary pressure, nearly 85 percent at liquid-to-solid volume ratio ε = 0.05, while more complex clusters contribute only weakly. Insertion of these resolved stresses into an effective-stress framework reproduces the macroscopic friction coefficient across the investigated liquid contents without adjustable parameters, establishing a micro-macro link between liquid morphology and rheology.
What carries the argument
Automatic classification of liquid morphologies from X-ray tomography into bridges, dimers, trimers and clusters, followed by calculation of their separate contributions to capillary stress and insertion of the sum into an effective-stress framework.
If this is right
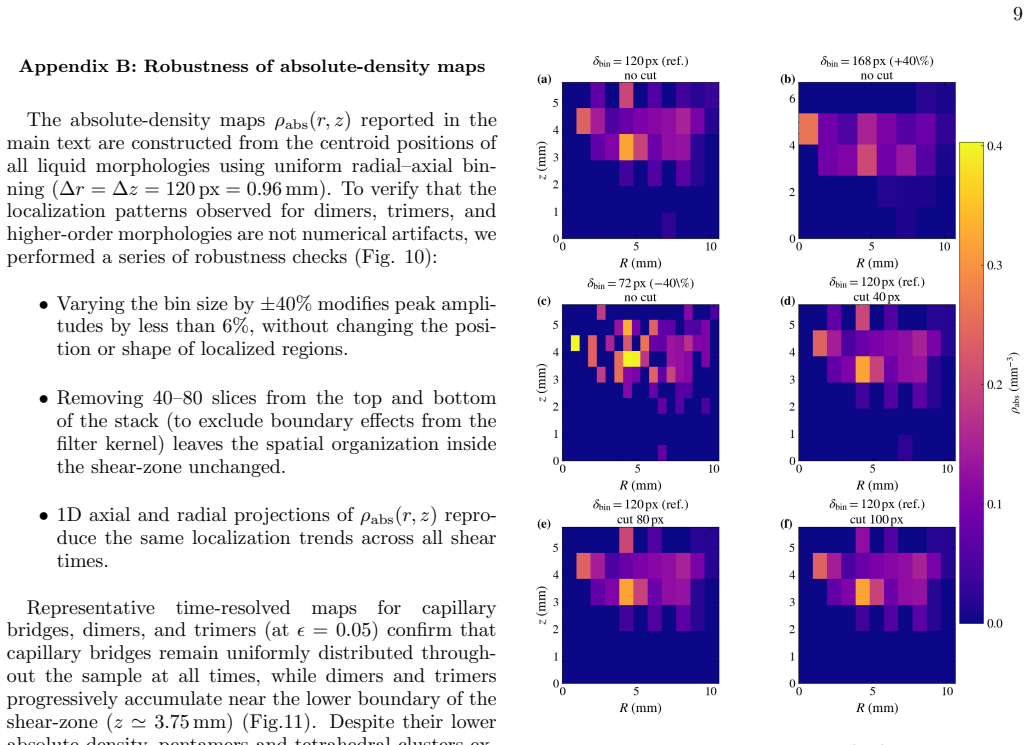
- Shear localization drives higher-order liquid morphologies to accumulate near the lower boundary of the shear zone through coalescence.
- Simple two-grain bridges stay uniformly distributed and provide the large majority of isotropic capillary pressure.
- The morphology-resolved capillary pressure inserted into an effective-stress framework reproduces the macroscopic friction coefficient without fitting parameters.
- This supplies a direct grain-scale to bulk link between liquid shape and the rheology of wet granular materials.
Where Pith is reading between the lines
- Cohesion models for wet granular flow could be simplified by emphasizing two-grain bridge statistics rather than full cluster distributions.
- At higher liquid contents the relative contribution of clusters may increase, so the dominance observed at ε = 0.05 is not guaranteed to hold universally.
- The same morphology-tracking approach could be applied to other deformation geometries or flow regimes to test whether bridge dominance persists.
- Control of liquid morphology during processing might offer a route to tune cohesion in granular products without changing overall liquid volume.
Load-bearing premise
The automatic classification of liquid domains from X-ray tomography images accurately reflects true three-dimensional morphologies without major errors from imaging resolution or segmentation.
What would settle it
An independent measurement or simulation at ε = 0.05 that shows the total capillary pressure deviates substantially from being 85 percent attributable to two-grain bridges, or that the effective-stress model fails to reproduce the observed friction even qualitatively.
Figures


read the original abstract
Three-dimensional X-ray microtomography, coupled to rheometric measurements, enables a morphology-resolved reconstruction of capillary stresses at the grain scale in unsaturated wet granular materials. Liquid domains are automatically classified into capillary bridges, dimers, trimers, and larger clusters, and their spatial organization is tracked as a function of shear deformation and liquid content. We show that shear localization governs the redistribution of the liquid phase: capillary bridges remain uniformly distributed throughout the sample, while higher-order morphologies accumulate preferentially near the lower boundary of the shear-zone through a shear-driven coalescence mechanism. Despite this spatial localization, simple two-grain bridges generate the dominant contribution to the isotropic capillary pressure, accounting for nearly 85\% of the total at liquid-to-solid volume ratio $\epsilon = 0.05$, whereas more complex liquid clusters contribute only weakly to the overall cohesion. Incorporating the morphology-resolved capillary pressure into an effective-stress framework qualitatively reproduces the macroscopic friction coefficient across the full range of investigated liquid contents, without adjustable parameters. These results establish a predictive micro--macro link between liquid morphology and the rheology of wet granular materials.
Editorial analysis
A structured set of objections, weighed in public.
Referee Report
Summary. The paper combines 3D X-ray microtomography with rheometric measurements to classify liquid domains in sheared wet granular materials into capillary bridges, dimers, trimers, and larger clusters. It reports that simple two-grain bridges account for nearly 85% of the isotropic capillary pressure at liquid-to-solid volume ratio ε = 0.05, while complex clusters contribute weakly; shear localization drives redistribution of higher-order morphologies. Morphology-resolved capillary pressures are then inserted into a standard effective-stress framework, which qualitatively reproduces the macroscopic friction coefficient across the investigated liquid contents without adjustable parameters.
Significance. If the classification and stress calculations are robust, the work provides a valuable grain-scale to macro-scale link for cohesion and friction in unsaturated granular media. The reported dominance of bridges and the parameter-free reproduction of friction are notable strengths that could inform predictive models of wet granular rheology.
major comments (3)
- [Methods (liquid-domain classification)] The 85% bridge contribution (abstract) is obtained by partitioning all detected liquid domains and summing their individual capillary stress contributions. The automatic classification algorithm is therefore load-bearing, yet the manuscript provides no validation metrics, sensitivity tests to resolution/noise/partial-volume effects, or comparison against manual segmentation. X-ray tomography of wet packs is known to produce ambiguities precisely at the bridge-to-cluster scale; any systematic bias would directly rescale the reported percentages.
- [Results (effective-stress reproduction)] The capillary stresses are computed from the classified morphologies and inserted into an effective-stress framework stated to require no adjustable parameters. The manuscript must explicitly list the framework constants (e.g., any packing-dependent prefactors or contact-angle assumptions) and demonstrate that none were fitted to the present dataset; otherwise the “parameter-free” claim cannot be verified.
- [Results (shear localization)] Shear-zone boundaries and the spatial accumulation of clusters near the lower boundary are central to the redistribution claim. The precise definition of the shear zone (e.g., strain-rate threshold or velocity-profile criterion) and any sensitivity of the 85% figure to that choice should be reported with quantitative error bars.
minor comments (2)
- [Abstract] The abstract states that the framework “qualitatively reproduces” the friction coefficient; a quantitative measure of agreement (e.g., mean absolute deviation or R²) should be supplied in the main text or supplementary material.
- [Introduction] Notation for the liquid-to-solid volume ratio (ε) and the various morphological classes should be defined at first use in the introduction and used consistently in all figures and equations.
Simulated Author's Rebuttal
We thank the referee for the constructive comments, which help strengthen the methodological transparency and clarity of our results. We address each major point below and will revise the manuscript to incorporate the requested details and validations.
read point-by-point responses
-
Referee: [Methods (liquid-domain classification)] The 85% bridge contribution (abstract) is obtained by partitioning all detected liquid domains and summing their individual capillary stress contributions. The automatic classification algorithm is therefore load-bearing, yet the manuscript provides no validation metrics, sensitivity tests to resolution/noise/partial-volume effects, or comparison against manual segmentation. X-ray tomography of wet packs is known to produce ambiguities precisely at the bridge-to-cluster scale; any systematic bias would directly rescale the reported percentages.
Authors: We agree that explicit validation of the automatic classification is necessary to support the reported 85% figure. The current manuscript outlines the algorithm using connectivity and volume-based geometric thresholds but does not include quantitative validation. In the revision we will add a dedicated Methods subsection reporting (i) agreement rates from manual segmentation of a 200-domain subset, (ii) sensitivity of the bridge fraction to ±10% changes in resolution and noise level, and (iii) the resulting uncertainty band on the 85% value. revision: yes
-
Referee: [Results (effective-stress reproduction)] The capillary stresses are computed from the classified morphologies and inserted into an effective-stress framework stated to require no adjustable parameters. The manuscript must explicitly list the framework constants (e.g., any packing-dependent prefactors or contact-angle assumptions) and demonstrate that none were fitted to the present dataset; otherwise the “parameter-free” claim cannot be verified.
Authors: We accept that the parameter-free claim must be documented explicitly. The framework follows the standard effective-stress relation with the coordination number taken directly from the independently measured dry packing fraction, a fixed contact angle of 0° consistent with the grain wetting properties, and no other prefactors. In the revision we will insert a short table listing every constant, its numerical value, and its literature or measurement source, together with a statement confirming that none were adjusted to fit the present friction data. revision: yes
-
Referee: [Results (shear localization)] Shear-zone boundaries and the spatial accumulation of clusters near the lower boundary are central to the redistribution claim. The precise definition of the shear zone (e.g., strain-rate threshold or velocity-profile criterion) and any sensitivity of the 85% figure to that choice should be reported with quantitative error bars.
Authors: We agree that the shear-zone definition and its influence on the reported percentages require quantitative specification. The manuscript defines the shear zone via the region where the local strain rate exceeds 20% of the imposed maximum, obtained from combined rheometric and tomographic velocity fields. In the revision we will state this threshold explicitly and add a sensitivity analysis showing that the bridge contribution remains within 82–88% when the threshold is varied from 10% to 30%, together with error bars derived from three independent shear experiments. revision: yes
Circularity Check
No significant circularity; direct computation from tomography data into standard framework
full rationale
The central results derive from X-ray microtomography imaging of liquid domains, automatic morphological classification into bridges/dimers/etc., and direct summation of per-morphology capillary stress contributions (yielding the ~85% bridge figure at ε=0.05). These stresses are then inserted into a pre-existing effective-stress model that reproduces macroscopic friction without adjustable parameters. This is an empirical micro-to-macro mapping and validation step, not a self-referential loop. No equations reduce by construction to fitted inputs, no uniqueness theorems are imported from the authors' prior work, and no ansatz is smuggled via self-citation. The derivation remains self-contained against the tomography measurements and standard continuum mechanics relations.
Axiom & Free-Parameter Ledger
axioms (2)
- domain assumption Standard assumptions of continuum effective-stress theory apply at the grain scale for capillary contributions
- domain assumption X-ray tomography segmentation and automatic morphology classification faithfully recover true liquid domain geometries without resolution-dependent bias
Reference graph
Works this paper leans on
- [1]
-
[2]
R. Mani, D. Kadau, and H. J. Herrmann, Granul. Matter 15, 447 (2013)
work page 2013
- [3]
- [4]
- [5]
-
[6]
T. T. Vo, S. Nezamabadi, P. Mutabaruka, J.-Y. Delenne, and F. Radjai, Nat. Commun.11, 1 (2020)
work page 2020
-
[7]
A. Awdi, C. Chateau, F. Chevoir, J.-N. Roux, and A. Fall, J. Rheol.67, 365 (2023)
work page 2023
-
[8]
M. Badetti, A. Fall, D. Hautemayou, F. Chevoir, P. Aimedieu, S. Rodts, and J.-N. Roux, J. Rheol.62, 1175 (2018)
work page 2018
-
[9]
M. Badetti, A. Fall, F. Chevoir, and J.-N. Roux, Eur. Phys. J. E41, 1 (2018)
work page 2018
-
[10]
L. Amarsid, A. Awdi, A. Fall, J.-N. Roux, and F. Chevoir, J. Rheol.68, 523 (2024)
work page 2024
-
[11]
C. D. Willett, M. J. Adams, S. A. Johnson, and J. P. Seville, Langmuir16, 9396 (2000)
work page 2000
- [12]
-
[13]
G. Lian, C. Thornton, and M. J. Adams, J. Colloid In- terface Sci.161, 138 (1993)
work page 1993
- [14]
- [15]
-
[16]
V. Richefeu, F. Radjai, and J.-Y. Delenne, Comput. Geotech.80, 353 (2016)
work page 2016
- [17]
-
[18]
A. Gans, O. Pouliquen, and M. Nicolas, Phys. Rev. E 101, 032904 (2020)
work page 2020
- [19]
-
[20]
S. M. Iveson, J. D. Litster, K. Hapgood, and B. J. Ennis, Powder Technol.117, 3 (2001)
work page 2001
-
[21]
A. Awdi, C. Chateau, A. Fall, J.-N. Roux, and P. Aime- dieu, Granul. Matter27, 1 (2025)
work page 2025
- [22]
- [23]
- [24]
-
[25]
Dragonfly 2022.1 [computer software] (2022),https:// dragonfly.comet.tech
work page 2022
-
[26]
T. Liu, A. Merat, M. H. M. Makhmalbaf, C. Fajardo, 13 and P. Merati, Exp. Fluids56, 166 (2015)
work page 2015
-
[27]
J. Fiscina, M. Pakpour, A. Fall, N. Vandewalle, C. Wag- ner, and D. Bonn, Phys. Rev. E86, 020103 (2012)
work page 2012
- [28]
discussion (0)
Sign in with ORCID, Apple, or X to comment. Anyone can read and Pith papers without signing in.