Recognition: 2 theorem links
· Lean TheoremDependence functions based on Chatterjee's rank correlation
Pith reviewed 2026-05-14 18:15 UTC · model grok-4.3
The pith
The Markov product extends Chatterjee's ξ-coefficient to two dependence functions that measure both functional dependence and diagonal concentration in directed stochastic dependence.
A machine-rendered reading of the paper's core claim, the machinery that carries it, and where it could break.
Core claim
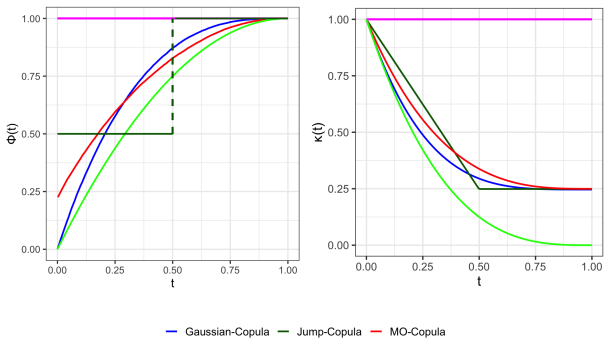
By constructing the Markov product (Y, Y') with Y' conditionally independent of Y given X, the dependence functions φ_{(Y,X)} and κ_{(Y,X)} furnish a geometric and distributional extension of Chatterjee's coefficient that quantifies directed stochastic dependence through both functional representation and concentration near the diagonal.
What carries the argument
The Markov product (Y, Y'), the pair in which Y' is a conditionally independent copy of Y given X; it supplies the geometric object whose concentration near the diagonal is measured by the new functions.
If this is right
- The scalar ξ coefficient is replaced by functions that separately track functional dependence and diagonal concentration.
- Directed dependence can be visualized through the geometry of the Markov product near the diagonal.
- The framework applies directly to vector-valued predictors without additional modification.
- Comparison of the two functions distinguishes cases where functional representation is strong but the product remains diffuse.
Where Pith is reading between the lines
- The same construction could be applied to time-series pairs to detect lagged dependence without assuming linearity.
- Nonparametric estimators of φ and κ from finite samples would allow routine use in exploratory data analysis.
- The concentration measure might serve as a diagnostic for the strength of causal arrows inferred from observational data.
Load-bearing premise
The Markov product construction faithfully captures the relevant dependence structure without requiring further restrictions on the joint distribution of (Y, X).
What would settle it
A concrete counter-example in which Y is a deterministic function of X yet either dependence function fails to reach its upper bound of one would falsify the claimed extension.
Figures


read the original abstract
We investigate a geometric and distributional reinterpretation of Chatterjee's $\xi$-coefficient, which measures functional dependence between a response variable $Y$ and a predictor vector $\mathbf{X}$. For this purpose, we analyze the Markov product $(Y,Y')$, where $Y'$ is a copy of $Y$ that is conditionally independent of $Y$ given $\mathbf{X}$. Based on this construction, we introduce and study two dependence functions, denoted by $\phi_{(Y,\mathbf{X})}$ and $\kappa_{(Y,\mathbf{X})}$. The proposed framework provides a geometric interpretation of the Markov product and extends Chatterjee's correlation coefficient to a richer and more interpretable object for the analysis of directed stochastic dependence. In particular, rather than only measuring how well $Y$ can be represented as a function of $\mathbf{X}$, the proposed dependence functions additionally quantify how strongly the corresponding Markov product is concentrated near the diagonal.
Editorial analysis
A structured set of objections, weighed in public.
Referee Report
Summary. The paper reinterprets Chatterjee's ξ-coefficient geometrically via the Markov product (Y, Y'), where Y' is conditionally independent of Y given X. It defines two new dependence functions φ_{(Y,X)} and κ_{(Y,X)} that quantify the concentration of the product measure near the diagonal, thereby extending the original coefficient from a measure of functional dependence to a richer descriptor of directed stochastic dependence.
Significance. If the constructions and properties hold, the work supplies a parameter-free extension of a popular rank correlation that adds geometric content to the Markov product. The direct derivation from the joint law of (Y, Y') without auxiliary fitting or regularity assumptions on the conditional distributions is a clear strength and could support new diagnostic tools in nonparametric dependence analysis.
major comments (2)
- The abstract asserts that φ and κ extend ξ while quantifying diagonal concentration, yet the provided text supplies neither the explicit integral or expectation definitions of these functions nor the derivation showing how they recover ξ as a special case; without these steps the central claim remains unverified.
- The geometric interpretation is said to follow from concentration of the product measure near the diagonal, but the manuscript must demonstrate that this concentration is strictly stronger than the original ξ and is not an immediate restatement of the conditional-independence construction already used to define ξ.
minor comments (2)
- Notation for the dependence functions should be introduced with a clear display equation immediately after the Markov-product definition rather than only in the abstract.
- The paper should include a short table or proposition comparing the range and invariance properties of φ, κ, and ξ under monotone transformations.
Simulated Author's Rebuttal
We thank the referee for the careful reading and constructive feedback. We address the major comments point by point below, indicating the revisions we will implement.
read point-by-point responses
-
Referee: The abstract asserts that φ and κ extend ξ while quantifying diagonal concentration, yet the provided text supplies neither the explicit integral or expectation definitions of these functions nor the derivation showing how they recover ξ as a special case; without these steps the central claim remains unverified.
Authors: We agree that the abstract and introductory presentation would benefit from greater explicitness. The functions φ_{(Y,X)} and κ_{(Y,X)} are defined in Section 2 via expectations over the Markov product (Y,Y'), specifically as φ_{(Y,X)}(t) = P(|Y - Y'| ≤ t | X) integrated appropriately against the marginal of X, and κ as a normalized version. The recovery of ξ occurs as the integral of φ over [0,1] equaling 1 - ξ or the appropriate functional. In the revised manuscript we will insert the explicit integral/expectation formulas directly into the abstract and add a short derivation paragraph in the introduction that recovers ξ as the t=0 or integrated case. revision: yes
-
Referee: The geometric interpretation is said to follow from concentration of the product measure near the diagonal, but the manuscript must demonstrate that this concentration is strictly stronger than the original ξ and is not an immediate restatement of the conditional-independence construction already used to define ξ.
Authors: We will strengthen the geometric argument. Although the Markov product is the same object used for ξ, φ and κ retain the full law of the distance |Y-Y'| rather than collapsing it to a single scalar. We will add a dedicated subsection containing (i) a proposition showing that the map from the conditional law to the concentration function is injective on a strictly larger class than the functional-dependence case captured by ξ, and (ii) two explicit counter-examples (one discrete, one continuous) in which ξ is identical but the functions φ and κ differ, thereby establishing that the geometric descriptor is strictly richer. revision: yes
Axiom & Free-Parameter Ledger
axioms (1)
- domain assumption Existence of a conditionally independent copy Y' given X
Lean theorems connected to this paper
-
IndisputableMonolith/Cost/FunctionalEquation.leanwashburn_uniqueness_aczel unclearϕ_{(Y,X)}(t) := P(|F_Y(Y)−F_Y(Y')|≤t); κ_{(Y,X)}(t) := 1−3∫_0^t(1−ϕ(s))ds; concentration of Markov product near diagonal
-
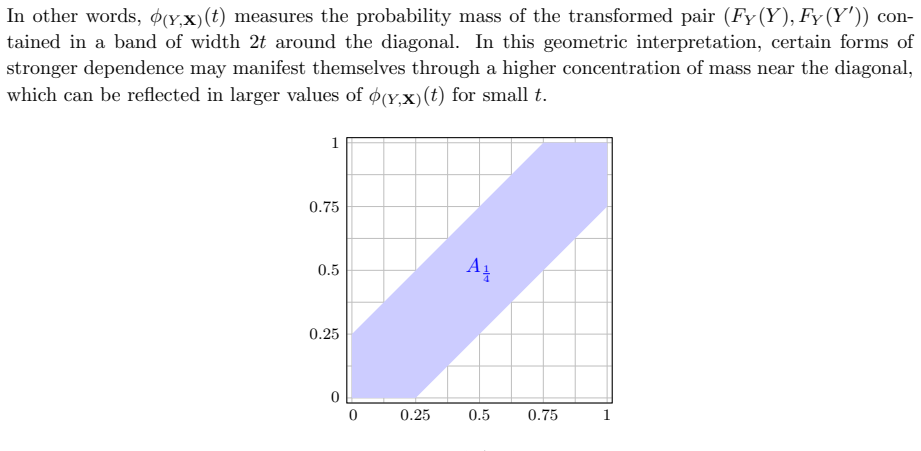
IndisputableMonolith/Foundation/AlexanderDuality.leanalexander_duality_circle_linking uncleargeometric interpretation via band A_t around diagonal after PIT
Reference graph
Works this paper leans on
-
[1]
On continuity of Chatterjee's rank correlation and related dependence measures
J. Ansari and S. Fuchs (2025). On continuity of Chatterjee’s rank correlation and related dependence measures.Bernoulli, to appear. arXiv:2503.11390.https://arxiv.org/abs/2503.11390
work page internal anchor Pith review Pith/arXiv arXiv 2025
-
[2]
J. Ansari and S. Fuchs (2025). An ordering for the strength of functional dependence. arXiv:2511.06498.https://arxiv.org/abs/2511.06498
- [3]
-
[4]
L. Tran and F. Han (2024). On a rank-based Azadkia–Chatterjee correlation coefficient. arXiv:2412.02668.https://arxiv.org/abs/2412.02668
-
[5]
C. Dalitz, J. Arning, and S. Goebbels (2024). A simple bias reduction for Chatterjee’s correlation. J. Stat. Theory Pract.18, Article 51. DOI:https://doi.org/10.1007/s42519-024-00399-y
-
[6]
Z. Lin and F. Han (2023). On boosting the power of Chatterjee’s rank correlation.Biometrika 110(2), 283–299. DOI:https://doi.org/10.1093/biomet/asac048. 19
-
[7]
H. Shi, M. Drton, and F. Han (2024). On Azadkia–Chatterjee’s conditional dependence coefficient. Bernoulli30(2), 851–877. DOI:https://doi.org/10.3150/22-BEJ1529
-
[8]
J. Ansari and S. Fuchs (2022). A direct extension of Azadkia & Chatterjee’s rank correlation to multi-response vectors. arXiv:2212.01621.https://arxiv.org/abs/2212.01621
- [9]
-
[10]
M. Azadkia and S. Chatterjee (2021). A simple measure of conditional dependence.Ann. Stat. 49(6), 3070–3102. DOI:https://doi.org/10.1214/21-AOS2073
-
[11]
S. Fuchs and C. Limbach (2026). A dimension reduction for extreme types of directed dependence. Dependence Modeling14(1), Article 20250016. DOI:https://doi.org/10.1515/demo-2025-0016
-
[12]
S. Fuchs (2024). Quantifying directed dependence via dimension reduction.J. Multivar. Anal.201, Article 105266. DOI:https://doi.org/10.1016/j.jmva.2023.105266
-
[13]
Durante and C
F. Durante and C. Sempi (2015).Principles of Copula Theory. Boca Raton, FL: Chapman and Hall/CRC
2015
-
[14]
R. B. Nelsen (2006).An Introduction to Copulas. 2nd ed., Springer
2006
-
[15]
S. Fuchs, C. Limbach, and F. Sch¨ urrer (2026). On exact regions between measures of concordance and Chatterjee’s rank correlation for lower semilinear copulas.Int. J. Approx. Reason.189, Article 109588. DOI:https://doi.org/10.1016/j.ijar.2025.109588
-
[16]
Wine Quality dataset – Classification
Taweilo (n.d.). Wine Quality dataset – Classification. Kaggle dataset.https://www.kaggle.com/ datasets/taweilo/wine-quality-dataset-balanced-classification
-
[17]
P. Cortez, A. Cerdeira, F. Almeida, T. Matos, and J. Reis (2009). Modeling wine preferences by data mining from physicochemical properties.Decision Support Systems47(4), 547–553. DOI: https://doi.org/10.1016/j.dss.2009.05.016. 20 A Proofs and additional results Proof of Theorem 1.1 Proof.By results in the literature [1], we have ξ(Y,X) = 6 Z R P(Y≥y, Y ′ ...
discussion (0)
Sign in with ORCID, Apple, or X to comment. Anyone can read and Pith papers without signing in.