OgBench: A Framework for Evaluating Graph Neural Networks on Omics Data
Pith reviewed 2026-05-19 15:40 UTC · model grok-4.3
The pith
Graph neural networks often fail to outperform simple MLPs on omics data tasks with few samples and many nodes.
A machine-rendered reading of the paper's core claim, the machinery that carries it, and where it could break.
Core claim
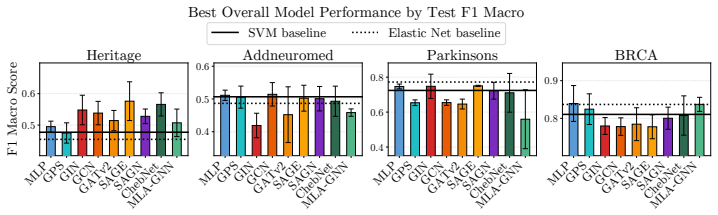
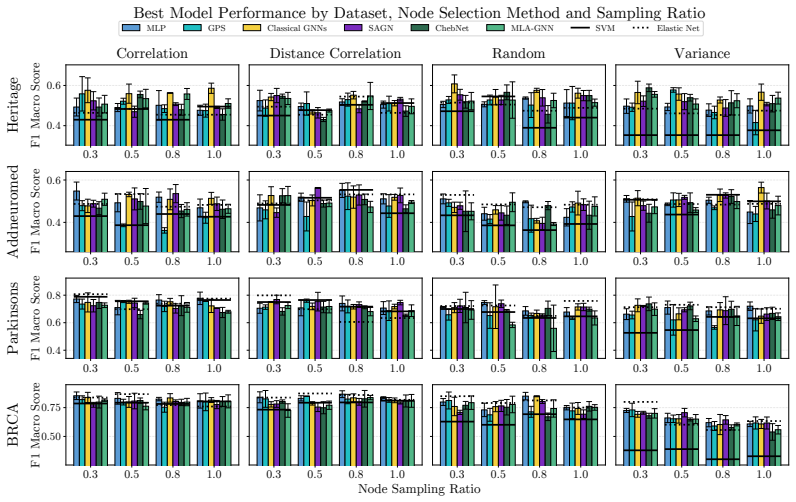
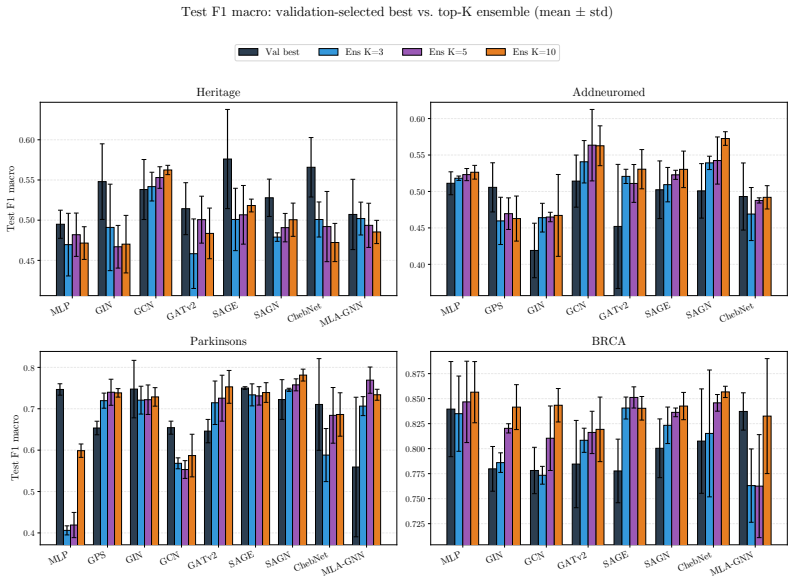
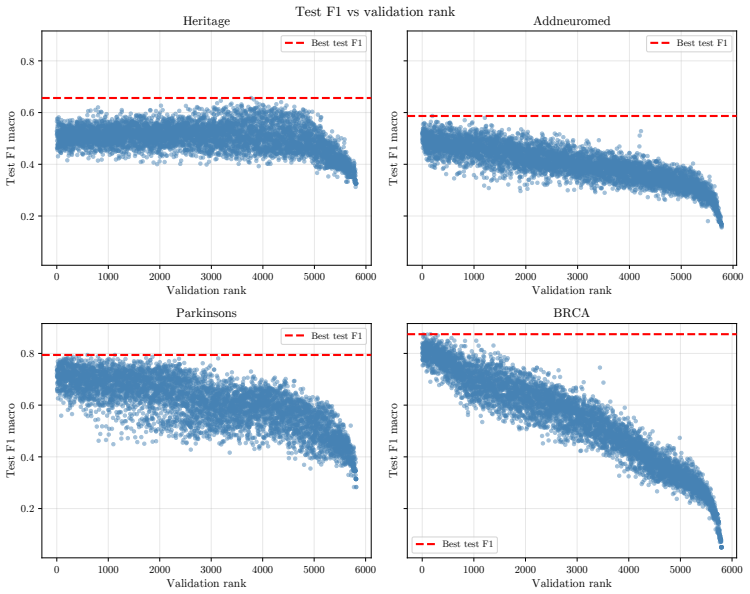
OgBench supplies an end-to-end pipeline that turns raw omics measurements into varied featured graphs, then measures the performance of GNNs against MLPs and classical baselines in the n much less than p regime. The central finding is that widely used GNNs do not reliably surpass simpler models, thereby challenging the idea that biological graph structure inherently improves predictive accuracy on such data.
What carries the argument
OgBench, a modular benchmarking platform that generates families of featured graphs from raw omics data and runs standardized graph-level prediction experiments.
If this is right
- Simpler non-graph models should be included as strong baselines when applying machine learning to omics graphs.
- New architectures for biological data must explicitly address the low-sample high-node regime rather than borrowing from dense-graph settings.
- The value of incorporating graph structure from omics measurements requires fresh validation rather than being taken as given.
- Development of omics-specific GNN variants can now be guided by the standardized evaluation setup provided.
Where Pith is reading between the lines
- If feature signals dominate over topology in these tasks, then methods that learn adaptive graph construction or edge weighting from data may prove more useful than fixed biological networks.
- Extending the benchmark to additional omics modalities or multi-task settings could reveal whether the observed pattern holds beyond the current collection of datasets.
- The results suggest that practitioners might first try classical feature-based models before investing in graph-based pipelines for similar biological prediction problems.
Load-bearing premise
The graphs derived from raw omics data encode biologically meaningful relationships that matter for the downstream prediction tasks.
What would settle it
A concrete test would be to run the benchmark on its provided datasets and observe whether any GNN architecture achieves statistically higher accuracy or AUC than the MLP baseline across repeated trials with fixed hyperparameters.
Figures


read the original abstract
Graph Neural Networks (GNNs) have become the dominant framework for inductive graph-level learning. Yet most benchmarks focus on the regime $n \gg p$, where the number of graphs $n$ greatly exceeds the number of nodes per graph $p$. This overlooks biological domains such as omics, which operate in the opposite $n \ll p$ regime, characterized by large graphs of genes, transcripts, or proteins across few patient samples. This raises the question: \textit{how do GNNs perform in this low-sample, high-node omics setting?} We introduce \texttt{OgBench} (Omics-Graph Bench), the first benchmarking platform for graph-level prediction in the $n \ll p$ regime characteristic of omics data. We provide a standardized, end-to-end modular infrastructure from raw omics data to families of featured graphs with varied structural properties. We benchmark classical GNNs, as well as GNNs designed for large graphs and omics applications, alongside MLPs and machine learning baselines to establish reference performances. Our results show that widely used GNNs often do not outperform simple MLPs and classical baselines. These findings challenge the prevailing assumption that graph structure inherently adds value in this domain, fostering a critical reassessment of current learning paradigms. Ultimately, by exposing these limitations, OgBench provides the open-source ecosystem necessary for the community to develop and validate novel architectures explicitly tailored for biological graphs. The code is available at https://github.com/geometric-intelligence/ogbench.
Editorial analysis
A structured set of objections, weighed in public.
Referee Report
Summary. The manuscript introduces OgBench, a benchmarking framework for graph-level prediction with GNNs on omics data in the n ≪ p regime. It supplies a modular pipeline that converts raw omics data into families of featured graphs with controlled structural properties, then evaluates classical GNNs, large-graph GNNs, omics-specific models, MLPs, and classical ML baselines. The central empirical finding is that widely used GNNs frequently fail to outperform simple MLPs and non-graph baselines, which the authors interpret as evidence that graph structure does not inherently add value in this domain.
Significance. If the constructed graphs can be shown to encode biologically meaningful relationships, the result would be significant: it would supply the first standardized benchmark exposing limitations of current GNN architectures on high-dimensional biological graphs and would motivate the development of new inductive biases tailored to the omics setting. The open-source modular infrastructure is a concrete contribution that could accelerate such work. The current evidence, however, rests on unvalidated graph constructions, which weakens the force of the claim that graph structure itself is unhelpful.
major comments (2)
- [§3] §3 (Graph Construction): The manuscript states that families of graphs are built from raw omics data with varied structural properties, yet supplies no external validation—such as overlap with curated pathway databases, gene-set enrichment statistics, or expert review—that the retained edges capture biologically relevant interactions rather than statistical artifacts or arbitrary thresholds. Because the central claim (that GNNs add no value over MLPs) presupposes that the graphs encode task-relevant structure, this omission is load-bearing.
- [§5] §5 (Experimental Results): The reported comparisons lack details on statistical testing (e.g., paired t-tests or Wilcoxon tests across random seeds), exact sample sizes per dataset, and the precise graph-construction hyperparameters (thresholds, feature-selection criteria). Without these, it is impossible to judge whether the observed parity or underperformance of GNNs is robust or an artifact of particular dataset realizations.
minor comments (2)
- [Abstract] The abstract claims the code is available at the cited GitHub link, but the manuscript should include a permanent archive link (e.g., Zenodo DOI) to satisfy reproducibility standards.
- [Tables in §5] Notation for the n ≪ p regime is introduced in the abstract but not consistently reused in the experimental tables; adding a column or row label that explicitly flags this regime would improve clarity.
Simulated Author's Rebuttal
We thank the referee for their constructive and detailed comments on our manuscript. We address each major comment point by point below, indicating where we agree that revisions are warranted to strengthen the work.
read point-by-point responses
-
Referee: [§3] §3 (Graph Construction): The manuscript states that families of graphs are built from raw omics data with varied structural properties, yet supplies no external validation—such as overlap with curated pathway databases, gene-set enrichment statistics, or expert review—that the retained edges capture biologically relevant interactions rather than statistical artifacts or arbitrary thresholds. Because the central claim (that GNNs add no value over MLPs) presupposes that the graphs encode task-relevant structure, this omission is load-bearing.
Authors: We thank the referee for this important observation. OgBench is constructed to provide modular control over graph families with differing structural properties (e.g., via varying correlation thresholds and feature-selection criteria) precisely so that the community can test the value of graph structure under different assumptions in the n ≪ p regime. We acknowledge that the absence of external validation against pathway databases or enrichment statistics makes it harder to interpret whether the reported parity between GNNs and MLPs reflects the limited utility of graph structure or the limitations of existing GNN inductive biases. In the revised manuscript we will add quantitative validation: overlap statistics with KEGG and Reactome pathways, as well as gene-set enrichment results for the retained edges across the graph families. These additions will be presented in a new subsection of §3 together with a discussion of how the validation affects the strength of the central claim. revision: yes
-
Referee: [§5] §5 (Experimental Results): The reported comparisons lack details on statistical testing (e.g., paired t-tests or Wilcoxon tests across random seeds), exact sample sizes per dataset, and the precise graph-construction hyperparameters (thresholds, feature-selection criteria). Without these, it is impossible to judge whether the observed parity or underperformance of GNNs is robust or an artifact of particular dataset realizations.
Authors: We agree that these experimental details are necessary for reproducibility and for readers to assess robustness. The current version reports mean performance but does not include formal statistical comparisons or the exact construction hyperparameters. In the revised manuscript we will expand §5 (and the supplementary material) to report: (i) paired t-tests and Wilcoxon signed-rank tests across at least five random seeds for all model comparisons, (ii) the precise values of n (number of graphs) and p (number of nodes) for every dataset, and (iii) the full list of graph-construction hyperparameters, including correlation thresholds, p-value cutoffs, and feature-selection procedures. These additions will allow direct evaluation of whether the observed results are stable across realizations. revision: yes
Circularity Check
Empirical benchmark with no load-bearing derivations or self-referential reductions
full rationale
The manuscript introduces OgBench as an empirical evaluation framework for GNNs on omics data in the n ≪ p regime. It constructs graph families from raw data, runs standard GNN and MLP baselines on public datasets, and reports comparative performance numbers. No equations, uniqueness theorems, fitted parameters renamed as predictions, or self-citation chains appear in the derivation of the central claim. The results are direct statistical comparisons against external open-source implementations and classical baselines; the claim that GNNs often fail to outperform MLPs follows from those measurements rather than from any internal redefinition or tautological reduction. The paper is therefore self-contained against external benchmarks.
Axiom & Free-Parameter Ledger
axioms (1)
- domain assumption Omics measurements can be converted into graphs whose nodes are genes or proteins and whose edges reflect known or inferred biological relationships.
invented entities (1)
-
OgBench framework
no independent evidence
discussion (0)
Sign in with ORCID, Apple, or X to comment. Anyone can read and Pith papers without signing in.