Tabular foundation models for robust calibration of near-infrared chemical sensing data
Pith reviewed 2026-05-22 00:30 UTC · model grok-4.3
The pith
Preprocessing-optimized TabPFN outperforms PLS and CNNs for NIR chemical sensing calibration while matching Ridge.
A machine-rendered reading of the paper's core claim, the machinery that carries it, and where it could break.
Core claim
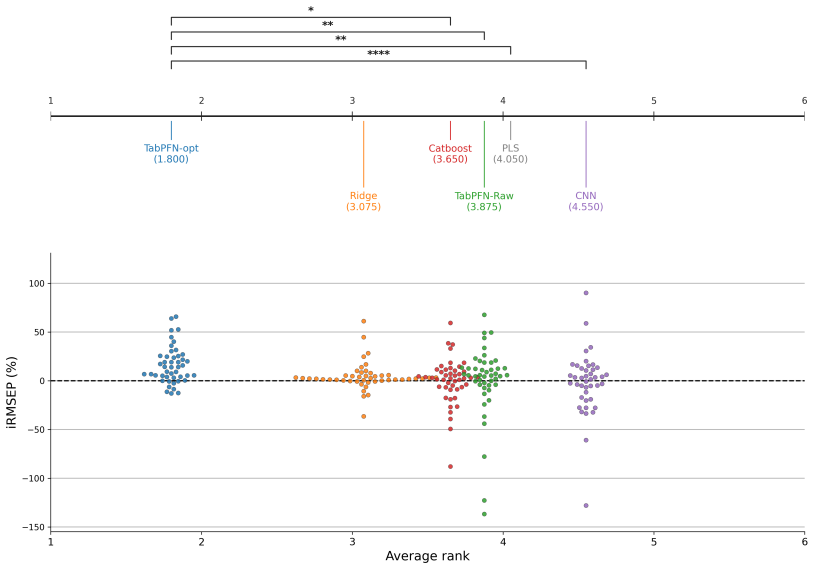
Preprocessing-optimized TabPFN achieves the best overall average rank in regression across 54 NIR tasks and significantly outperforms PLS, CatBoost, TabPFN on raw spectra, and CNN-1D, while remaining statistically comparable to Ridge. In the 12 classification tasks, TabPFN applied directly to raw spectra yields the best average rank with performance close to its optimized variant. Robustness checks confirm strong average predictive performance, yet the advantage narrows on spectral outliers and extrapolated samples where classical chemometric models stay competitive.
What carries the argument
TabPFN, a tabular foundation model that performs direct inference on spectral data (raw or preprocessed) via prior-data fitting to manage high-dimensional collinear inputs without task-specific retraining.
If this is right
- Tabular foundation models can serve as a practical addition to chemometric pipelines for small- to medium-sized NIR calibration sets.
- Preprocessing selection remains valuable for TabPFN in regression even though the model is foundation-based.
- Classical methods like Ridge retain an edge when spectral outliers or extrapolation dominate the test conditions.
- Direct raw-spectrum use of TabPFN may simplify workflows in classification tasks for NIR data.
Where Pith is reading between the lines
- Adding spectroscopy-specific priors to foundation models could narrow the performance gap on outliers and extrapolated samples.
- Uncertainty estimates from TabPFN could guide safer decisions in real-time chemical sensing deployments.
- Broader testing across more varied NIR instruments and sample types would test whether the observed ranking generalizes.
Load-bearing premise
The 66 NIR datasets and the external-test validation framework represent typical practical deployment conditions that include spectral outliers and extrapolation beyond the calibration domain.
What would settle it
New NIR datasets containing more spectral outliers and clear extrapolation cases where TabPFN no longer maintains its performance edge over Ridge or PLS.
Figures


read the original abstract
Near-infrared spectroscopy is increasingly used as a rapid, non-destructive chemical sensing technology for the analysis of food, pharmaceutical, biological, and environmental samples. However, the practical deployment of NIR sensors still depends on calibration models able to handle high-dimensional, collinear spectra, limited sample sizes, preprocessing dependence, spectral outliers, and extrapolation beyond the calibration domain. Here, we evaluate whether tabular foundation models can provide a new calibration strategy for NIR chemical sensing. We benchmark TabPFN on 66 NIR datasets covering 54 regression and 12 classification tasks, and compare direct inference on raw spectra with preprocessing-optimized inference against PLS/PLS-DA, Ridge, Catboost, and one-dimensional convolutional neural networks. The study uses a unified validation framework in which preprocessing and model selection are performed exclusively on calibration data before external test evaluation. In regression, preprocessing-optimized TabPFN achieves the best overall average rank and significantly outperforms PLS, CatBoost, TabPFN on raw spectra, and CNN-1D, while remaining statistically comparable to Ridge. In classification, TabPFN applied directly to raw spectra provides the best average rank, with performance close to the optimized variant. Robustness analyses show that TabPFN provides strong average predictive performance but that its advantage decreases on spectral outliers and extrapolated samples, where classical chemometric models remain competitive. These results suggest that tabular foundation models can complement established chemometric workflows for NIR chemical sensing, especially in small- to medium-sized calibration settings, while highlighting the need for spectroscopy-specific priors and uncertainty-aware deployment strategies.
Editorial analysis
A structured set of objections, weighed in public.
Referee Report
Summary. The manuscript evaluates TabPFN, a tabular foundation model, as a calibration approach for near-infrared (NIR) chemical sensing. It benchmarks preprocessing-optimized TabPFN and direct inference on raw spectra against PLS/PLS-DA, Ridge, CatBoost, and 1D-CNN across 66 NIR datasets (54 regression and 12 classification tasks). A unified validation framework keeps all preprocessing and model selection inside the calibration set prior to external test evaluation. In regression, preprocessing-optimized TabPFN obtains the best average rank and significantly outperforms PLS, CatBoost, raw TabPFN, and CNN-1D while remaining comparable to Ridge. In classification, raw TabPFN yields the best average rank. Robustness checks indicate that TabPFN advantages shrink on spectral outliers and extrapolated samples, where classical models stay competitive. The work concludes that tabular foundation models can complement chemometric workflows, especially for small- to medium-sized calibrations.
Significance. If the benchmark collection adequately represents deployment conditions, the results indicate that TabPFN can serve as a practical addition to established NIR calibration pipelines, particularly when sample sizes are limited. The strict internal validation protocol and explicit robustness analyses on outliers/extrapolation constitute clear methodological strengths that increase the reliability of the reported rankings. The study supplies a large-scale, reproducible-style empirical comparison that could guide future spectroscopy-specific adaptations of foundation models.
major comments (1)
- [Robustness analyses] Robustness analyses section: the paper correctly notes that TabPFN advantages decrease on spectral outliers and extrapolated samples, yet provides no quantitative breakdown of how many external-test samples (or what fraction per dataset) fall into these categories across the 66 NIR collections. Without this information it remains unclear whether the headline average-rank result is driven mainly by easier in-domain cases, which directly affects the strength of the practical-robustness claim made in the abstract.
minor comments (2)
- [Abstract] Abstract and results sections: the phrase 'statistically comparable to Ridge' should be accompanied by the exact test and p-value threshold used for all significance statements.
- [Methods] Dataset description: the selection criteria and source diversity of the 66 NIR datasets should be stated more explicitly to allow readers to judge representativeness.
Simulated Author's Rebuttal
We thank the referee for the constructive feedback and for highlighting the methodological strengths of our unified validation framework and robustness checks. We address the single major comment below.
read point-by-point responses
-
Referee: Robustness analyses section: the paper correctly notes that TabPFN advantages decrease on spectral outliers and extrapolated samples, yet provides no quantitative breakdown of how many external-test samples (or what fraction per dataset) fall into these categories across the 66 NIR collections. Without this information it remains unclear whether the headline average-rank result is driven mainly by easier in-domain cases, which directly affects the strength of the practical-robustness claim made in the abstract.
Authors: We agree that the current manuscript lacks an explicit quantitative summary of the number and fraction of external-test samples falling into the spectral-outlier and extrapolation categories. In the revised version we will add a supplementary table that, for each of the 66 datasets, reports (i) the absolute count and (ii) the percentage of test samples classified as outliers or as extrapolation cases according to the definitions already used in the robustness section. This addition will allow readers to gauge the relative weight of in-domain versus challenging samples in the reported average ranks and will thereby strengthen the practical-robustness interpretation without changing the main conclusions. revision: yes
Circularity Check
No circularity: pure empirical benchmarking study
full rationale
The manuscript is an empirical benchmarking study that evaluates TabPFN against PLS, Ridge, CatBoost, and CNN-1D on 66 NIR datasets using a fixed external-test validation protocol. All reported results (average ranks, statistical comparisons, robustness on outliers/extrapolation) are direct numerical outcomes of model training and inference on held-out data; no derivations, first-principles equations, or predictions are claimed. Consequently there are no load-bearing steps that reduce by construction to quantities fitted on the target data, no self-citation chains supporting uniqueness theorems, and no ansatzes or renamings of known results. The work is self-contained against external benchmarks.
Axiom & Free-Parameter Ledger
free parameters (1)
- preprocessing parameters
axioms (1)
- domain assumption The 66 NIR datasets are representative of real-world chemical sensing tasks including outliers and extrapolation.
Lean theorems connected to this paper
-
IndisputableMonolith/Cost/FunctionalEquation.leanwashburn_uniqueness_aczel unclear?
unclearRelation between the paper passage and the cited Recognition theorem.
In regression, preprocessing-optimized TabPFN achieves the best overall average rank and significantly outperforms PLS, CatBoost, TabPFN on raw spectra, and CNN-1D, while remaining statistically comparable to Ridge.
-
IndisputableMonolith/Foundation/ArrowOfTime.leanz_monotone_absolute unclear?
unclearRelation between the paper passage and the cited Recognition theorem.
Robustness analyses show that TabPFN provides strong average predictive performance but that its advantage decreases on spectral outliers and extrapolated samples
What do these tags mean?
- matches
- The paper's claim is directly supported by a theorem in the formal canon.
- supports
- The theorem supports part of the paper's argument, but the paper may add assumptions or extra steps.
- extends
- The paper goes beyond the formal theorem; the theorem is a base layer rather than the whole result.
- uses
- The paper appears to rely on the theorem as machinery.
- contradicts
- The paper's claim conflicts with a theorem or certificate in the canon.
- unclear
- Pith found a possible connection, but the passage is too broad, indirect, or ambiguous to say the theorem truly supports the claim.
Reference graph
Works this paper leans on
-
[1]
T. Akiba, S. Sano, T. Yanase, T. Ohta, and M. Koyama. Optuna: A next-generation hyperparam- eter optimization framework. InProceedings of the 25th ACM SIGKDD International Conference on Knowledge Discovery & Data Mining, KDD ’19, page 2623–2631, New York, NY, USA, 2019. Association for Computing Machinery
work page 2019
-
[2]
R. J. Barnes, M. S. Dhanoa, and S. J. Lister. Standard normal variate transformation and de- trending of near-infrared diffuse reflectance spectra.Applied Spectroscopy, 43(5):772–777, 1989
work page 1989
-
[3]
J. Bergstra, R. Bardenet, Y. Bengio, and B. Kégl. Algorithms for hyper-parameter optimization. In J. Shawe-Taylor, R. Zemel, P. Bartlett, F. Pereira, and K. Weinberger, editors,Advances in Neural Information Processing Systems, volume 24. Curran Associates, Inc., 2011
work page 2011
-
[4]
G. Beurier, D. Cornet, and L. Rouan. Nirs4all: Open spectroscopy for everyone, 2026
work page 2026
- [5]
-
[6]
P. H. C. Eilers. A perfect smoother.Analytical Chemistry, 75(14):3631–3636, 2003. PMID: 14570219
work page 2003
-
[7]
N. Erickson, J. Mueller, A. Shirkov, H. Zhang, P. Larroy, M. Li, and A. Smola. Autogluon-tabular: Robust and accurate automl for structured data, 2020
work page 2020
-
[8]
M. Ferrari and V. Quaresima. A brief review on the history of human functional near-infrared spectroscopy (fNIRS) development and fields of application.NeuroImage, 63(2):921–935, 2012
work page 2012
- [9]
-
[10]
R. e. a. Galvão. A method for calibration and validation subset partitioning.Talanta, 67(4):736– 740, 2005
work page 2005
-
[11]
TabPFN-2.5: Advancing the State of the Art in Tabular Foundation Models
L. Grinsztajn, K. Flöge, O. Key, F. Birkel, P. Jund, B. Roof, B. Jäger, D. Safaric, S. Alessi, A. Hayler, M. Manium, R. Yu, F. Jablonski, S. B. Hoo, A. Garg, J. Robertson, M. Bühler, V. Moroshan, L. Purucker, C. Cornu, L. C. Wehrhahn, A. Bonetto, B. Schölkopf, S. Gambhir, N. Hollmann, and F. Hutter. TabPFN-2.5: Advancing the State of the Art in Tabular Fo...
work page internal anchor Pith review Pith/arXiv arXiv 2026
-
[12]
L. Grinsztajn, E. Oyallon, and G. Varoquaux. Why do tree-based models still outperform deep learning on tabular data?, 2022
work page 2022
-
[13]
A. E. Hoerl and R. W. Kennard. Ridge regression: Biased estimation for nonorthogonal problems. Technometrics, 12(1):55–67, 1970
work page 1970
-
[14]
N. Hollmann et al. Accurate predictions on small data with a tabular foundation model.Nature, 637:319–326, 2025
work page 2025
-
[15]
TabPFN: A Transformer That Solves Small Tabular Classification Problems in a Second
N. Hollmann, S. Müller, K. Eggensperger, and F. Hutter. TabPFN: A Transformer That Solves Small Tabular Classification Problems in a Second, Sept. 2023. arXiv:2207.01848 [cs]. 20
work page internal anchor Pith review Pith/arXiv arXiv 2023
- [16]
-
[17]
M. E. Houngbo, L. Desfontaines, J.-L. Diman, G. Arnau, C. Mestres, F. Davrieux, L. Rouan, G. Beurier, C. Marie-Magdeleine, K. Meghar, E. O. Alamu, B. O. Otegbayo, and D. Cornet. Convolutional neural network allows amylose content prediction in yam (dioscorea alata l.) flour using near infrared spectroscopy.Journal of the Science of Food and Agriculture, 1...
work page 2024
-
[18]
M. Jamrógiewicz. Application of the near-infrared spectroscopy in the pharmaceutical technology. Journal of Pharmaceutical and Biomedical Analysis, 66:1–10, July 2012
work page 2012
-
[19]
L. Li, R. Cao, L. Zhao, N. Liu, H. Sun, Z. Zhang, and Y. Sun. Near-Infrared Spectroscopy Combined with Explainable Machine Learning for Storage Time Prediction of Frozen Antarctic Krill.Foods, 14(8):1293, Jan. 2025
work page 2025
-
[20]
J. Liu, K. Yao, C. Chen, D. Li, D. Xu, R. Guo, W. Yao, Y. Deng, W. Xue, Q. Wu, T. Li, X. He, and P. K. Singh. Predicting and classifying deoxynivalenol in wheat flour using ATR-FTIR spectroscopy and explainable machine learning.Journal of Hazardous Materials, 504:141322, Feb. 2026
work page 2026
-
[21]
M. Manley. Near-infrared spectroscopy and hyperspectral imaging: non-destructive analysis of biological materials.Chem. Soc. Rev., 43:8200–8214, 2014
work page 2014
-
[22]
H. Martens and E. Stark. Extended multiplicative signal correction and spectral interference subtraction.Journal of Pharmaceutical and Biomedical Analysis, 9(8):625–635, 1991
work page 1991
-
[23]
P.Mishraetal. Deeplearningfornear-infraredspectraldatamodelling.TrAC Trends in Analytical Chemistry, 157:116804, 2022
work page 2022
-
[24]
arXiv preprint arXiv:2112.10510 , year=
S. Müller, N. Hollmann, S. P. Arango, J. Grabocka, and F. Hutter. Transformers Can Do Bayesian Inference, Aug. 2024. arXiv:2112.10510 [cs]
-
[25]
P. B. Nemenyi.Distribution-free multiple comparisons.Princeton University, 1963
work page 1963
-
[26]
B. G. Osborne. Near-infrared spectroscopy in food analysis. InEncyclopedia of Analytical Chem- istry. John Wiley & Sons, Ltd, 2006
work page 2006
-
[27]
Recentadvancementsinnirspectroscopyforassessingfoodquality.Frontiers in Nutrition, 9, 2022
R.Pandiselvametal. Recentadvancementsinnirspectroscopyforassessingfoodquality.Frontiers in Nutrition, 9, 2022
work page 2022
- [28]
-
[29]
L. Prokhorenkova, G. Gusev, A. Vorobev, A. V. Dorogush, and A. Gulin. Catboost: Unbiased boosting with categorical features, 2019
work page 2019
- [30]
-
[31]
A. Savitzky and M. Golay. Smoothing and differentiation of data by simplified least squares procedures.Analytical Chemistry, 36(8):1627–1639, 1964
work page 1964
-
[32]
B. Stenberg, R. A. Viscarra Rossel, A. M. Mouazen, and J. Wetterlind. Chapter five - visible and near infrared spectroscopy in soil science. In D. L. Sparks, editor,Advances in Agronomy, volume 107 ofAdvances in Agronomy, pages 163–215. Academic Press, 2010
work page 2010
-
[33]
A. Vaswani, N. Shazeer, N. Parmar, J. Uszkoreit, L. Jones, A. N. Gomez, L. Kaiser, and I. Polo- sukhin. Attention is all you need, 2017
work page 2017
-
[34]
T. Wang, Y. Zheng, L. Xu, and Y.-H. Yun. Comprehensive comparison on different wavelength selection methods using several near-infrared spectral datasets with different dimensionalities. Spectrochimica Acta Part A: Molecular and Biomolecular Spectroscopy, 331:125767, Apr. 2025. 21
work page 2025
-
[35]
S. Wold, H. Antti, F. Lindgren, and J. Öhman. Orthogonal signal correction of near-infrared spectra.Chemometrics and Intelligent Laboratory Systems, 44(1):175–185, 1998
work page 1998
-
[36]
S. Wold, M. Sjöström, and L. Eriksson. Pls-regression: A basic tool of chemometrics.Chemomet- rics and Intelligent Laboratory Systems, 58(2):109–130, 2001
work page 2001
-
[37]
W. Zhang, C. Kasun, Q. J. Wang, Y. Zheng, and Z. Lin. A review of machine learning for near-infrared spectroscopy.Sensors, 22(24):9764, 2022. 22 6 Supplementary Material 6.1 Theoretical foundations of PFNs 6.1.1 Statistical context LetX∈ X ⊂R d, Y∈ Ybe a random vector of features and a random vector of targets, respectively. Let us consider a classificati...
discussion (0)
Sign in with ORCID, Apple, or X to comment. Anyone can read and Pith papers without signing in.