REVIEW 2 major objections 7 minor 1 cited by
Monte Cimone v3: Where RISC-V Stands in High-Performance Computing
T0 review · 2 major / 7 minor · reviewed 2026-07-05 · glm-5.2
Pith's one-line read RISC-V HPC Node Reaches 91% of NVIDIA Grace Efficiency
desk verdict RISC-V SG2044 HPC benchmark: real progress, but comparative claims rest on a debatable software-stack choice read the letter →
The pith
A machine-rendered reading of the paper's core claim, the machinery that carries it, and where it could break.
The reading
What carries the argument
SG2044 processor with RVV 1.0 (128-bit vectors), 32 LPDDR5X memory channels, L2-cache-aware OpenMP thread pinning, HPL and STREAM benchmarks, IPMI power measurements
What would settle it
If vendor-optimized BLAS on Intel and NVIDIA systems delivers substantially more than 'slightly higher' HPL performance, the normalized gap between RISC-V and competitors would widen, undermining the claim that RISC-V is closing the gap.
Extended reading notes
Core claim
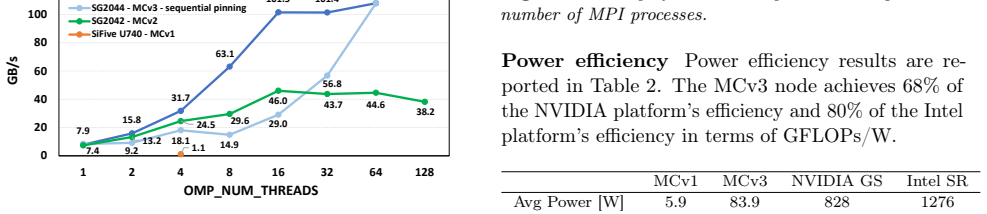
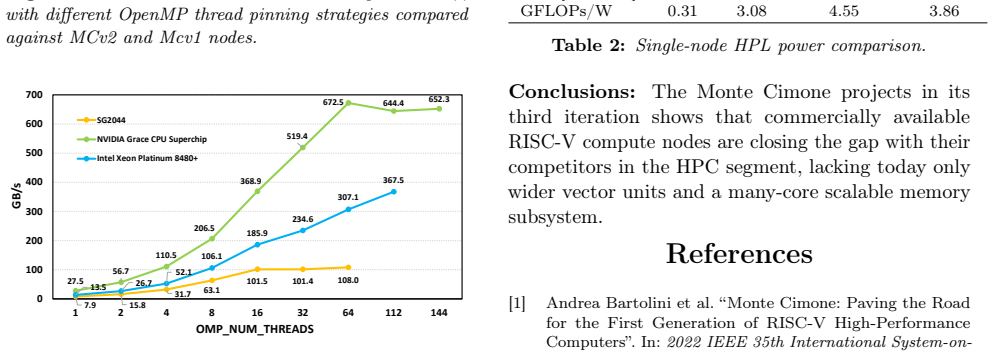
The central finding is that the SG2044-based RISC-V node, when compared on a normalized basis (vector width and clock frequency), reaches within 9% of NVIDIA Grace CPU Superchip performance and within 54% of Intel Sapphire Rapids at its peak operating efficiency point of 16 cores, while achieving 68-80% of the energy efficiency of those platforms. The SG2044 processor itself more than doubles single-core HPL performance compared to its SG2042 predecessor, and an L2-cache-aware thread pinning strategy allows the redesigned memory subsystem to reach near-peak STREAM bandwidth with only 16 threads. The paper identifies the two remaining bottlenecks for RISC-V in HPC as vector unit width and the
Load-bearing premise
The comparison uses OpenBLAS 0.3.29 on all platforms — including Intel and NVIDIA — rather than their vendor-optimized BLAS libraries, because no such library exists yet for the SG2044. This means the competitor baselines may be understated, though the paper asserts the difference is slight without quantifying it.
Editorial extensions
If this is right
- RISC-V server processors with wider vector units (e.g., 256-bit or 512-bit RVV) could close the remaining raw-performance gap to x86-64 and Arm HPC nodes, making RISC-V a viable drop-in architecture for HPC data centers.
- The 10x energy-efficiency improvement across three Monte Cimone generations suggests RISC-V HPC silicon is on a steep improvement curve that may continue as more vendors enter the server-class RISC-V space.
- The finding that 16 threads saturate the SG2044 memory subsystem implies that per-core memory bandwidth, not core count, is the current limiting factor for RISC-V HPC scaling — guiding future chip design priorities.
- Normalized performance comparisons (by vector width and clock) may become a standard reporting method for cross-architecture HPC benchmarks, complementing absolute-performance rankings.
Reading between the lines
- If vendor-optimized BLAS libraries were developed for the SG2044, the absolute HPL performance gap could narrow further, though the direction and magnitude of this effect remain unquantified in the paper.
- The LPDDR5X memory choice on SG2044 (shared with NVIDIA Grace) versus DDR5 on Intel Sapphire Rapids may partially explain why the RISC-V node compares more favorably to Grace than to Sapphire Rapids, suggesting memory technology selection matters as much as ISA for HPC workloads.
- The steep improvement from SG2042 to SG2044 across only one generation implies that RISC-V HPC competitiveness may arrive faster than the x86 ecosystem's historical evolution, since RISC-V can leverage mature process nodes and established design patterns from competitors.
Signed reviews
Editorial analysis
A structured set of objections, weighed in public.
Referee Report
Summary. This paper presents Monte Cimone v3 (MCv3), a RISC-V HPC testbed built around the SOPHGO SG2044 processor, and benchmarks it against Intel Sapphire Rapids and NVIDIA Grace CPU Superchip using HPL and STREAM with power measurements. The SG2044 more than doubles per-core performance over the SG2042 (MCv2) and achieves 3.08 GFLOPs/W, which the authors position as comparable to x86-64 and Arm servers. The paper's central comparative claim is that, when normalized by vector width and clock frequency at the 16-core peak-efficiency point, MCv3 reaches 91% of NVIDIA Grace and 46% of Intel Sapphire Rapids performance. The work provides useful empirical data on a current-generation RISC-V server processor and its integration into a production SLURM-managed cluster environment.
Significance. The paper contributes timely empirical benchmarking data for a commercially available RISC-V HPC processor (SG2044) that has not been widely characterized in the literature. The integration into a production cluster with SPACK-based modules and SLURM scheduling adds practical value beyond synthetic benchmarking. The STREAM pinning-strategy analysis (Figure 2) showing that L2-cache-aware pinning achieves near-peak bandwidth with only 16 threads is a concrete, actionable finding. The cross-architecture normalization by vector width and frequency, while requiring caveats (see major comments), provides a useful per-FMA-unit lens for comparing architecturally disparate platforms. The 10× efficiency improvement over MCv1 documents real generational progress in the RISC-V HPC space.
major comments (2)
- §Benchmark setup and measurements: The use of OpenBLAS 0.3.29 on all platforms, including Intel Sapphire Rapids and NVIDIA Grace, is the load-bearing methodological choice for the paper's headline comparative claims (Table 2 GFLOPs/W ratios of 68%/80%, and the 91%/46% normalized performance figures). The paper acknowledges that 'vendor libraries on Intel and NVIDIA systems may provide slightly higher HPL performance' but does not quantify or bound this effect. Published data consistently show that Intel MKL/oneAPI MKL can deliver 1.5–3× higher HPL throughput than OpenBLAS on Sapphire Rapids-class hardware by exploiting AMX tiles, cache-aware blocking, and NUMA topology. If MKL yields even a 2× improvement on Intel, the HPL score rises from ~4928 to ~9856 GFLOP/s, the energy efficiency rises from 4.08 to ~8.16 GFLOPs/W, and MCv3's relative efficiency drops from 80% to ~38%. This would not
- §HPL, Figure 4 and surrounding text: The normalization by vector width × clock frequency implicitly assumes an equal number of FMA units per core across all three architectures. The paper does not state or verify the FMA-unit counts for SG2044, Sapphire Rapids, or Grace. If Intel or NVIDIA cores have more FMA units per vector lane, the normalization understates their per-core compute capability and inflates MCv3's relative position. The paper should either (a) confirm equal FMA-unit counts with citations or microarchitectural documentation, or (b) include FMA units per core in the normalization denominator and recompute the ratios. Without this, the 91%/46% figures are not adequately supported.
minor comments (7)
- Abstract: 'High-Performacne' → 'High-Performance'.
- §Benchmark setup: 'measureemnt' → 'measurement'.
- Abstract: 'improves of 10x' → 'improves by 10×'.
- §HPL: 'NVIDIA 5.3×, Intel 12.9×' — specify whether these are per-core or per-MPI-process ratios and at what thread/process count.
- Table 2: The MCv1 average power of 5.9 W is inconsistent with the 83.9 W for MCv3; clarify whether the MCv1 figure is package-only or board-level, given the text states MCv1 used board instrumentation.
- Figure 4: The log-scale y-axis makes it difficult to distinguish the SG2044 and SG2042 curves at higher core counts; consider clearer legend placement.
- The paper would benefit from citing prior SG2044 evaluations (e.g., [3] is cited for STREAM but not for HPL cross-comparison) to contextualize the 'slightly higher' claim.
Simulated Author's Rebuttal
We thank the referee for the careful reading and the two substantive methodological points. Both are legitimate, and we address each below.
read point-by-point responses
-
Referee: OpenBLAS on all platforms may understate Intel/NVIDIA HPL performance by 1.5–3×, undermining the headline comparative ratios (68%/80% efficiency, 91%/46% normalized). The paper's characterization of vendor-library gains as 'slightly higher' is not supported.
Authors: The referee is correct that our use of OpenBLAS across all platforms was a deliberate methodological choice for software-stack consistency, but the language describing the potential gap as 'slightly higher' understates the effect and we will revise it. We agree that published data show Intel MKL/oneAPI can deliver substantially higher HPL throughput on Sapphire Rapids, particularly when AMX tiles are exploited. We will make the following changes in the revision: (1) Replace 'slightly higher' with a quantitative bound drawn from published Sapphire Rapids HPL results, explicitly noting that MKL with AMX can yield 1.5–3× improvement over OpenBLAS. (2) Add a sensitivity analysis showing how the GFLOPs/W ratios in Table 2 and the normalized figures in Figure 4 change under a conservative 2× MKL scaling factor for Intel (e.g., MCv3's relative efficiency to Intel would drop from 80% to ~38%). (3) Retain the OpenBLAS-based comparison as the primary result for cross-platform software consistency, but clearly label it as a same-software-stack comparison and add a secondary discussion noting the vendor-optimized upper bounds. We believe the same-software-stack comparison retains scientific value—it isolates architectural differences from software-maturity effects—but we agree it must not be presented without this caveat. We will also attempt to run oneAPI MKL on the Intel platform during the revision period to provide a direct measurement; if this is not possible within the revision window, we will include the bounded sensitivity analysis as described. revision: yes
-
Referee: Normalization by vector width × clock frequency assumes equal FMA units per core across all three architectures. The paper does not state or verify FMA-unit counts. If Intel or NVIDIA have more FMA units per vector lane, the normalization understates their per-core compute capability and inflates MCv3's relative position.
Authors: This is a valid concern. Our normalization by vector width × frequency is a first-order approximation that implicitly assumes one FMA unit per vector lane per core. We will address this in the revision as follows. First, we will document the FMA-unit counts per core for each architecture from available microarchitectural references: SG2044 (XuanTie C920) has one 128-bit RVV FMA pipe per core; Intel Sapphire Rapids has two 512-bit FMA units per core (which the '2×512 bits' vector-width entry in Table 1 already captures, so the normalization is approximately correct for Intel); NVIDIA Grace (Neoverse V2) has two 128-bit SVE pipes per core, giving 256 bits of effective vector width per core, whereas our Table 1 lists '4×128 bits' (512 bits), which appears to overcount. If the Grace figure should be 256 bits rather than 512 bits, the normalization denominator for Grace is too large, meaning MCv3's 91% figure relative to Grace would actually be overstated and should be revised downward. We will verify the Neoverse V2 SVE pipe configuration against ARM documentation and recompute the normalized ratios accordingly. We will also add an explicit column in Table 1 for 'FMA units per core' and 'effective FMA width per core' to make the normalization transparent and auditable. We note that the SG2044's exact microarchitectural details (FMA pipe count, whether the 128-bit vector unit can sustain one FMA per cycle) are not fully documented in public sources; we will state this limitation explicitly. If we cannot confirm the SG2044 FMA-unit count, we will add a caveat that the normalization for MCv3 assumes one FMA per cycle per core and that this assumption is based on the C920 architecture but not independently verified by microbenchmarking. revision: partial
Circularity Check
No circularity found: empirical benchmarking study with self-contained measurements
full rationale
This is an empirical benchmarking study with no theoretical derivation chain that could be circular. The headline claims (3.08 GFLOPs/W, 46%/91% normalized performance ratios) are computed directly from measured HPL performance numbers and IPMI power readings on three physical platforms. No step in the chain reduces to its inputs by construction. The two self-citations ([1] for MCv1, [2] for MCv2) provide historical baseline numbers for comparison (e.g., the 10x improvement over MCv1), but the current paper's results do not depend on those prior papers being true in any circular sense — they are independent measurements on different hardware. The OpenBLAS-on-all-platforms choice is a legitimate correctness/fairness concern (vendor BLAS could substantially change the comparative ratios), but it is not circularity: the paper explicitly acknowledges the choice and its direction of effect, and the measurements themselves are genuine. No fitted parameters are renamed as predictions, no uniqueness theorem is invoked, and no ansatz is smuggled through self-citation.
Assumptions & free parameters
assumptions (3)
- domain assumption HPL and STREAM benchmarks are representative proxies for HPC workloads.
- domain assumption IPMI power readings provide an accurate platform-level power estimate for efficiency calculations.
- ad hoc to paper OpenBLAS performance on Intel/NVIDIA is 'slightly lower' than vendor libraries, not substantially lower.
Cite this review
Pith. "Pith review of Monte Cimone v3: Where RISC-V Stands in High-Performance Computing." pith.science (2026). https://pith.science/paper/2WJNGJPC
@misc{pith2026260522831,
  author       = {Pith},
  title        = {Pith review of: Monte Cimone v3: Where RISC-V Stands in High-Performance Computing},
  year         = {2026},
  howpublished = {\url{https://pith.science/paper/2WJNGJPC}},
  note         = {Machine review of arXiv:2605.22831}
}
read the original abstract
The Monte Cimone project provides a RISC-V testbed for High-Performacne Computing cluster. This paper presents Monte Cimone v3 (MCv3), the third iteration of the Monte Cimone RISC-V HPC cluster, integrating the SOPHGO Sophon SG2044 processor, an evolution of the SG2042 used in MCv2. We characterize MCv3 using HPL and STREAM benchmarks coupled with power measurements, and compare it against two reference platforms: the Intel Xeon Platinum 8480+(Sapphire Rapids) and the NVIDIA Grace CPU Superchip. Our results show that the SG2044 more than doubles single-core performance and improves scalability compared to SG2042. MCv3 achieves an energy efficiency of 3.08GFLOPs/W which improves of 10x w.r.t. MCv1 and is in the range of x86-64 and Arm servers. On pure performance when normalized on the SIMD/Vector length MCv3 on its peak efficiency point (16 cores) achieves 46% performance of Intel Sapphire Rapids server and 91% performance of NVIDIA Grace CPU superchip.
Figures


Figures from the paper (1 more)
Forward citations
Cited by 1 Pith paper
-
RVANNS: Mixed-Precision Indexing and Locality-Aware Graph Traversal on RISC-V
A RISC-V vector-optimized ANNS engine combines a mixed-precision vector encoding (MPMI) with traversal-aware graph reordering (ROrder) to cut memory traffic and improve cache locality.
Reference graph
Works this paper leans on
-
[1]
Monte Cimone: Paving the Road for the First Generation of RISC-V High-Performance Computers
Andrea Bartolini et al. “Monte Cimone: Paving the Road for the First Generation of RISC-V High-Performance Computers”. In:2022 IEEE 35th International System-on- Chip Conference (SOCC). 2022, pp. 1–6.doi: 10.1109/ SOCC56010.2022.9908096
-
[2]
Monte Cimone v2: HPC RISC-V Cluster Evaluation and Optimization
Emanuele Venieri et al. “Monte Cimone v2: HPC RISC-V Cluster Evaluation and Optimization”. In:High Perfor- mance Computing. Ed. by Sarah Neuwirth et al. Cham: Springer Nature Switzerland, 2026, pp. 576–585.isbn: 978- 3-032-07612-0
work page 2026
-
[3]
Is RISC-V ready for High Performance Com- puting? An evaluation of the Sophon SG2044
Nick Brown. “Is RISC-V ready for High Performance Com- puting? An evaluation of the Sophon SG2044”. In:Pro- ceedings of the SC ’25 Workshops. SC Workshops ’25. As- sociation for Computing Machinery, 2025, pp. 1703–1711. isbn: 9798400718717.doi: 10.1145/3731599.3767531.url: https://doi.org/10.1145/3731599.3767531. 2 RISC-V Summit Europe, Bologna, 8-12th June 2026
Reviewed July 5, 2026 · model on record in the stance chip above.
Discussion (0). Continue with ORCID to comment.