ScaleMAP: Preserving Local Density and Neighborhood Structure in Low-Dimensional Embeddings
Pith reviewed 2026-06-29 08:16 UTC · model grok-4.3
The pith
Dividing pairwise embedding displacements by the geometric mean of local radii preserves both density and neighborhood structure.
A machine-rendered reading of the paper's core claim, the machinery that carries it, and where it could break.
Core claim
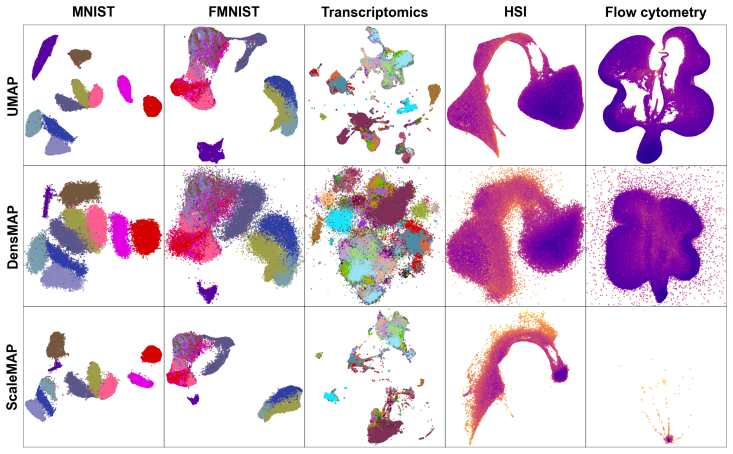
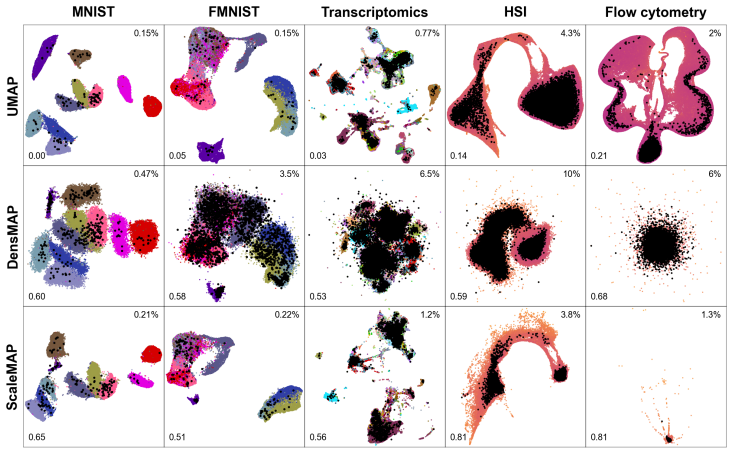
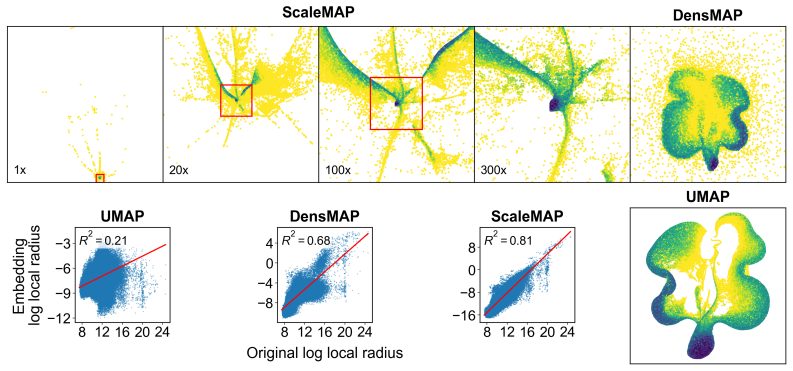
ScaleMAP modifies the embedding objective by re-scaling each pairwise displacement term with the inverse geometric mean of the original-space local radii at its two endpoints. This single modification recovers sparse connecting structures in transcriptomic data that UMAP collapses and represents density variation across 17 orders of magnitude in flow-cytometry data, all while matching standard UMAP performance on neighborhood metrics and DensMAP performance on density metrics. The same scaling principle applied to PaCMAP produces consistent density gains.
What carries the argument
the scale-adjusted displacement: each pairwise embedding move is divided by the geometric mean of the two points' local radii estimated in the original high-dimensional space
If this is right
- Sparse bridges between transitioning cell populations in transcriptomic data are recovered rather than collapsed.
- Density structure spanning 17 orders of magnitude is represented faithfully in flow-cytometry embeddings.
- Neighborhood preservation metrics remain at UMAP levels while density metrics match DensMAP.
- The same scaling principle improves density preservation when applied to PaCMAP.
Where Pith is reading between the lines
- The change-of-variables approach may extend to other graph-based embedding algorithms that currently normalize distances.
- Multi-scale scientific visualizations could benefit when both dense clusters and rare connecting structures must be shown simultaneously.
- Synthetic benchmarks with explicitly controlled local radii would provide a direct test of whether the geometric-mean correction fully restores scale.
Load-bearing premise
Dividing displacements by the geometric mean of local radii re-injects scale information as a change of variables that the attraction-repulsion forces can accommodate without introducing uncorrectable new distortions, and that those local radii can be estimated reliably from the input data.
What would settle it
A controlled dataset containing known sparse bridges or narrow density features where ScaleMAP either collapses the bridges like UMAP or scatters points away from neighborhoods like DensMAP would refute the central claim.
Figures


read the original abstract
Nonlinear dimensionality-reduction methods such as UMAP and PaCMAP adaptively normalize local distances during graph construction, erasing neighborhood scale from the data. This distorts more than relative cluster sizes: sparse structures like bridges between transitioning cell types and narrow spectral spikes in hyperspectral images can be suppressed or lost entirely. DensMAP adds a density penalty to correct this, but this penalty competes with UMAP's attraction-repulsion forces, scattering points far from their neighborhoods. ScaleMAP takes a different approach: each pairwise embedding displacement is divided by the geometric mean of the two endpoints' original-space local radii, re-injecting scale information as a change of variables rather than as a competing objective. Across standard benchmarks and scientific datasets from transcriptomics, hyperspectral imaging, and flow cytometry, ScaleMAP matches DensMAP on density preservation while maintaining UMAP-level neighborhood preservation. In transcriptomic data, it recovers sparse bridges between cell populations that UMAP collapses; in flow cytometry, it faithfully represents density structure across 17 orders of magnitude. The same principle applied to PaCMAP yields consistently improved density preservation, suggesting the approach generalizes beyond UMAP.
Editorial analysis
A structured set of objections, weighed in public.
Referee Report
Summary. The paper introduces ScaleMAP, which modifies the UMAP (and PaCMAP) embedding update by dividing each pairwise displacement by the geometric mean of the two points' original-space local radii. This is presented as a change-of-variables approach to re-inject scale information, avoiding the competing density penalty used in DensMAP. The central empirical claim is that ScaleMAP matches DensMAP on density preservation metrics while retaining UMAP-level neighborhood preservation scores on standard benchmarks plus transcriptomics, hyperspectral imaging, and flow-cytometry datasets, recovering sparse bridges and representing density variation over 17 orders of magnitude.
Significance. If the normalization is shown to be a low-distortion change of variables and the reported empirical matches are robust, the method would offer a lightweight way to preserve both local scale and neighborhoods in nonlinear embeddings. This would be relevant for scientific applications where relative densities and sparse connecting structures carry biological or physical meaning.
major comments (3)
- [ScaleMAP update rule (method description)] The load-bearing assumption—that dividing embedding displacements by the geometric mean of high-dimensional local radii re-injects scale as a distortion-free change of variables whose fixed point still recovers both neighborhood structure and density—is stated in the abstract but receives no derivation or gradient analysis showing invariance or bounded distortion of the attraction-repulsion equilibrium.
- [Experimental validation and radius estimation] Local-radius estimation (typically from kNN distances) is sensitive to the choice of k and to concentration effects; any error propagates directly into the normalized forces, yet no ablation or sensitivity analysis on radius estimation is reported to support the claim that the optimizer corrects resulting distortions.
- [Results on benchmarks and domain datasets] The abstract asserts that ScaleMAP matches DensMAP on density preservation while maintaining UMAP neighborhood scores, but the reported results lack accompanying details on benchmark definitions, statistical controls, error-bar reporting, or exclusion rules, preventing verification of the cross-method comparison.
Simulated Author's Rebuttal
We thank the referee for their constructive comments, which highlight areas where the manuscript can be strengthened. We address each major comment below and will incorporate revisions accordingly.
read point-by-point responses
-
Referee: The load-bearing assumption—that dividing embedding displacements by the geometric mean of high-dimensional local radii re-injects scale as a distortion-free change of variables whose fixed point still recovers both neighborhood structure and density—is stated in the abstract but receives no derivation or gradient analysis showing invariance or bounded distortion of the attraction-repulsion equilibrium.
Authors: We agree that a formal derivation would strengthen the presentation. In the revised manuscript we will add a new subsection (Methods 3.2) that derives the normalized update rule as a local change of variables, shows that the fixed point of the attraction-repulsion equilibrium is preserved under consistent radius scaling, and provides a first-order analysis of the distortion introduced when radius estimates are noisy. This will replace the current informal description. revision: yes
-
Referee: Local-radius estimation (typically from kNN distances) is sensitive to the choice of k and to concentration effects; any error propagates directly into the normalized forces, yet no ablation or sensitivity analysis on radius estimation is reported to support the claim that the optimizer corrects resulting distortions.
Authors: We will add an ablation study (new Figure 7 and accompanying text) that varies k from 5 to 50 on the MNIST, transcriptomics, and flow-cytometry datasets, reporting both density and neighborhood metrics with standard deviations over 10 random seeds. The results will quantify the sensitivity and show that the optimizer largely compensates for moderate estimation errors within the range of k typically used for UMAP. revision: yes
-
Referee: The abstract asserts that ScaleMAP matches DensMAP on density preservation while maintaining UMAP neighborhood scores, but the reported results lack accompanying details on benchmark definitions, statistical controls, error-bar reporting, or exclusion rules, preventing verification of the cross-method comparison.
Authors: We will expand Section 4 to include: (i) precise definitions and formulas for all neighborhood and density metrics, (ii) the number of independent runs (10) and random seeds used, (iii) error bars as mean ± one standard deviation, and (iv) explicit exclusion criteria (none applied beyond standard preprocessing). Updated tables will report these statistics for all methods and datasets. revision: yes
Circularity Check
No significant circularity; algorithmic modification validated empirically without self-referential reduction
full rationale
The paper introduces ScaleMAP by directly modifying the UMAP embedding update to divide pairwise displacements by the geometric mean of high-dimensional local radii, framing this as a change of variables to re-inject scale. No equations, performance claims, or derivations reduce reported results (density or neighborhood preservation) to quantities defined by the method's own fitted parameters or by self-citation chains. Local radius estimation is taken from the input data via standard kNN, and empirical results on benchmarks are presented as external validation rather than forced by construction. The central claim remains an independent algorithmic proposal with no load-bearing self-citations, uniqueness theorems, or ansatzes imported from prior author work.
Axiom & Free-Parameter Ledger
axioms (1)
- domain assumption Local radii estimated from the high-dimensional data correctly capture the neighborhood scale that adaptive normalization erases.
Reference graph
Works this paper leans on
-
[1]
UMAP: Uniform Manifold Approximation and Projection for Dimension Reduction
L. McInnes, J. Healy, and J. Melville. UMAP: Uniform manifold approximation and projection for dimension reduction.arXiv preprint arXiv:1802.03426, 2018
work page internal anchor Pith review Pith/arXiv arXiv 2018
-
[2]
van der Maaten and G
L. van der Maaten and G. Hinton. Visualizing data using t-SNE.Journal of Machine Learning Research, 9:2579–2605, 2008
2008
-
[3]
Y . Wang, H. Huang, C. Rudin, and Y . Shaposhnik. Understanding how dimension reduction tools work: An empirical approach to deciphering t-SNE, UMAP, TriMap, and PaCMAP for data visualization.Journal of Machine Learning Research, 22(201):1–73, 2021
2021
-
[4]
A. Narayan, B. Berger, and H. Cho. Assessing single-cell transcriptomic variability through density-preserving data visualization.Nature Biotechnology, 39:765–774, 2021. doi:10.1038/s41587-020-00801-7
-
[5]
M. Belkin and P. Niyogi. Laplacian eigenmaps for dimensionality reduction and data represen- tation.Neural Computation, 15(6):1373–1396, 2003. doi:10.1162/089976603321780317
-
[6]
LeCun, C
Y . LeCun, C. Cortes, and C. J. C. Burges. The MNIST database of handwritten digits. Computer Vision Data Foundation mirror. https://github.com/cvdfoundation/mnist. Accessed May 7, 2026
2026
-
[7]
H. Xiao, K. Rasul, and R. V ollgraf. Fashion-MNIST: A novel image dataset for benchmarking machine learning algorithms.arXiv preprint arXiv:1708.07747, 2017
work page internal anchor Pith review Pith/arXiv arXiv 2017
-
[8]
S. A. Nene, S. K. Nayar, and H. Murase. Columbia Object Image Library (COIL-20). Technical Report CUCS-005-96, Department of Computer Science, Columbia University, February 1996
1996
-
[9]
Smithsonian 3D Digitization, National Museum of Natural History, Paleobiology Department, Record ID nmnhpaleobiology_3447777
Smithsonian Institution.Mammuthus primigenius(Blumbach). Smithsonian 3D Digitization, National Museum of Natural History, Paleobiology Department, Record ID nmnhpaleobiology_3447777. https://3d.si.edu/object/3d/ mammuthus-primigenius-blumbach:341c96cd-f967-4540-8ed1-d3fc56d31f12 . Accessed May 7, 2026
2026
-
[10]
Tabula Sapiens Consortium. The Tabula Sapiens: A multiple-organ, single-cell transcriptomic atlas of humans.Science, 376(6594):eabl4896, 2022. doi:10.1126/science.abl4896. 11
-
[11]
R. Lopez, J. Regier, M. B. Cole, M. I. Jordan, and N. Yosef. Deep generative modeling for single-cell transcriptomics.Nature Methods, 15(12):1053–1058, 2018. doi:10.1038/s41592- 018-0229-2
-
[12]
C. H. Camp Jr., Y . J. Lee, J. M. Heddleston, C. M. Hartshorn, A. R. Hight Walker, J. N. Rich, J. D. Lathia, and M. T. Cicerone. High-speed coherent Raman fingerprint imaging of biological tissues.Nature Photonics, 8:627–634, 2014. doi:10.1038/nphoton.2014.145
-
[13]
R. Poorna, W.-W. Chen, A. Germond, P. Qiu, and M. T. Cicerone. Toward gene-correlated spatially resolved metabolomics with fingerprint coherent Raman imaging.The Journal of Physical Chemistry B, 127(25):5576–5587, 2023. doi:10.1021/acs.jpcb.3c01446
-
[14]
P. Qiu, E. F. Simonds, S. C. Bendall, K. D. Gibbs Jr., R. V . Bruggner, M. D. Linderman, K. Sachs, G. P. Nolan, and S. K. Plevritis. Extracting a cellular hierarchy from high-dimensional cytometry data with SPADE.Nature Biotechnology, 29(10):886–891, 2011. doi:10.1038/nbt.1991. 12 A Appendix A.1 Reproducibility information k= 15nearest neighbors were used...
discussion (0)
Sign in with ORCID, Apple, or X to comment. Anyone can read and Pith papers without signing in.