The Impact of Temporal Granularity on Socio-Demographic Inference from Household Load Profiles
Pith reviewed 2026-06-28 10:58 UTC · model grok-4.3
The pith
Coarsening household load profiles from 15 minutes to 1 hour or from 1 day to 7 days leaves socio-demographic prediction accuracy largely unchanged.
A machine-rendered reading of the paper's core claim, the machinery that carries it, and where it could break.
Core claim
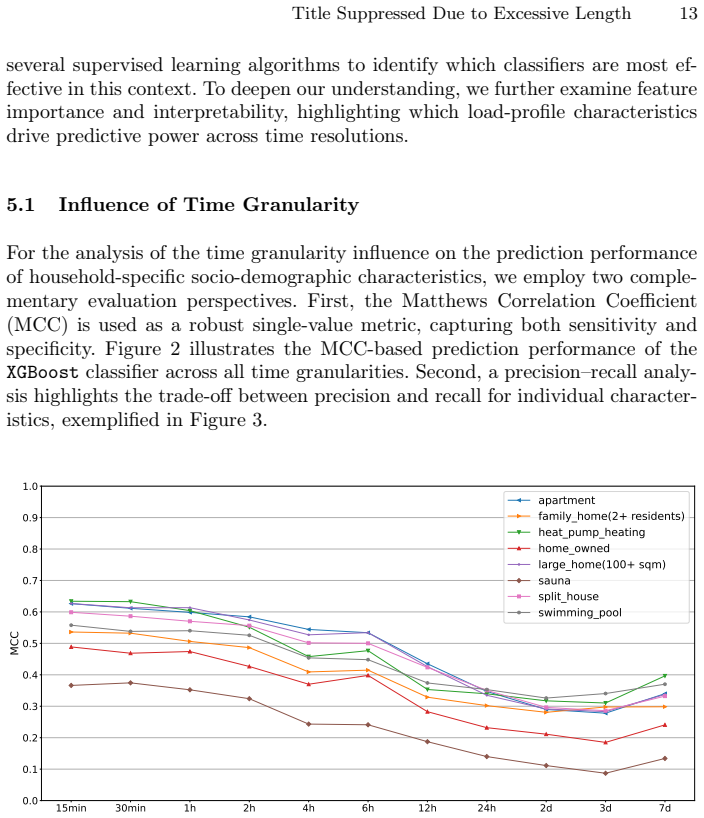
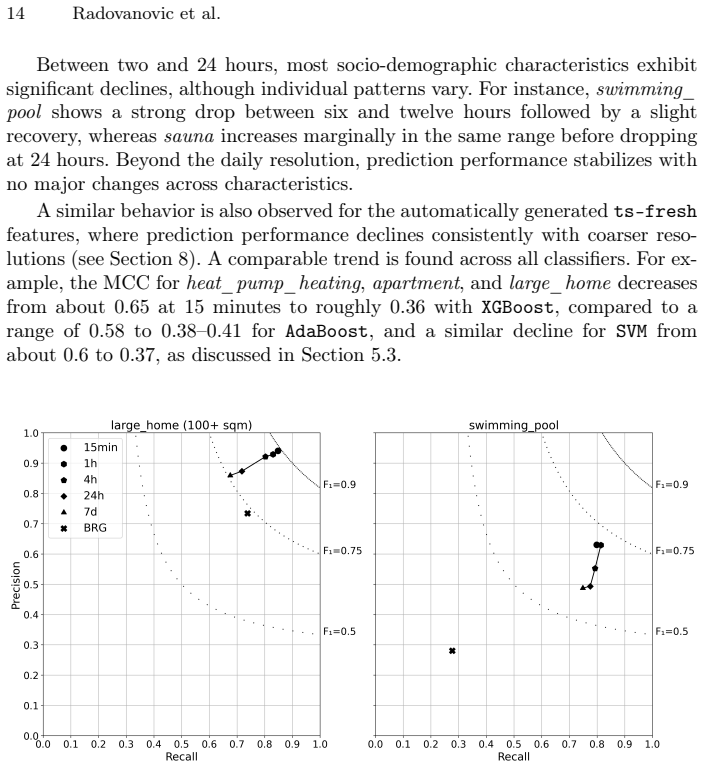
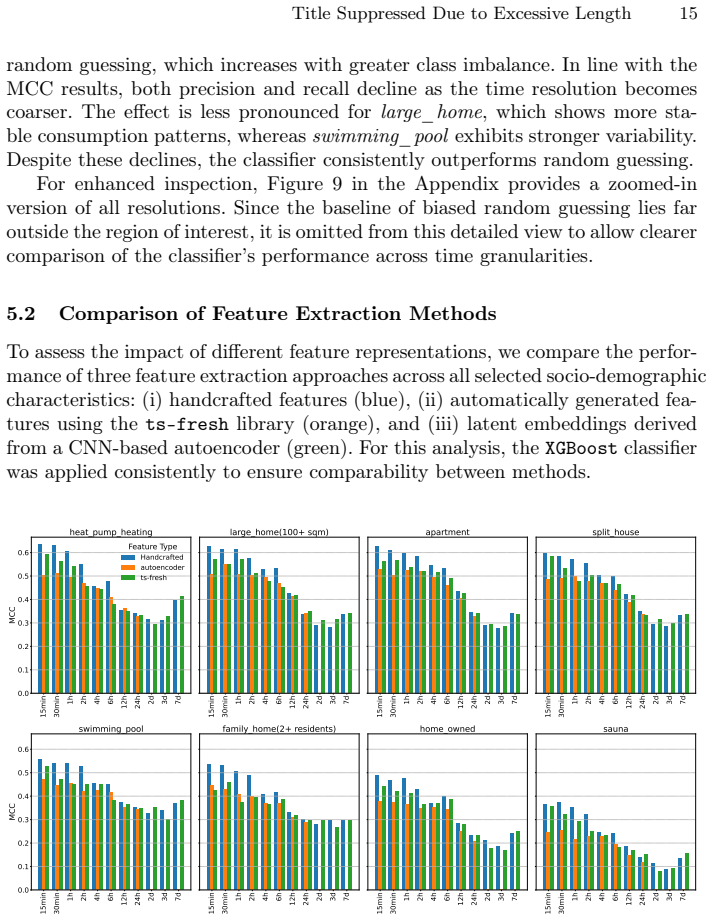
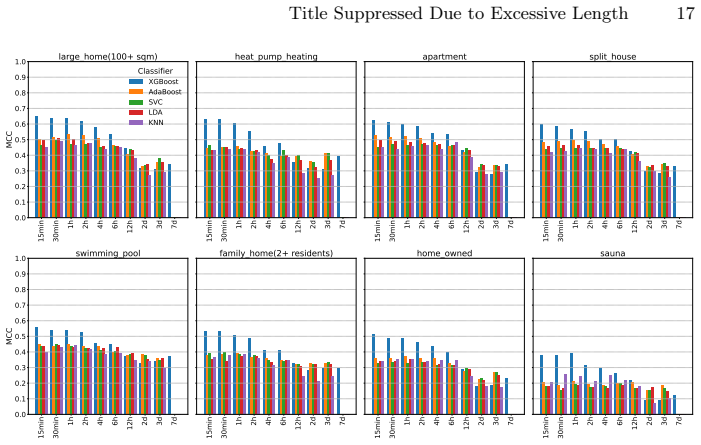
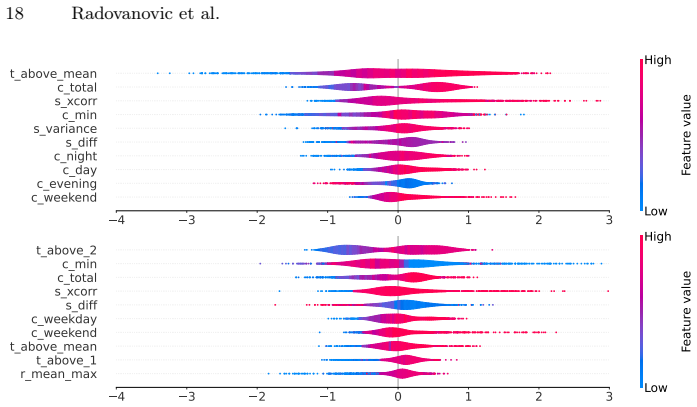
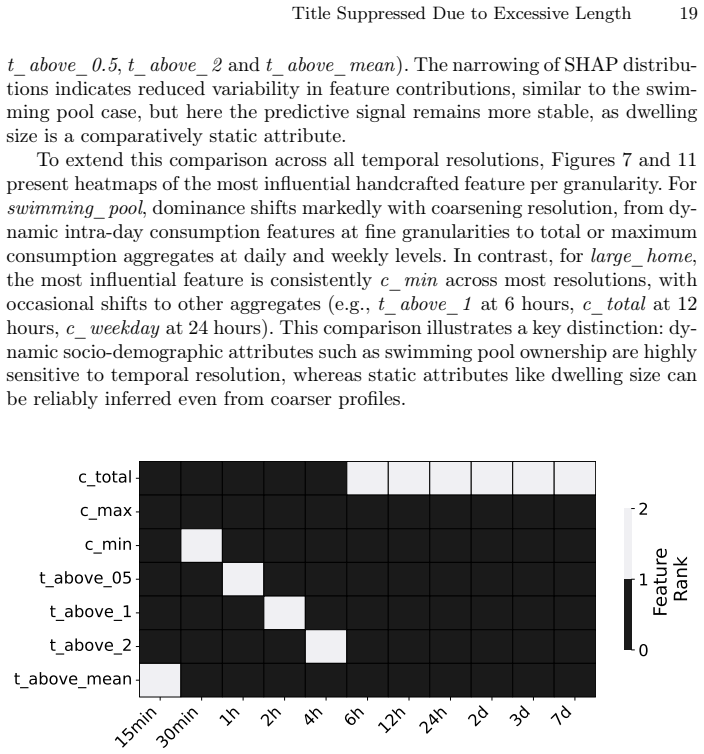
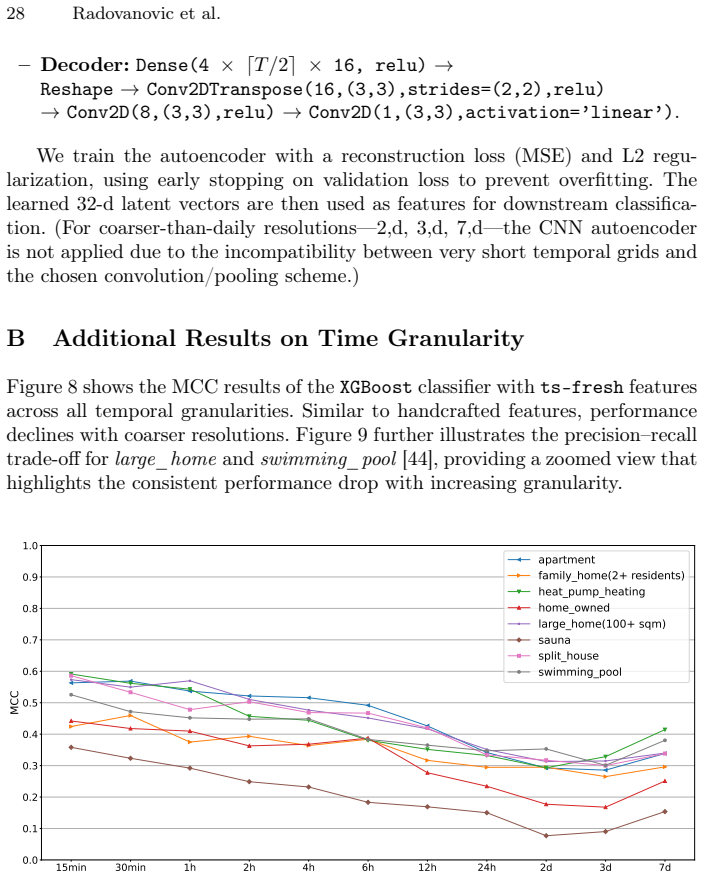
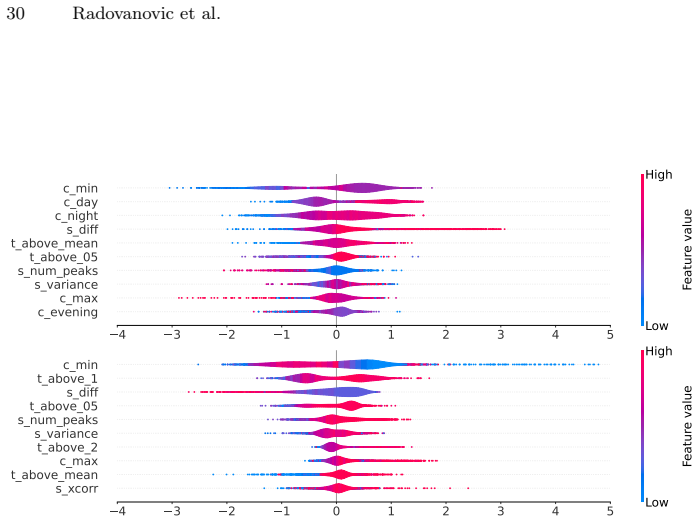
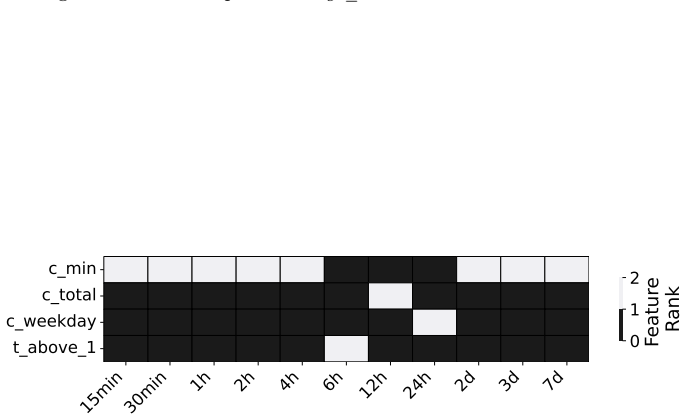
When load profiles are aggregated from 15-minute intervals up to 7-day intervals, predictive performance for socio-demographic attributes falls overall but remains stable between 15 minutes and 1 hour and again between 1 day and 7 days. Interpretable features extracted by tsfresh and simple statistical summaries stay competitive with CNN autoencoder embeddings, while XGBoost consistently outperforms the other classifiers tested. Feature-importance rankings further separate static attributes such as dwelling size, which can be recovered from coarse data, from dynamic attributes such as swimming-pool usage, which demand finer temporal detail.
What carries the argument
The train-on-full-year, test-on-arbitrary-week evaluation protocol that forces models to generalize across seasonal and weekly variation.
If this is right
- Utilities can reduce stored temporal detail to hourly or daily aggregates while retaining comparable inference capability for many household traits.
- XGBoost with handcrafted features offers a practical, interpretable baseline that matches more complex embeddings across all tested resolutions.
- Static attributes such as dwelling size remain recoverable from coarse data, whereas usage patterns tied to specific appliances require finer granularity.
- The two observed performance plateaus identify concrete points where privacy-utility trade-offs can be adjusted without retraining downstream models.
Where Pith is reading between the lines
- Regulators could use the identified plateaus to set minimum sampling rates that limit re-identification risk while still supporting legitimate grid-management tasks.
- Similar plateau behavior may appear in other time-series inference settings, such as traffic or health-sensor data, where aggregation thresholds could be calibrated once rather than per task.
- Extending the framework to multi-year datasets or cross-country collections would test whether the same granularity thresholds hold under different climate or tariff regimes.
Load-bearing premise
The chosen training and testing split forces models to generalize across seasonal and weekly variation rather than overfitting to specific periods.
What would settle it
A continuous decline in accuracy with no flat regions when the same classifiers are retrained and retested on weeks drawn from different seasons than the training data.
Figures


read the original abstract
Smart meter data can reveal sensitive socio-demographic characteristics of households, raising privacy concerns. While this risk has been demonstrated at fixed granularities, the role of temporal resolution in shaping inference performance remains insufficiently explored. This paper addresses this gap by analyzing how load profiles with granularities from 15 minutes to 7 days affect the predictability of eight socio-demographic attributes in a dataset of 1,589 households over one year. We introduce an evaluation framework where classifiers are trained on year-round data but tested on arbitrary weeks, forcing generalization across seasonal and weekly variations. Our results show three main findings. First, while coarsening granularity reduces predictive accuracy, two plateaus emerge: performance is stable between 15 minutes and 1 hour, and again between 1 and 7 days. This reveals opportunities for data minimization without sacrificing utility. Second, interpretable handcrafted and tsfresh features remain competitive with CNN-based autoencoder embeddings, while XGBoost consistently outperforms alternative classifiers. Third, feature importance analysis highlights differences between static and dynamic attributes: dwelling size can be inferred even from coarse data, whereas swimming pool usage requires fine-grained temporal signals. Overall, our study provides new insights into the privacy-utility trade-off in smart metering, showing how temporal resolution, feature extraction, and classifier choice jointly influence socio-demographic inference.
Editorial analysis
A structured set of objections, weighed in public.
Referee Report
Summary. The paper analyzes the effect of temporal granularity (15 min to 7 days) on machine-learning inference of eight socio-demographic attributes from one year of smart-meter data for 1,589 households. It introduces an evaluation framework that trains classifiers on year-round profiles and tests on arbitrary held-out weeks, reports two performance plateaus (stable 15 min–1 h and 1–7 days), finds handcrafted/tsfresh features competitive with autoencoder embeddings and XGBoost superior to other classifiers, and shows attribute-specific differences in required granularity via feature-importance analysis.
Significance. If the plateaus and attribute-specific findings hold after addressing evaluation details, the work supplies concrete, actionable evidence on the privacy-utility trade-off for smart-meter data release, identifying granularity regimes that permit data minimization while preserving inference utility for static attributes such as dwelling size.
major comments (2)
- [Abstract] Abstract (evaluation framework paragraph): the headline plateaus rest on classifiers trained on the full year but tested on arbitrary weeks drawn from the same year; without explicit household-level splitting, seasonal stratification of test weeks, or confirmation that no household contributes both training and test data from overlapping seasons, seasonal leakage cannot be ruled out and may inflate apparent invariance to coarsening.
- [Abstract] Abstract (results paragraph): no mention of statistical significance tests, confidence intervals, or cross-validation procedure for the reported accuracy plateaus or classifier comparisons; the absence of these details makes it impossible to assess whether the observed stability between 15 min–1 h and 1–7 days exceeds sampling variability.
minor comments (1)
- [Abstract] Abstract: the phrase 'forcing generalization across seasonal and weekly variations' is not accompanied by the concrete protocol (e.g., number of test weeks per household, stratification) that would substantiate the claim.
Simulated Author's Rebuttal
We thank the referee for the constructive feedback on our evaluation framework and statistical reporting. We address each major comment below and will revise the manuscript accordingly to improve clarity and rigor.
read point-by-point responses
-
Referee: [Abstract] Abstract (evaluation framework paragraph): the headline plateaus rest on classifiers trained on the full year but tested on arbitrary weeks drawn from the same year; without explicit household-level splitting, seasonal stratification of test weeks, or confirmation that no household contributes both training and test data from overlapping seasons, seasonal leakage cannot be ruled out and may inflate apparent invariance to coarsening.
Authors: We agree that explicit details are needed to rule out seasonal leakage. Our evaluation framework assigns households entirely to training or testing partitions for the held-out weeks, with test weeks deliberately sampled across seasons to ensure no household contributes data from overlapping periods to both sets. To address the concern directly, we will revise the abstract and add a methods subsection that explicitly describes the household-level splitting procedure, confirms the absence of seasonal overlap, and details the seasonal stratification of test weeks. revision: yes
-
Referee: [Abstract] Abstract (results paragraph): no mention of statistical significance tests, confidence intervals, or cross-validation procedure for the reported accuracy plateaus or classifier comparisons; the absence of these details makes it impossible to assess whether the observed stability between 15 min–1 h and 1–7 days exceeds sampling variability.
Authors: We concur that statistical details strengthen the claims. The manuscript uses household-level 5-fold cross-validation for all reported results. We will update the abstract to reference this procedure and expand the results section to include 95% confidence intervals around accuracy values plus paired statistical tests (e.g., McNemar’s test) comparing granularities within each plateau. These additions will confirm that observed stability is not attributable to sampling variability. revision: yes
Circularity Check
No circularity: purely empirical comparisons with no definitional reductions or self-citation chains
full rationale
The paper reports classifier accuracy results across temporal granularities using a fixed train-on-year/test-on-arbitrary-weeks protocol. All claims (plateaus at 15min-1h and 1-7d, feature competitiveness, attribute-specific differences) are direct outputs of these empirical runs on the 1589-household dataset. No equations, fitted parameters renamed as predictions, or load-bearing self-citations appear in the derivation; the evaluation framework is stated explicitly without reducing the reported metrics to inputs by construction. This is the standard non-circular case for an empirical ML study.
Axiom & Free-Parameter Ledger
axioms (1)
- domain assumption Coarsening load profiles by aggregation preserves the temporal signals relevant to socio-demographic inference tasks.
Reference graph
Works this paper leans on
-
[1]
Energy and Buildings49, 479–487 (2012).https://doi.org/https://doi.org/10.1016/j.enbuild.2012
Abreu, J.M., Pereira, F.C., Ferrão, P.: Using pattern recognition to identify ha- bitual behavior in residential electricity consumption. Energy and Buildings49, 479–487 (2012).https://doi.org/https://doi.org/10.1016/j.enbuild.2012. 02.044
-
[2]
Alahakoon, D., Yu, X.: Smart electricity meter data intelligence for future energy systems: A survey. IEEE Transactions on Industrial Informatics12, 425–436 (2 2016).https://doi.org/10.1109/TII.2015.2414355
-
[3]
Asghar, M.R., Dán, G., Miorandi, D., Chlamtac, I.: Smart meter data privacy: A survey. IEEE Communications Surveys Tutorials19, 2820–2835 (2017).https: //doi.org/10.1109/COMST.2017.2720195
-
[4]
In: Proceedings of the 1st ACM Conference on Embedded Systems for Energy-Efficient Buildings
Beckel, C., Kleiminger, W., Cicchetti, R., Staake, T., Santini, S.: The eco data set and the performance of non-intrusive load monitoring algorithms. In: Proceedings of the 1st ACM Conference on Embedded Systems for Energy-Efficient Buildings. pp. 80–89. BuildSys ’14, Association for Computing Machinery, New York, NY, USA(2014).https://doi.org/10.1145/267...
-
[5]
Beckel, C., Sadamori, L., Santini, S.: Towards automatic classification of private households using electricity consumption data. In: Proceedings of the Fourth ACM Workshop on Embedded Sensing Systems for Energy-Efficiency in Buildings. p. 169–176. BuildSys ’12, Association for Computing Machinery, New York, NY, USA (2012).https://doi.org/10.1145/2422531.2422562
-
[6]
e-Energy 2013 - Proceedings of the 4th ACM International Conference on Future Energy Systems pp
Beckel, C., Sadamori, L., Santini, S.: Automatic socio-economic classification of households using electricity consumption data. e-Energy 2013 - Proceedings of the 4th ACM International Conference on Future Energy Systems pp. 75–86 (2013).https://doi.org/10.1145/2487166.2487175,https://dl.acm.org/doi/ 10.1145/2487166.2487175 Title Suppressed Due to Excess...
-
[7]
Beckel, C., Serfas, H., Zeeb, E., Moritz, G., Golatowski, F., Timmermann, D.: Requirements for smart home applications and realization with ws4d-pipesbox. In: ETFA2011. pp. 1–8. IEEE (9 2011).https://doi.org/10.1109/ETFA.2011. 6059229
-
[8]
Energy and Buildings50, 93–102 (7 2012).https:// doi.org/10.1016/J.ENBUILD.2012.03.025
Birt, B.J., Newsham, G.R., Beausoleil-Morrison, I., Armstrong, M.M., Saldanha, N., Rowlands, I.H.: Disaggregating categories of electrical energy end-use from whole-house hourly data. Energy and Buildings50, 93–102 (7 2012).https:// doi.org/10.1016/J.ENBUILD.2012.03.025
-
[9]
Springer-Verlag (2006)
Bishop, C.M.: Pattern Recognition and Machine Learning (Information Science and Statistics). Springer-Verlag (2006)
2006
-
[10]
Burkhart, S., Unterweger, A., Eibl, G., Engel, D.: Detecting swimming pools in 15-minute load data. pp. 1651–1655. IEEE (2018).https://doi.org/10.1109/ TrustCom/BigDataSE.2018.00244
arXiv 2018
-
[11]
Chen, D., Barker, S., Subbaswamy, A., Irwin, D., Shenoy, P.: Non-intrusive occu- pancy monitoring using smart meters. pp. 1–8 (2013).https://doi.org/10.1145/ 2528282.2528294
arXiv 2013
-
[12]
BMC genomics 21, 1–13 (2020)
Chicco, D., Jurman, G.: The advantages of the matthews correlation coefficient (mcc) over f1 score and accuracy in binary classification evaluation. BMC genomics 21, 1–13 (2020)
2020
-
[13]
IEEE Access9, 47112–47124 (2021)
Chicco, D., Starovoitov, V.V., Jurman, G.: The benefits of the matthews correla- tion coefficient (mcc) over the diagnostic odds ratio (dor) in binary classification assessment. IEEE Access9, 47112–47124 (2021)
2021
-
[14]
Medi- cal Image Analysis104, 103614 (Aug 2025).https://doi.org/10.1016/j
Christ, M., Braun, N., Neuffer, J., Kempa-Liehr, A.W.: Time series feature ex- traction on basis of scalable hypothesis tests (tsfresh – a python package). Neu- rocomputing307, 72–77 (2018).https://doi.org/https://doi.org/10.1016/j. neucom.2018.03.067
work page doi:10.1016/j 2018
-
[15]
europa.eu/legal-content/EN/ALL/?uri=CELEX%3A32012H0148
Commission, E.: 2012/148/eu: Commission recommendation of 9 march 2012 on preparations for the roll-out of smart metering systems (2012),http://eur-lex. europa.eu/legal-content/EN/ALL/?uri=CELEX%3A32012H0148
2012
-
[16]
Commission, E.: Cost-benefit analyses and state of play of smart metering deploy- ment in the eu-27 (2014),http://eur-lex.europa.eu/legal-content/EN/TXT/ PDF/?uri=CELEX:52014SC0189%5C&from=EN
2014
-
[17]
Darby, S.: Smart metering: What potential for householder engagement? Building Research and Information38, 442–457 (2010)
2010
-
[18]
Efthymiou, C., Kalogridis, G.: Smart grid privacy via anonymization of smart metering data. pp. 238–243. IEEE (2010)
2010
-
[20]
IEEE Transactions on Smart Grid8, 1710–1721 (2017).https://doi.org/10.1109/TSG
Engel, D., Eibl, G.: Wavelet-based multiresolution smart meter privacy. IEEE Transactions on Smart Grid8, 1710–1721 (2017).https://doi.org/10.1109/TSG. 2015.2504395
work page doi:10.1109/tsg 2017
-
[21]
IEEE Signal Processing Magazine30, 75–86 (3 2013).https://doi.org/10.1109/MSP.2012
Erkin, Z., Troncoso-Pastoriza, J.R., Lagendijk, R.L., Perez-Gonzalez, F.: Privacy- preserving data aggregation in smart metering systems: An overview. IEEE Signal Processing Magazine30, 75–86 (3 2013).https://doi.org/10.1109/MSP.2012. 2228343
-
[22]
Energies12(5) (2019).https:// doi.org/10.3390/en12050773 24 Radovanovic et al
Fahim, M., Sillitti, A.: Analyzing load profiles of energy consumption to infer household characteristics using smart meters. Energies12(5) (2019).https:// doi.org/10.3390/en12050773 24 Radovanovic et al
-
[23]
IEEE Communi- cations Surveys and Tutorials15, 21–38 (2013).https://doi.org/10.1109/SURV
Fan, Z., Kulkarni, P., Gormus, S., Efthymiou, C., Kalogridis, G., Sooriyabandara, M., Zhu, Z., Lambotharan, S., Chin, W.H.: Smart grid communications: Overview of research challenges, solutions, and standardization activities. IEEE Communi- cations Surveys and Tutorials15, 21–38 (2013).https://doi.org/10.1109/SURV. 2011.122211.00021
-
[24]
Energy Informatics 2, 1–9 (2019).https://doi.org/https://doi.org/10.1186/s42162-019-0097-8
Ferner, C., Eibl, G., Unterweger, A., Burkhart, S., Wegenkittl, S.: Pool detection from smart metering data with convolutional neural networks. Energy Informatics 2, 1–9 (2019).https://doi.org/https://doi.org/10.1186/s42162-019-0097-8
-
[25]
Finster, S., Baumgart, I.: Privacy-aware smart metering: A survey. IEEE Commu- nications Surveys & Tutorials16, 1732–1745 (2014).https://doi.org/10.1109/ SURV.2014.052914.00090
arXiv 2014
-
[26]
Fisher, R.A.: Statistical Methods for Research Workers, pp. 66–70. Springer New York, New York, NY (1992).https://doi.org/10.1007/978-1-4612-4380-9_6, https://doi.org/10.1007/978-1-4612-4380-9_6
-
[27]
Proceedings of the IEEE80(12), 1870–1891 (1992).https://doi.org/10.1109/5.192069
Hart, G.: Nonintrusive appliance load monitoring. Proceedings of the IEEE80(12), 1870–1891 (1992).https://doi.org/10.1109/5.192069
-
[28]
Knowledge and Data Engi- neering, IEEE Transactions on21, 1263–1284 (2009).https://doi.org/10.1109/ TKDE.2008.239
He, H., Garcia, E.: Learning from imbalanced data. Knowledge and Data Engi- neering, IEEE Transactions on21, 1263–1284 (2009).https://doi.org/10.1109/ TKDE.2008.239
2009
-
[29]
Hopf, K., Sodenkamp, M., Kozlovkiy, I., Staake, T.: Feature extraction and filter- ing for household classification based on smart electricity meter data. Computer Science - Research and Development31, 141–148 (8 2016).https://doi.org/ 10.1007/S00450-014-0294-4,https://link.springer.com/article/10.1007/ s00450-014-0294-4
-
[30]
Japkowicz, N.: The class imbalance problem: Significance and strategies. vol. 56, pp. 111–117 (2000)
2000
-
[31]
Energy55, 184–194 (2013).https://doi.org/10.1016/j.energy.2013.03.086
Kavousian, A., Rajagopal, R., Fischer, M.: Determinants of residential electricity consumption: Using smart meter data to examine the effect of climate, build- ing characteristics, appliance stock, and occupants’ behavior. Energy55, 184–194 (2013).https://doi.org/10.1016/j.energy.2013.03.086
-
[32]
Kim, H., Marwah, M., Arlitt, M.F., Lyon, G., Han, J.: Unsupervised disaggregation of low frequency power measurements. pp. 747–758 (2011)
2011
-
[33]
2528295,http://dl.acm.org/citation.cfm?doid=2528282.2528295
Kleiminger, W., Beckel, C., Staake, T., Santini, S.: Occupancy detection from electricityconsumptiondata.pp.1–8(2013).https://doi.org/10.1145/2528282. 2528295,http://dl.acm.org/citation.cfm?doid=2528282.2528295
-
[34]
In: Proceedings of the AAAI Conference on Artificial Intelligence
Kolter, J., Ferreira, J.: A large-scale study on predicting and contextualizing build- ing energy usage. In: Proceedings of the AAAI Conference on Artificial Intelligence. vol. 25, pp. 1349–1356 (2011)
2011
-
[35]
Journal of Machine Learning Research - Pro- ceedings Track22, 1472–1482 (4 2012)
Kolter, J.Z., Jaakkola, T.: Approximate inference in additive factorial hmms with application to energy disaggregation. Journal of Machine Learning Research - Pro- ceedings Track22, 1472–1482 (4 2012)
2012
-
[36]
Lin, J., Ma, J., Zhu, J.G.: Estimation of household characteristics with uncertain- ties from smart meter data. International Journal of Electrical Power and En- ergy Systems143, 108440 (2022).https://doi.org/https://doi.org/10.1016/ j.ijepes.2022.108440
arXiv 2022
-
[37]
IEEE Security and Privacy8, 11–20 (2010).https: //doi.org/10.1109/MSP.2010.40
Lisovich, M., Mulligan, D., Wicker, S.: Inferring personal information from demand-response systems. IEEE Security and Privacy8, 11–20 (2010).https: //doi.org/10.1109/MSP.2010.40
-
[38]
In: Proceedings of the 31st International Conference on Neural Information Processing Systems (NIPS)
Lundberg, S.M., Lee, S.I.: A unified approach to interpreting model predictions. In: Proceedings of the 31st International Conference on Neural Information Processing Systems (NIPS). pp. 4768–4777 (2017) Title Suppressed Due to Excessive Length 25
2017
-
[39]
Biochimica et Biophysica Acta (BBA) - Protein Structure405(2), 442–451 (1975).https://doi.org/https://doi.org/10.1016/ 0005-2795(75)90109-9
Matthews, B.: Comparison of the predicted and observed secondary struc- ture of t4 phage lysozyme. Biochimica et Biophysica Acta (BBA) - Protein Structure405(2), 442–451 (1975).https://doi.org/https://doi.org/10.1016/ 0005-2795(75)90109-9
1975
-
[40]
McLoughlin, F., Duffy, A., Conlon, M.: Characterising domestic electricity con- sumption patterns by dwelling and occupant socio-economic variables: An irish case study. Energy and Buildings48, 240–248 (2012).https://doi.org/https: //doi.org/10.1016/j.enbuild.2012.01.037
-
[41]
Applied Energy141, 190–199 (3 2015).https://doi.org/10.1016/J.APENERGY.2014.12.039
McLoughlin, F., Duffy, A., Conlon, M.: A clustering approach to domestic electric- ity load profile characterisation using smart metering data. Applied Energy141, 190–199 (3 2015).https://doi.org/10.1016/J.APENERGY.2014.12.039
-
[42]
Molina-Markham, A., Shenoy, P., Fu, K., Cecchet, E., Irwin, D.: Private memoirs of a smart meter. pp. 61–66. ACM (2010).https://doi.org/http://doi.acm.org/ 10.1145/1878431.1878446,http://doi.acm.org/10.1145/1878431.1878446
-
[43]
Practical assessment, re- search, and evaluation8, 6 (2002)
Osborne, J.: Notes on the use of data transformations. Practical assessment, re- search, and evaluation8, 6 (2002)
2002
-
[44]
Radovanovic, D., Schirl, M., Unterweger, A., Eibl, G.: Predicting socio- demographic characteristics from load profiles with varying time granularities. In: Proceedings of the 14th International Conference on Smart Cities and Green ICT Systems - SMARTGREENS. pp. 87–98. INSTICC, SciTePress (2025).https: //doi.org/10.5220/0013217400003953
-
[45]
Radovanovic, D., Unterweger, A., Eibl, G., Engel, D., Reichl, J.: How unique is weekly smart meter data? Energy Informatics5, 1–13 (2022).https://doi.org/ 10.1186/s42162-022-00205-8,https://doi.org/10.1186/s42162-022-00205-8
-
[46]
Silva, D.D., Yu, X., Alahakoon, D., Holmes, G.: A data mining framework for electricity consumption analysis from meter data. IEEE Transactions on Industrial Informatics7, 399–407 (2011).https://doi.org/10.1109/TII.2011.2158844
-
[47]
Information Processing and Management45(4), 427–437 (2009)
Sokolova, M., Lapalme, G.: A systematic analysis of performance measures for clas- sification tasks. Information Processing and Management45(4), 427–437 (2009). https://doi.org/https://doi.org/10.1016/j.ipm.2009.03.002
-
[48]
IEEE Transactions on Power Systems21, 1672–1682 (2006)
Verdu,S.V.,Garcia,M.O.,Senabre,C.,Marin,A.G.,Franco,F.J.G.:Classification, filtering, and identification of electrical customer load patterns through the use of self-organizing maps. IEEE Transactions on Power Systems21, 1672–1682 (2006). https://doi.org/10.1109/TPWRS.2006.881133
-
[49]
Communications in Computer and Information Science610, 562–573 (2016).https://doi.org/10.1007/ 978-3-319-40596-4_47/COVER
Viegas, J.L., Vieira, S.M., Sousa, J.M.: Mining consumer characteristics from smart metering data through fuzzy modelling. Communications in Computer and Information Science610, 562–573 (2016).https://doi.org/10.1007/ 978-3-319-40596-4_47/COVER
2016
-
[50]
Springer Singapore (2020)
Wang, Y., Chen, Q., Kang, C.: Smart Meter Data Analytics: Electricity Consumer Behavior Modeling, Aggregation, and Forecasting. Springer Singapore (2020)
2020
-
[51]
IEEE Transactions on Smart Grid10, 2593–2602 (5 2019).https://doi.org/10.1109/ TSG.2018.2805723
Wang, Y., Chen, Q., Gan, D., Yang, J., Kirschen, D.S., Kang, C.: Deep learning- based socio-demographic information identification from smart meter data. IEEE Transactions on Smart Grid10, 2593–2602 (5 2019).https://doi.org/10.1109/ TSG.2018.2805723
arXiv 2019
-
[52]
Springer, Berlin, Heidelberg (2018)
Wang, Z., Lin, J., Cai, Q., Wang, Q., Jing, J., Zha, D.: Blockchain-based certificate transparency and revocation transparency. Springer, Berlin, Heidelberg (2018)
2018
-
[53]
Springer Singapore (2013)
Weranga, K.S.K., Kumarawadu, S., Chandima, D.P.: Smart Metering Design and Applications. Springer Singapore (2013)
2013
-
[54]
IEEE Transactions on Consumer Electronics57, 76–84 (2011) 26 Radovanovic et al
Zeifman, M., Roth, K.: Nonintrusive appliance load monitoring: Review and out- look. IEEE Transactions on Consumer Electronics57, 76–84 (2011) 26 Radovanovic et al
2011
-
[55]
Sensors 201212, 16838–16866 (2012).https://doi.org/10.3390/S121216838,https://www.mdpi
Zoha, A., Gluhak, A., Imran, M.A., Rajasegarar, S.: Non-intrusive load moni- toring approaches for disaggregated energy sensing: A survey. Sensors 201212, 16838–16866 (2012).https://doi.org/10.3390/S121216838,https://www.mdpi. com/1424-8220/12/12/16838 Title Suppressed Due to Excessive Length 27 A Implementation Details All experiments are implemented in ...
discussion (0)
Sign in with ORCID, Apple, or X to comment. Anyone can read and Pith papers without signing in.