Optimized Sampling of Angle-Resolved Scatterometry Data Using End-to-End Compressed Learning Model for Nanograss Deficiency Detection
Pith reviewed 2026-06-27 21:19 UTC · model grok-4.3
The pith
A learnable latitude-based sampling layer lets a neural network classify five levels of nanograss deficiency from angle-resolved scatterometry data using up to 90 percent fewer angular points.
A machine-rendered reading of the paper's core claim, the machinery that carries it, and where it could break.
Core claim
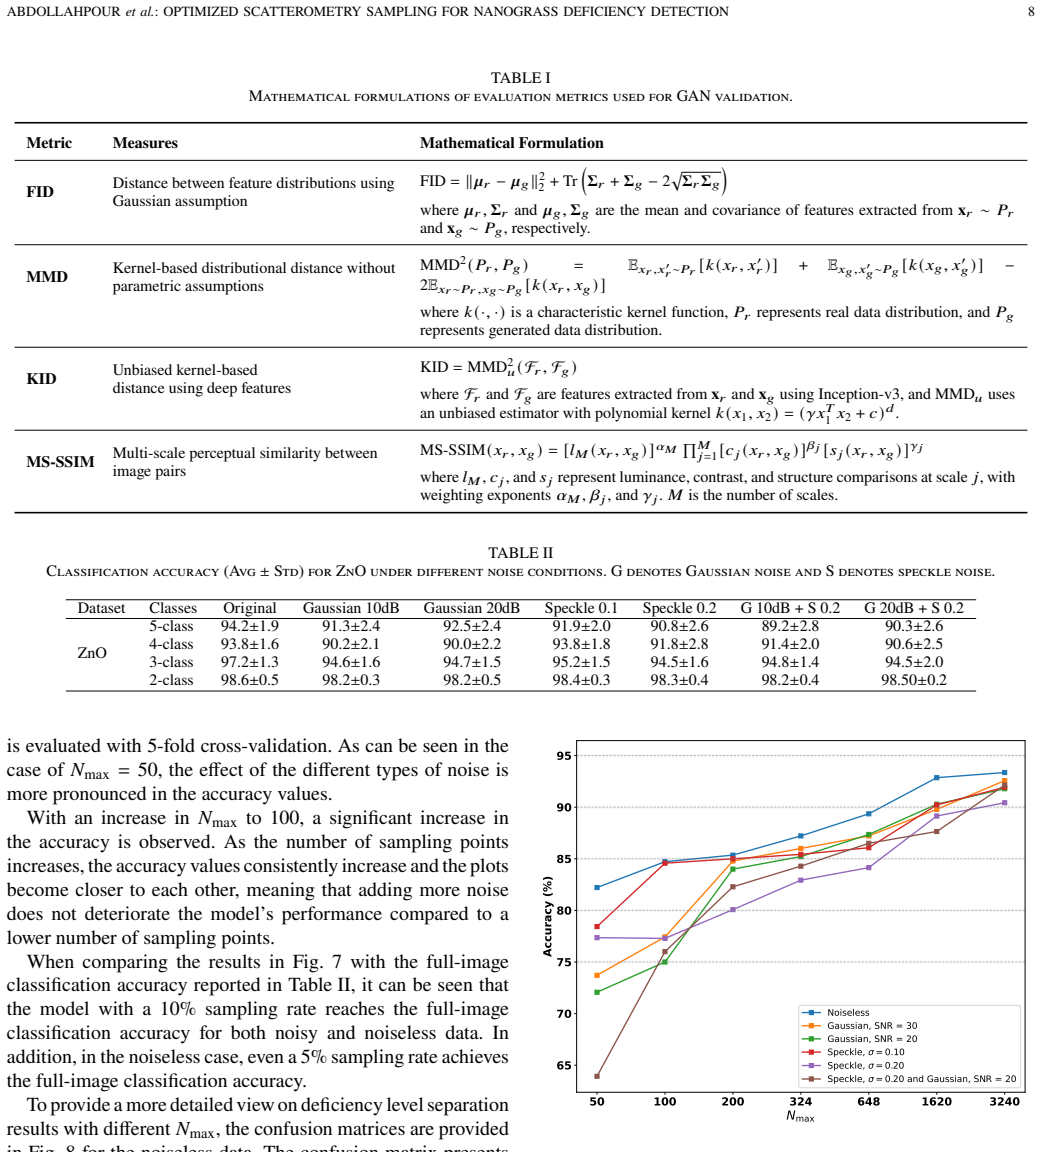
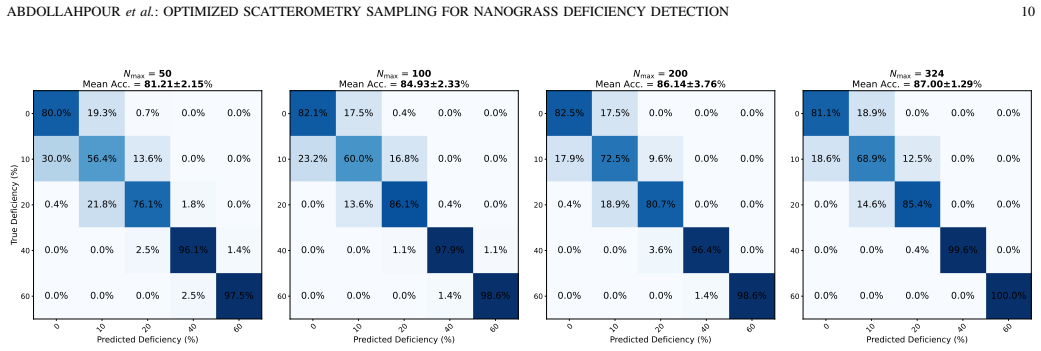
The proposed framework integrates a learnable latitude-based sampling layer with a convolutional neural network, allowing sampling and classification to be jointly optimized during training. The sampling layer exploits the physical structure of ARS patterns and learns informative latitudinal regions, which reduces the sampling search space and improves convergence. Evaluation results show that the proposed approach achieves high and stable deficiency-level classification performance under different noise conditions, matching full-image performance with up to 90% fewer angular sampling points while the accuracy drop stays below 10 percentage points even at 99.7% reduction.
What carries the argument
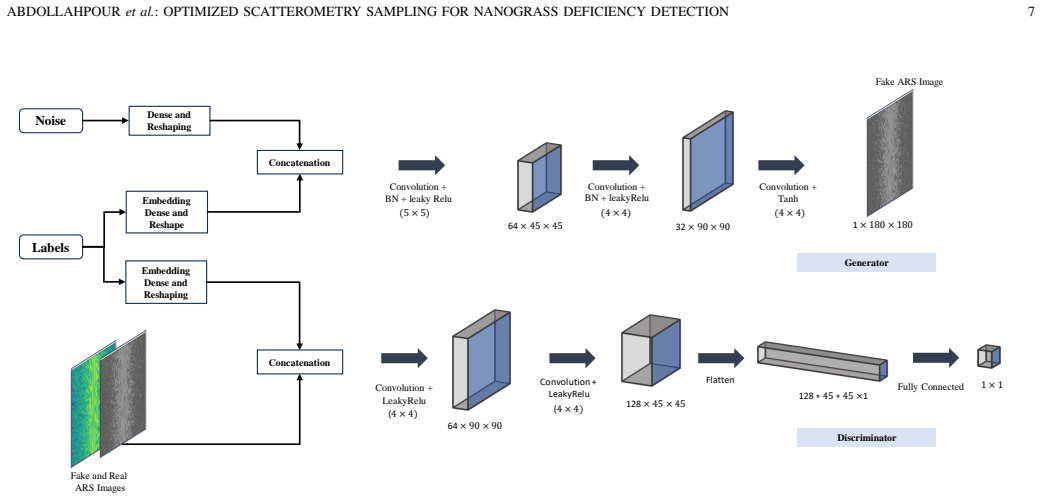
learnable latitude-based sampling layer integrated with a CNN that selects informative angular regions from ARS patterns and trains jointly with the classifier
If this is right
- The model reaches 94.2% accuracy for five-level deficiency classification and 98.6% for binary deficient versus non-deficient separation on full images.
- Classification performance remains high and stable under added noise even after large reductions in the number of angular sampling points.
- Pretraining on GAN-generated data produces fast convergence after only a few fine-tuning epochs on limited real samples.
Where Pith is reading between the lines
- The same latitude-based sampling idea could be applied to other rotationally symmetric measurement domains where acquisition time is a bottleneck.
- Hardware implementations that physically steer the detector to the learned angles might cut inspection time in manufacturing lines.
- Retraining the sampling layer on data from different nanostructure materials would test whether the learned regions depend mainly on geometry or on material-specific scattering.
Load-bearing premise
The latitude-based sampling layer can learn informative regions from the physical structure of ARS patterns that generalize to new samples under varying noise conditions.
What would settle it
Testing the trained sampling points on a fresh set of ARS images from different nanograss samples and observing more than a 15-point accuracy drop relative to full sampling for five-level classification would falsify the generalization result.
Figures


read the original abstract
Reliable inspection of nanosurfaces is essential to ensure the quality of nanostructure manufacturing. Angle-resolved scatterometry provides a non-invasive inspection method that can be used in-line but often suffers from long acquisition times due to dense angular sampling. This paper addresses the data acquisition challenge by proposing an end-to-end compressed learning framework for 5-level vacancy deficiency detection in zinc oxide nanograss using ARS images. The proposed framework integrates a learnable latitude-based sampling layer with a convolutional neural network, allowing sampling and classification to be jointly optimized during training. The sampling layer exploits the physical structure of ARS patterns and learns informative latitudinal regions, which reduces the sampling search space and improves convergence. Evaluation results show that the proposed approach achieves high and stable deficiency-level classification performance under different noise conditions. Using full ARS images, the model achieves 94.2% accuracy for five-level deficiency classification and 98.6% accuracy for separating deficient from non-deficient nanosurfaces. The proposed sampling model matches full-image performance while using up to 90% fewer angular sampling points. Even when sampling points are reduced by 99.7%, the classification accuracy decreases by less than 10 percentage points. To further improve training with limited data, we also studied a GAN-based augmentation approach and used GAN-generated data for model pretraining. Augmented data resulted in fast convergence within only a few fine-tuning epochs.
Editorial analysis
A structured set of objections, weighed in public.
Referee Report
Summary. The manuscript proposes an end-to-end compressed learning framework that jointly optimizes a learnable latitude-based sampling layer with a CNN classifier for 5-level vacancy deficiency detection in ZnO nanograss using angle-resolved scatterometry (ARS) images. It reports 94.2% accuracy for 5-class deficiency classification and 98.6% for deficient vs. non-deficient on full images, with the sampling model matching full-image performance at up to 90% fewer points and <10 pp accuracy drop at 99.7% reduction under varying noise; GAN augmentation is used to address limited data.
Significance. If the empirical results hold under proper validation, the joint optimization of physically motivated latitude sampling with classification could enable substantially faster in-line ARS inspection while preserving accuracy, addressing a key practical limitation in nanomanufacturing quality control. The end-to-end training and use of GAN pretraining for data scarcity are methodological strengths worth noting.
major comments (3)
- [Abstract / Experimental evaluation] Abstract and experimental evaluation section: the reported accuracies (94.2%, 98.6%) and stability claims under noise lack any mention of dataset size, train/validation/test split, cross-validation protocol, or number of independent runs, which are load-bearing for assessing whether the <10 pp drop at 99.7% reduction is statistically reliable or generalizable.
- [Results] Results on sampling reduction: the claim that the model 'matches full-image performance' while using 90% fewer points is presented without baseline comparisons (e.g., random sampling, fixed uniform latitudes, or non-learnable compressed sensing methods) or error bars, making it impossible to determine if the latitude layer contributes beyond what simpler strategies achieve.
- [Method / Training details] Training procedure for the latitude sampling layer: no indication is given whether the noise conditions used in the reported 'different noise conditions' tests were held out from the joint optimization of the sampler and CNN; if test noise was seen during training, the robustness result does not demonstrate out-of-distribution generalization as claimed.
minor comments (2)
- [Method] Notation for the latitude sampling layer should be defined more explicitly (e.g., how the learned latitudes map to physical ARS angles) to aid reproducibility.
- [Abstract] The 5 deficiency levels are referenced but not enumerated or justified in the abstract; a brief definition or reference to the physical meaning would improve clarity.
Simulated Author's Rebuttal
We thank the referee for the constructive comments. We address each major point below and will revise the manuscript accordingly to improve clarity and rigor.
read point-by-point responses
-
Referee: [Abstract / Experimental evaluation] Abstract and experimental evaluation section: the reported accuracies (94.2%, 98.6%) and stability claims under noise lack any mention of dataset size, train/validation/test split, cross-validation protocol, or number of independent runs, which are load-bearing for assessing whether the <10 pp drop at 99.7% reduction is statistically reliable or generalizable.
Authors: We agree these details are necessary. In the revision we will add the dataset size, train/validation/test split ratios, cross-validation protocol, and results from multiple independent runs (with standard deviations) to support the reported accuracies and noise robustness claims. revision: yes
-
Referee: [Results] Results on sampling reduction: the claim that the model 'matches full-image performance' while using 90% fewer points is presented without baseline comparisons (e.g., random sampling, fixed uniform latitudes, or non-learnable compressed sensing methods) or error bars, making it impossible to determine if the latitude layer contributes beyond what simpler strategies achieve.
Authors: We accept this point. The revised manuscript will include comparisons against random sampling, fixed uniform latitudes, and non-learnable compressed sensing baselines, along with error bars from repeated runs to demonstrate the contribution of the learnable latitude layer. revision: yes
-
Referee: [Method / Training details] Training procedure for the latitude sampling layer: no indication is given whether the noise conditions used in the reported 'different noise conditions' tests were held out from the joint optimization of the sampler and CNN; if test noise was seen during training, the robustness result does not demonstrate out-of-distribution generalization as claimed.
Authors: We will add explicit clarification in the methods section that the noise levels used for the reported robustness tests were held out from training. The joint optimization used either clean data or a disjoint set of noise conditions, enabling the out-of-distribution evaluation. revision: yes
Circularity Check
No circularity: empirical end-to-end training with independent evaluation
full rationale
The paper describes a jointly optimized latitude sampling layer plus CNN trained on ARS images for deficiency classification. Performance numbers (94.2% full-image accuracy, <10 pp drop at 99.7% reduction) are reported as outcomes of that training process, not as quantities derived from the model's own equations or from self-citations that close the loop. No load-bearing step equates a claimed prediction to a fitted input by construction, imports uniqueness from prior author work, or renames a known result. The derivation chain is therefore self-contained against external benchmarks.
Axiom & Free-Parameter Ledger
axioms (1)
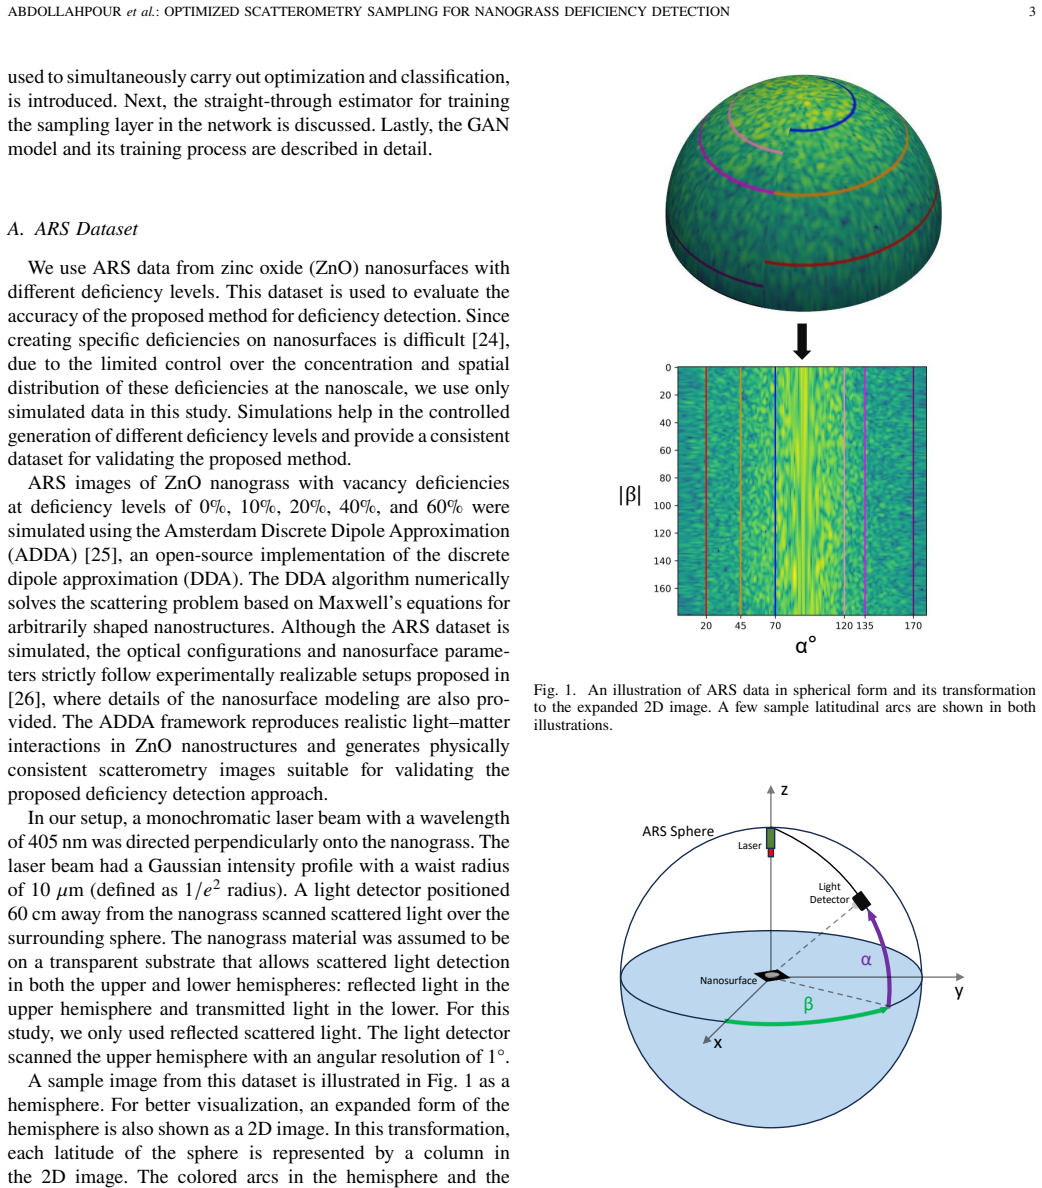
- domain assumption ARS patterns have physical latitudinal structure that a learnable sampling layer can exploit to select informative regions
Reference graph
Works this paper leans on
-
[1]
Echlin,Handbook of sample preparation for scanning electron mi- croscopy and X-ray microanalysis
P. Echlin,Handbook of sample preparation for scanning electron mi- croscopy and X-ray microanalysis. Springer Science & Business Media, 2011
2011
-
[2]
Characterization of polymer surfaces with atomic force microscopy,
S. N. Magonov and D. H. Reneker, “Characterization of polymer surfaces with atomic force microscopy,”Annual Review of Materials Science, vol. 27, no. 1, pp. 175–222, 1997
1997
-
[3]
Evaluation of a novel ultra small target technology supporting on-product overlay measurements,
H.-J. H. Smilde, A. den Boef, M. Kubis, M. Jak, M. van Schijndel, A. Fuchs, M. van der Schaar, S. Meyer, S. Morgan, J. Wuet al., “Evaluation of a novel ultra small target technology supporting on-product overlay measurements,” inMetrology, Inspection, and Process Control for Microlithography XXVI, vol. 8324. SPIE, 2012, pp. 431–438
2012
-
[4]
Fast characterization of moving samples with nano-textured surfaces,
M. H. Madsen, P.-E. Hansen, M. Zalkovskij, M. Karamehmedovi ´c, and J. Garnæs, “Fast characterization of moving samples with nano-textured surfaces,”Optica, vol. 2, no. 4, pp. 301–306, 2015
2015
-
[5]
Model-assisted measuring method for periodical sub-wavelength nanostructures,
G. Alexe, A. Tausendfreund, D. St¨obener, and A. Fischer, “Model-assisted measuring method for periodical sub-wavelength nanostructures,”Applied Optics, vol. 57, no. 1, pp. 92–101, 2018
2018
-
[6]
Overview of scatterometry applications in high volume silicon manufacturing,
C. Raymond, “Overview of scatterometry applications in high volume silicon manufacturing,” inAIP Conference Proceedings, vol. 788, no. 1. American Institute of Physics, 2005, pp. 394–402
2005
-
[7]
Overlay measurement using angular scatterometer for the capability of integrated metrology,
C.-H. Ko and Y.-S. Ku, “Overlay measurement using angular scatterometer for the capability of integrated metrology,”Optics Express, vol. 14, no. 13, pp. 6001–6010, 2006
2006
-
[8]
Scatterometry for advanced process control in semiconductor device manufacturing,
A. den Boef, H. Cramer, S. Petra, B. O. F. Auer, J. Schmetz-Schagen, A. Koolen, O. van Loon, G. de Gersem, P. Klandermans, and E. Bakker, “Scatterometry for advanced process control in semiconductor device manufacturing,” inFifth International Conference on Optical and Pho- tonics Engineering, vol. 10449. SPIE, 2017, pp. 201–208
2017
-
[9]
In situ characterization of nanowire dimensions and growth dynamics by optical reflectance,
M. Heurlin, N. Anttu, C. Camus, L. Samuelson, and M. T. Borgstrom, “In situ characterization of nanowire dimensions and growth dynamics by optical reflectance,”Nano letters, vol. 15, no. 5, pp. 3597–3602, 2015
2015
-
[10]
Specular spectroscopic scatterometry,
X. Niu, N. Jakatdar, J. Bao, and C. J. Spanos, “Specular spectroscopic scatterometry,”IEEE Transactions on Semiconductor Manufacturing, vol. 14, no. 2, pp. 97–111, 2001
2001
-
[11]
Angle resolved optical metrology,
R. M. Silver, B. M. Barnes, A. Heckert, R. Attota, R. Dixson, and J. Jun, “Angle resolved optical metrology,” inMetrology, Inspection, and Process Control for Microlithography XXII, vol. 6922. SPIE, 2008, pp. 590–601
2008
-
[12]
Imaging scatterometry for flexible measurements of patterned areas,
M. H. Madsen and P.-E. Hansen, “Imaging scatterometry for flexible measurements of patterned areas,”Optics express, vol. 24, no. 2, pp. 1109–1117, 2016
2016
-
[13]
Scatterometry—fast and robust measurements of nano-textured surfaces,
——, “Scatterometry—fast and robust measurements of nano-textured surfaces,”Surface Topography: Metrology and Properties, vol. 4, no. 2, p. 023003, 2016
2016
-
[14]
In-process measuring procedure for sub-100 nm structures,
M. Zimmermann, A. Tausendfreund, S. Patzelt, G. Goch, S. Kieß, M. Shaikh, M. Gr´egoire, and S. Simon, “In-process measuring procedure for sub-100 nm structures,”Journal of Laser Applications, vol. 24, no. 4, 2012. ABDOLLAHPOURet al.: OPTIMIZED SCATTEROMETRY SAMPLING FOR NANOGRASS DEFICIENCY DETECTION 13
2012
-
[15]
Robust uncertainty principles: Exact signal reconstruction from highly incomplete frequency information,
E. J. Cand `es, J. Romberg, and T. Tao, “Robust uncertainty principles: Exact signal reconstruction from highly incomplete frequency information,” IEEE Transactions on information theory, vol. 52, no. 2, pp. 489–509, 2006
2006
-
[16]
Compressed sensing,
D. L. Donoho, “Compressed sensing,”IEEE Transactions on information theory, vol. 52, no. 4, pp. 1289–1306, 2006
2006
-
[17]
Learned primal-dual reconstruction,
J. Adler and O. ¨Oktem, “Learned primal-dual reconstruction,”IEEE transactions on medical imaging, vol. 37, no. 6, pp. 1322–1332, 2018
2018
-
[18]
Compressed learning: Uni- versal sparse dimensionality reduction and learning in the measurement domain,
R. Calderbank, S. Jafarpour, and R. Schapire, “Compressed learning: Uni- versal sparse dimensionality reduction and learning in the measurement domain,”preprint, 2009
2009
-
[19]
Compressed learning: A deep neural network approach,
A. Adler, M. Elad, and M. Zibulevsky, “Compressed learning: A deep neural network approach,”arXiv preprint arXiv:1610.09615, 2016
Pith/arXiv arXiv 2016
-
[20]
Compressed learning for tactile object recognition,
B. Hollis, S. Patterson, and J. Trinkle, “Compressed learning for tactile object recognition,”IEEE Robotics and Automation Letters, vol. 3, no. 3, pp. 1616–1623, 2018
2018
-
[21]
Direct inference on compressive measurements using convolutional neural networks,
S. Lohit, K. Kulkarni, and P. Turaga, “Direct inference on compressive measurements using convolutional neural networks,” in2016 IEEE international conference on image processing (ICIP). IEEE, 2016, pp. 1913–1917
2016
-
[22]
Compressed learning for image classification: A deep neural network approach,
E. Zisselman, A. Adler, and M. Elad, “Compressed learning for image classification: A deep neural network approach,” inHandbook of Numer- ical Analysis. Elsevier, 2018, vol. 19, pp. 3–17
2018
-
[23]
Enabling on-device classification of ecg with compressed learning for health iot,
W. Li, H. Chu, B. Huang, Y. Huan, L. Zheng, and Z. Zou, “Enabling on-device classification of ecg with compressed learning for health iot,” Microelectronics Journal, vol. 115, p. 105188, 2021
2021
-
[24]
Spatial control of defect creation in graphene at the nanoscale,
A. W. Robertson, C. S. Allen, Y. A. Wu, K. He, J. Olivier, J. Neethling, A. I. Kirkland, and J. H. Warner, “Spatial control of defect creation in graphene at the nanoscale,”Nature communications, vol. 3, no. 1, p. 1144, 2012
2012
-
[25]
The discrete-dipole-approximation code adda: Capabilities and known limitations,
M. A. Yurkin and A. G. Hoekstra, “The discrete-dipole-approximation code adda: Capabilities and known limitations,”Journal of Quantitative Spectroscopy and Radiative Transfer, vol. 112, no. 13, pp. 2234–2247, 2011
2011
-
[26]
Scatterometric defect measurements–uncertainty assessment by means of a virtual instrument and a statistical analysis,
T. M. H. Rahman, D. St ¨obener, and A. Fischer, “Scatterometric defect measurements–uncertainty assessment by means of a virtual instrument and a statistical analysis,”Surface Topography: Metrology and Properties, vol. 12, no. 3, p. 035019, 2024
2024
-
[27]
Compressed learning for nanosurface deficiency recognition using angle-resolved scatterometry data,
M. Abdollahpour, C. Bockelmann, T. M. H. Rahman, A. Dekorsy, and A. Fischer, “Compressed learning for nanosurface deficiency recognition using angle-resolved scatterometry data,”IEEE Access, pp. 1–1, 2026
2026
-
[28]
Estimating or propagating gradients through stochastic neurons for conditional computation,
Y. Bengio, N. L ´eonard, and A. Courville, “Estimating or propagating gradients through stochastic neurons for conditional computation,”arXiv preprint arXiv:1308.3432, 2013
Pith/arXiv arXiv 2013
-
[29]
Machine learning techniques applied for the detection of nanoparticles on surfaces using coherent fourier scatterome- try,
D. Kolenov and S. Pereira, “Machine learning techniques applied for the detection of nanoparticles on surfaces using coherent fourier scatterome- try,”Optics Express, vol. 28, no. 13, pp. 19 163–19 186, 2020
2020
-
[30]
Advanced euv resist characterization using scatterometry and machine learning,
D. Schmidt, K. Petrillo, M. Breton, J. Fullam, R. Koret, I. Turovets, and A. Cepler, “Advanced euv resist characterization using scatterometry and machine learning,” in2021 32nd Annual SEMI Advanced Semiconductor Manufacturing Conference (ASMC). IEEE, 2021, pp. 1–4
2021
-
[31]
Machine learning for scattering data: strategies, perspec- tives and applications to surface scattering,
A. Hinderhofer, A. Greco, V. Starostin, V. Munteanu, L. Pithan, A. Gerlach, and F. Schreiber, “Machine learning for scattering data: strategies, perspec- tives and applications to surface scattering,”Applied Crystallography, vol. 56, no. 1, pp. 3–11, 2023
2023
-
[32]
Scaling laws for neural language models,
J. Kaplan, S. McCandlish, T. Henighan, T. B. Brown, B. Chess, R. Child, S. Gray, A. Radford, J. Wu, and D. Amodei, “Scaling laws for neural language models,”arXiv preprint arXiv:2001.08361, 2020
Pith/arXiv arXiv 2001
-
[33]
A survey on image data augmentation for deep learning,
C. Shorten and T. M. Khoshgoftaar, “A survey on image data augmentation for deep learning,”Journal of big data, vol. 6, no. 1, pp. 1–48, 2019
2019
-
[34]
Discrete-dipole approximation for scattering calculations,
B. T. Draine and P. J. Flatau, “Discrete-dipole approximation for scattering calculations,”JOSA A, vol. 11, no. 4, pp. 1491–1499, 1994
1994
-
[35]
The discrete dipole approximation for simulation of light scattering by particles much larger than the wave- length,
M. A. Yurkin and A. G. Hoekstra, “The discrete dipole approximation for simulation of light scattering by particles much larger than the wave- length,”Journal of Quantitative Spectroscopy and Radiative Transfer, vol. 106, no. 1-3, pp. 558–589, 2007
2007
-
[36]
Accurate computation of electric field enhancement factors for metallic nanoparticles using the discrete dipole approximation,
A. E. DePrince and R. J. Hinde, “Accurate computation of electric field enhancement factors for metallic nanoparticles using the discrete dipole approximation,”Nanoscale research letters, vol. 5, pp. 592–596, 2010
2010
-
[37]
Generative adversarial networks,
I. Goodfellow, J. Pouget-Abadie, M. Mirza, B. Xu, D. Warde-Farley, S. Ozair, A. Courville, and Y. Bengio, “Generative adversarial networks,” Communications of the ACM, vol. 63, no. 11, pp. 139–144, 2020
2020
-
[38]
Generative adversarial nets,
I. J. Goodfellow, J. Pouget-Abadie, M. Mirza, B. Xu, D. Warde-Farley, S. Ozair, A. Courville, and Y. Bengio, “Generative adversarial nets,” in Advances in Neural Information Processing Systems, Z. Ghahramani, M. Welling, C. Cortes, N. Lawrence, and K. Weinberger, Eds., vol. 27. Curran Associates, Inc., 2014
2014
-
[39]
Conditional generative adversarial nets,
M. Mirza and S. Osindero, “Conditional generative adversarial nets,”arXiv preprint arXiv:1411.1784, 2014
Pith/arXiv arXiv 2014
-
[40]
Improved training of wasserstein gans,
I. Gulrajani, F. Ahmed, M. Arjovsky, V. Dumoulin, and A. C. Courville, “Improved training of wasserstein gans,”Advances in neural information processing systems, vol. 30, 2017
2017
-
[41]
M. Arjovsky, S. Chintala, and L. Bottou, “Wasserstein gan,” 2017. [Online]. Available: https://arxiv.org/abs/1701.07875
Pith/arXiv arXiv 2017
-
[42]
Adam: A method for stochastic optimization,
D. P. Kingma, “Adam: A method for stochastic optimization,”arXiv preprint arXiv:1412.6980, 2014
Pith/arXiv arXiv 2014
-
[43]
Angle-resolved optical characterization of a plasmonic trian- gular array of elliptical holes in a gold layer,
M. Angelini, K. Jefimovs, P. Pellacani, D. Kazazis, F. Marabelli, and F. Floris, “Angle-resolved optical characterization of a plasmonic trian- gular array of elliptical holes in a gold layer,”Optics, vol. 5, no. 1, pp. 195–206, 2024
2024
-
[44]
Hyperspectral imag- ing for high-throughput, spatially resolved spectroscopic scatterometry of silicon nanopillar arrays,
B. Gawlik, C. Barrera, E. T. Yu, and S. Sreenivasan, “Hyperspectral imag- ing for high-throughput, spatially resolved spectroscopic scatterometry of silicon nanopillar arrays,”Optics express, vol. 28, no. 10, pp. 14 209– 14 221, 2020
2020
-
[45]
Efficient rigorous coupled-wave analysis simulation of mueller matrix ellipsometry of three-dimensional multilayer nanostructures,
H.-L. Pham, T. Alcaire, S. Soulan, D. Le Cunff, and J.-H. Tortai, “Efficient rigorous coupled-wave analysis simulation of mueller matrix ellipsometry of three-dimensional multilayer nanostructures,”Nanomaterials, vol. 12, no. 22, p. 3951, 2022. Mehdi Abdollahpourreceived the B.Sc. degree in Electrical Engineering (Electronics) and the M.Sc. degree in Biom...
2022
discussion (0)
Sign in with ORCID, Apple, or X to comment. Anyone can read and Pith papers without signing in.