Faraday Complexity and Depolarisation in a High-Rotation-Measure Radio Galaxy from the Spectra and Polarisation In Cutouts of Extragalactic Sources (SPICE-RACS) DR2
Pith reviewed 2026-06-27 19:49 UTC · model grok-4.3
The pith
Broadband data show a high-rotation-measure radio galaxy requires one Burn-slab and two external Faraday dispersion components.
A machine-rendered reading of the paper's core claim, the machinery that carries it, and where it could break.
Core claim
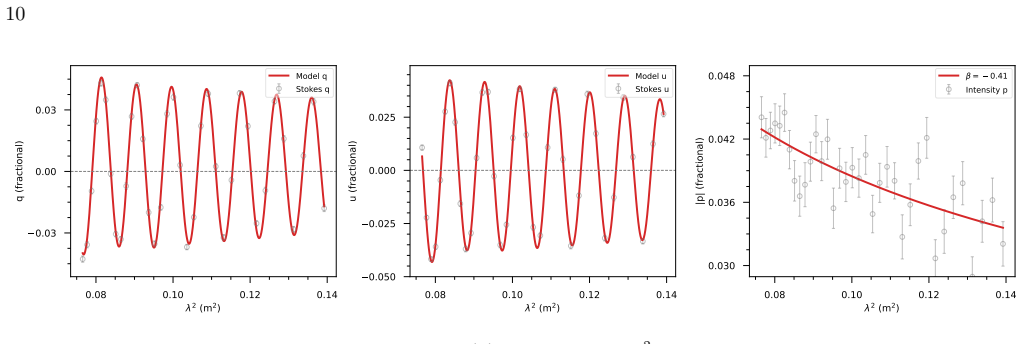
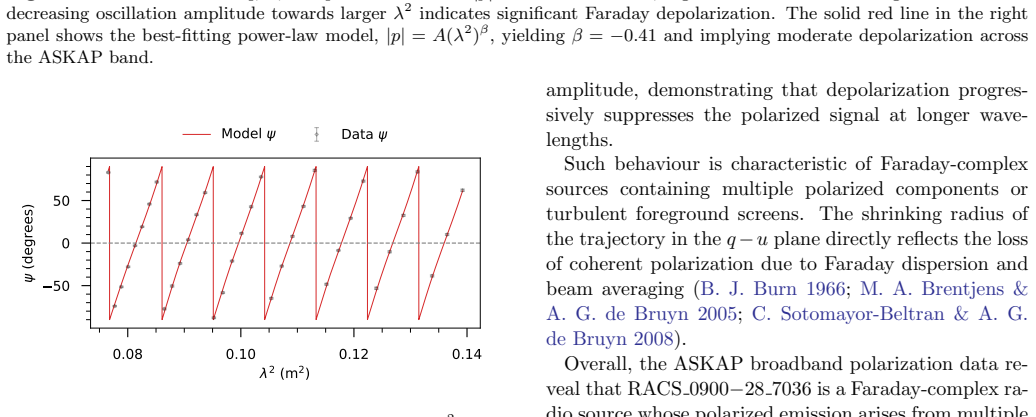
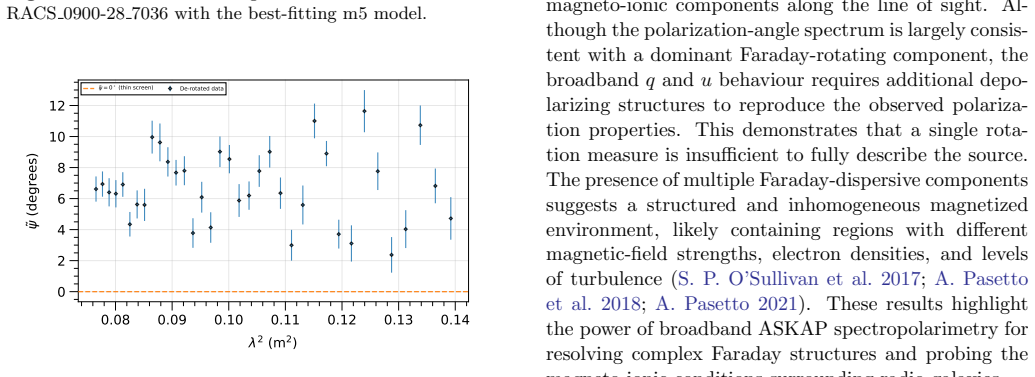
One-dimensional q-u fitting and Bayesian model selection identify a multi-component model comprising one Burn-slab component and two external Faraday dispersion components as the preferred description for the source RACS_0900-28_7036, with the dominant component at RM approximately 345.5 rad m^{-2} and a secondary at 131.5 rad m^{-2} showing stronger dispersion.
What carries the argument
Bayesian model selection applied to one-dimensional q-u fitting across 36 spectral channels to identify the number and type of Faraday components.
If this is right
- The dominant astrophysical component has RM of 345.5 rad m^{-2} with modest Faraday dispersion of about 3 rad m^{-2}.
- A secondary component at RM 131.5 rad m^{-2} exhibits strong depolarization with sigma_RM of 19.5 rad m^{-2}.
- The fractional polarization spectrum and q-u plane evolution confirm multiple Faraday-active regions.
- This provides a framework for systematic depolarization studies across the full SPICE-RACS catalog.
Where Pith is reading between the lines
- Similar multi-component fitting could be applied to other high-RM sources to map magnetic field structures in galaxy clusters or intervening media.
- If the model holds, it suggests that line-of-sight integration through turbulent media produces distinct dispersion signatures that broadband data can separate.
- Extending this to statistical samples may reveal correlations between Faraday complexity and source properties like redshift or environment.
Load-bearing premise
The frequency coverage and signal-to-noise ratio are sufficient for Bayesian model selection to reliably distinguish the true number and type of Faraday components rather than selecting an overparameterized model due to noise.
What would settle it
New observations at higher frequencies or with finer channel resolution that yield a different preferred model with fewer or more components would falsify the current identification.
Figures


read the original abstract
We present a broadband spectro-polarimetric analysis of the extragalactic radio source \texttt{RACS\_0900-28\_7036} using SPICE-RACS DR2 observations with the Australian Square Kilometre Array Pathfinder (ASKAP). The source was selected for its large rotation measure (${\rm RM}=345.7\pm0.2~{\rm rad~m^{-2}}$), substantial excess relative to the local foreground ($\Delta {\rm RM}\approx171~{\rm rad~m^{-2}}$), and strong evidence of Faraday complexity ($\sigma_{\rm add}/\delta\sigma_{\rm add}\approx8.6$). Observations span 803--1083~MHz in 36 spectral channels, enabling detailed characterization of Faraday rotation and wavelength-dependent depolarization. One-dimensional $q$-$u$ fitting and Bayesian model selection identify a multi-component model comprising one Burn-slab component and two external Faraday dispersion components (1 Slab + 2 EFD) as the preferred description. The dominant astrophysical component exhibits ${\rm RM}\approx345.5~{\rm rad~m^{-2}}$ with modest Faraday dispersion ($\sigma_{\rm RM}\approx3~{\rm rad~m^{-2}}$), while a secondary broader component at ${\rm RM}\approx131.5~{\rm rad~m^{-2}}$ shows strong depolarization ($\sigma_{\rm RM}\approx19.5~{\rm rad~m^{-2}}$). The fractional polarization spectrum and $q$--$u$ plane evolution further confirm multiple Faraday-active regions along the line of sight. These results demonstrate that ASKAP broadband spectropolarimetry can resolve complex Faraday structures and probe turbulent magnetized environments, providing a framework for systematic depolarization studies across the full SPICE-RACS catalog and enabling statistical investigations of Faraday complexity in diverse extragalactic radio sources.
Editorial analysis
A structured set of objections, weighed in public.
Referee Report
Summary. The paper presents a broadband spectro-polarimetric analysis of the extragalactic source RACS_0900-28_7036 from SPICE-RACS DR2 ASKAP observations spanning 803-1083 MHz in 36 channels. It reports a high RM of 345.7±0.2 rad m^{-2} with excess relative to the foreground and strong evidence of Faraday complexity (σ_add/δσ_add≈8.6). One-dimensional q-u fitting combined with Bayesian model selection identifies a preferred 1 Burn-slab + 2 external Faraday dispersion (EFD) model, with component parameters RM≈345.5 rad m^{-2} (σ_RM≈3) and RM≈131.5 rad m^{-2} (σ_RM≈19.5). The work positions this as a demonstration for systematic studies across the SPICE-RACS catalog.
Significance. If the model identification holds, the result provides a concrete example of resolving multiple Faraday-active regions along the line of sight with ASKAP broadband data and supplies a template for depolarization analysis in the larger catalog. This could support statistical investigations of turbulent magnetized environments in extragalactic sources. The specific RM and dispersion values add to the sample of complex high-RM objects, though the single-source nature limits broader impact without the promised catalog framework.
major comments (2)
- [Abstract] The central claim rests on Bayesian model selection preferring the 1 Slab + 2 EFD model, yet the manuscript (including the abstract) does not report log-evidence differences, prior sensitivity tests, or simulation-based calibration using the exact 36-channel, 280 MHz coverage and reported S/N. This leaves open whether the selection reliably separates the quoted components (RM≈345.5, σ_RM≈3; RM≈131.5, σ_RM≈19.5) from noise or model mismatch.
- [Abstract] The supporting metric σ_add/δσ_add≈8.6 is presented as evidence of complexity, but without an explicit definition of how σ_add is computed from the data or its quantitative link to the evidence ratios for the multi-component model, it is unclear whether this metric independently validates the preferred description.
minor comments (2)
- Notation for the source name (RACS_0900-28_7036) and component labels (1 Slab + 2 EFD) should be defined at first use and kept consistent throughout.
- The fractional polarization spectrum and q-u plane evolution are cited as confirmatory but lack a dedicated figure or quantitative comparison to the fitted model predictions.
Simulated Author's Rebuttal
We thank the referee for their constructive comments on our manuscript. We address each major comment below and will revise the manuscript to incorporate additional quantitative details on the Bayesian model selection and the complexity metric.
read point-by-point responses
-
Referee: [Abstract] The central claim rests on Bayesian model selection preferring the 1 Slab + 2 EFD model, yet the manuscript (including the abstract) does not report log-evidence differences, prior sensitivity tests, or simulation-based calibration using the exact 36-channel, 280 MHz coverage and reported S/N. This leaves open whether the selection reliably separates the quoted components (RM≈345.5, σ_RM≈3; RM≈131.5, σ_RM≈19.5) from noise or model mismatch.
Authors: We agree that explicit reporting of log-evidence differences would strengthen the abstract and main text. In the revised manuscript we will add the specific ΔlogZ values showing the preferred 1 Slab + 2 EFD model is strongly favored (ΔlogZ > 10 relative to simpler models). Prior sensitivity tests were performed by varying the prior ranges on RM and σ_RM; the model ranking remained unchanged and we will include a concise statement of this result. Targeted simulations matching the 36-channel, 280 MHz coverage and observed S/N were used to confirm reliable separation of the quoted components from noise; we will add a brief description of these calibration tests. revision: yes
-
Referee: [Abstract] The supporting metric σ_add/δσ_add≈8.6 is presented as evidence of complexity, but without an explicit definition of how σ_add is computed from the data or its quantitative link to the evidence ratios for the multi-component model, it is unclear whether this metric independently validates the preferred description.
Authors: σ_add is the additional Faraday dispersion parameter recovered from the posterior in the one-dimensional q-u fit (distinct from the observational noise), and δσ_add is its 1σ uncertainty; the ratio therefore quantifies the detection significance of extra complexity. We will revise the abstract and methods to provide this explicit definition and add a sentence noting that the observed value of ≈8.6 is consistent with the Bayesian evidence ratios that favor the multi-component model over single-component alternatives. revision: yes
Circularity Check
No circularity: results are direct fits to observational data
full rationale
The paper performs one-dimensional q-u fitting and Bayesian model selection on SPICE-RACS DR2 spectro-polarimetric data for source RACS_0900-28_7036. The reported RM values, dispersions, and preferred 1 Slab + 2 EFD model are outputs of this data-driven procedure rather than inputs redefined or predicted from prior self-citations. No self-definitional loops, fitted parameters renamed as predictions, or load-bearing self-citations appear in the abstract or described methods. The derivation chain is self-contained against external radio data and standard Faraday rotation formalism.
Axiom & Free-Parameter Ledger
free parameters (1)
- RM values and sigma_RM for each component
axioms (2)
- domain assumption The Burn-slab and external Faraday dispersion models are adequate physical descriptions of the observed polarization behavior.
- domain assumption Bayesian model selection on the q-u data can correctly identify the number of distinct Faraday components.
Reference graph
Works this paper leans on
-
[1]
, archiveprefix = "arXiv", eprint =
Anderson, C. S., Gaensler, B. M., & Feain, I. J. 2016, ApJ, 825, 59, doi: 10.3847/0004-637X/825/1/59
-
[2]
, archiveprefix = "arXiv", eprint =
Anderson, C. S., Gaensler, B. M., Feain, I. J., & Franzen, T. M. O. 2015, ApJ, 815, 49, doi: 10.1088/0004-637X/815/1/49
-
[3]
Anderson, C. S., Gaensler, B. M., Heald, G. H., et al. 2018, Monthly Notices of the Royal Astronomical Society, 479, 1436, doi: 10.1093/mnras/sty1747
-
[4]
Anderson, C. S., Heald, G. H., Eilek, J. A., et al. 2021, Publications of the Astronomical Society of Australia, 38, e020, doi: 10.1017/pasa.2021.14
-
[5]
Anderson, C. S., et al. 2023, Monthly Notices of the Royal Astronomical Society, doi: 10.1093/mnras/stad2458
-
[6]
Monthly Notices of the Royal Astronomical Society , volume =
Anderson, C. S., McClure-Griffiths, N. M., Rudnick, L., et al. 2024, MNRAS, 533, 4068, doi: 10.1093/mnras/stae1954
-
[7]
Brentjens, M. A., & de Bruyn, A. G. 2005, Astronomy and Astrophysics, 441, 1217, doi: 10.1051/0004-6361:20052990
-
[8]
Brentjens, M. A., de Bruyn, A. G., Pizzo, R. F., et al. 2019, Astronomy & Astrophysics, 628, A10, doi: 10.1051/0004-6361/201935651
-
[9]
Burn, B. J. 1966, Monthly Notices of the Royal Astronomical Society, 133, 67, doi: 10.1093/mnras/133.1.67
-
[10]
Carretti, E., Vacca, V., O’Sullivan, S. P., et al. 2022, MNRAS, 512, 945, doi: 10.1093/mnras/stac384
-
[11]
Dickey, J. M., West, J., Thomson, A. J. M., et al. 2022, ApJ, 940, 75, doi: 10.3847/1538-4357/ac94ce
-
[12]
Eck, C. L. V., Purcell, C. R., Baidoo, L., et al. 2026, The Astrophysical Journal Supplement Series, 283, 28, doi: 10.3847/1538-4365/ae3dea 13
-
[13]
2011, The Astronomical Journal, 141, 191, doi: 10.1088/0004-6256/141/6/191
Farnsworth, D., Rudnick, L., & Brown, S. 2011, The Astronomical Journal, 141, 191, doi: 10.1088/0004-6256/141/6/191
-
[14]
Feroz, F., & Hobson, M. P. 2008, Monthly Notices of the Royal Astronomical Society, 384, 449–463, doi: 10.1111/j.1365-2966.2007.12353.x
-
[15]
Feroz, F., Hobson, M. P., & Bridges, M. 2009, Monthly Notices of the Royal Astronomical Society, 398, 1601–1614, doi: 10.1111/j.1365-2966.2009.14548.x
-
[16]
Importance Nested Sampling and the MultiNest Algorithm
Feroz, F., Hobson, M. P., Cameron, E., & Pettitt, A. N. 2019, The Open Journal of Astrophysics, 2, doi: 10.21105/astro.1306.2144 Ferri` ere, K., West, J. L., & Jaffe, T. R. 2021, MNRAS, 507, 4968, doi: 10.1093/mnras/stab1641
work page internal anchor Pith review Pith/arXiv arXiv doi:10.21105/astro.1306.2144 2019
-
[17]
Gaensler, B. M., Beck, R., & Feretti, L. 2004, New Astronomy Reviews, 48, 1003, doi: 10.1016/j.newar.2004.09.014
-
[18]
Gaensler, B. M., Beck, R., & Feretti, L. 2005, New Astronomy Reviews, 49, 227, doi: 10.1016/j.newar.2004.12.003
-
[19]
Gaensler, B. M., Heald, G. H., McClure-Griffiths, N. M., et al. 2025, Publications of the Astronomical Society of Australia, 42, e091, doi: 10.1017/pasa.2025.10031
-
[20]
Dennett-Thorpe, J. 2004, MNRAS, 347, 508, doi: 10.1111/j.1365-2966.2004.07225.x
-
[21]
Green, J. A. 2006, ApJ Letters, 637, L33, doi: 10.1086/500543
-
[22]
Harvey-Smith, L., Madsen, G. J., & Gaensler, B. M. 2011, ApJ, 736, 83, doi: 10.1088/0004-637X/736/2/83
-
[23]
Hotan, A. W., Bunton, J. D., Chippendale, A. P., et al. 2021, Publications of the Astronomical Society of Australia, 38, e009, doi: 10.1017/pasa.2021.1
-
[24]
Hutschenreuter, S. e. a. 2022, A&A, 663, A127, doi: 10.1051/0004-6361/202142733 Jeli´ c, V., de Bruyn, A. G., Mevius, M., et al. 2014, Astronomy and Astrophysics, 568, A101, doi: 10.1051/0004-6361/201423998
-
[25]
Kass, R. E., & Raftery, A. E. 1995, Journal of the American Statistical Association, 90, 773, doi: 10.1080/01621459.1995.10476572
-
[26]
Laing, R. A., Bridle, A. H., Parma, P., & Murgia, M. 2008, MNRAS, 391, 521, doi: 10.1111/j.1365-2966.2008.13895.x
-
[27]
Livingston, J. D., McClure-Griffiths, N. M., Mao, S. A., et al. 2022, MNRAS, 510, 260, doi: 10.1093/mnras/stab3375
-
[28]
Malik, S., O’Sullivan, S. P., Thomson, A. J. M., et al. 2026, arXiv e-prints. https://arxiv.org/abs/2605.16924
Pith/arXiv arXiv 2026
-
[29]
Mao, S. A., Gaensler, B. M., Haverkorn, M., et al. 2010, ApJ, 714, 1170, doi: 10.1088/0004-637X/714/2/1170
-
[30]
L., Lenc, E., Banfield, et al.\ 2020
McConnell, D., Hale, C. L., Lenc, E., Banfield, J. K., et al. 2020, Publications of the Astronomical Society of Australia, 37, doi: 10.1017/pasa.2020.41
-
[31]
2018, RMextract: Ionospheric Faraday Rotation calculator,, Astrophysics Source Code Library, record ascl:1806.024
Mevius, M. 2018, RMextract: Ionospheric Faraday Rotation calculator,, Astrophysics Source Code Library, record ascl:1806.024
2018
-
[32]
Oei, M. S. S. L., van Weeren, R. J., Gast, A. R. D. J. G. I. B., et al. 2023, Astronomy and Astrophysics, 672, A163, doi: 10.1051/0004-6361/202243572 O’Sullivan, S. P., Gaensler, B. M., Lara-L´ opez, M. A., et al. 2015, The Astrophysical Journal, 806, 83, doi: 10.1088/0004-637x/806/1/83 O’Sullivan, S. P., Purcell, C. R., Anderson, C. S., et al. 2017, Mon....
-
[33]
2021, Galaxies, 9, doi: 10.3390/galaxies9030056
Pasetto, A. 2021, Galaxies, 9, doi: 10.3390/galaxies9030056
-
[34]
2018, Astronomy and Astrophysics, 613, A74, doi: 10.1051/0004-6361/201731804
Pasetto, A., Carrasco-Gonz´ alez, C., O’Sullivan, S., et al. 2018, Astronomy and Astrophysics, 613, A74, doi: 10.1051/0004-6361/201731804
-
[35]
2016, Galaxies, 4, doi: 10.3390/galaxies4040066
Pasetto, A., Carrasco-Gonz´ alez, C., Bruni, G., et al. 2016, Galaxies, 4, doi: 10.3390/galaxies4040066
-
[36]
Paul, S. S., & Ghosh, A. 2026, The Open Journal of Astrophysics, 9, 57500, doi: 10.33232/001c.157500
-
[37]
2024, Phd thesis, Chalmers University of
Piras, S. 2024, Phd thesis, Chalmers University of
2024
-
[38]
Gaensler, B. M. 2020, RM-Tools: Rotation measure (RM) synthesis and Stokes QU-fitting,, Astrophysics Source Code Library, record ascl:2005.003
2020
-
[39]
C., Dallacasa, D., Fanti, C., Fanti, R., & Mack, K.-H
Rossetti, L. C., Dallacasa, D., Fanti, C., Fanti, R., & Mack, K.-H. 2008, Astronomy & Astrophysics, 487, 865, doi: 10.1051/0004-6361:200809531
-
[40]
B., & Lightman, A
Rybicki, G. B., & Lightman, A. P. 1979, Wiley-Interscience, 394
1979
-
[41]
Shimwell, T. W., Hardcastle, M. J., Tasse, C., et al. 2022, Astronomy and Astrophysics, 659, A1, doi: 10.1051/0004-6361/202142484
-
[42]
Shimwell, T. W., Hardcastle, M. J., Tasse, C., et al. 2026, Astronomy and Astrophysics, 707, A198, doi: 10.1051/0004-6361/202557749 14
-
[43]
Sinha, R., & Ghosh, A. 2026, arXiv e-prints, arXiv:2605.19226, doi: 10.48550/arXiv.2605.19226
work page internal anchor Pith review Pith/arXiv arXiv doi:10.48550/arxiv.2605.19226 2026
-
[44]
Sokoloff, D. D., Bykov, A. A., Shukurov, A., et al. 1998, MNRAS, 299, 189, doi: 10.1046/j.1365-8711.1998.01782.x
-
[45]
Sotomayor-Beltran, C., & de Bruyn, A. G. 2008, A&A, 489, 1013
2008
-
[46]
Strom, R. G. 1973, Astronomy and Astrophysics, 25, 303
1973
-
[47]
2025, Astronomy and Astrophysics, 694, A169, doi: 10.1051/0004-6361/202453326
Sun, X., Haverkorn, M., Carretti, E., et al. 2025, Astronomy and Astrophysics, 694, A169, doi: 10.1051/0004-6361/202453326
-
[49]
H., Rudnick, L., Akahori, T., et al
Sun, X. H., Rudnick, L., Akahori, T., et al. 2015b, The Astronomical Journal, 149, 60, doi: 10.1088/0004-6256/149/2/60
-
[50]
Taylor, A. R., Stil, J. M., & Sunstrum, C. 2009, ApJ, 702, 1230, doi: 10.1088/0004-637X/702/2/1230
-
[51]
Monthly Notices of the Royal Astronomical Society , volume =
Taylor, A. R., Sekhar, S., Heino, L., et al. 2024, Monthly Notices of the Royal Astronomical Society, 528, 2511, doi: 10.1093/mnras/stae169
-
[52]
Thomson, A. J. M., McConnell, D., Lenc, E., et al. 2023, PASA, 40, e040, doi: 10.1017/pasa.2023.38
-
[53]
Thomson, A. J. M., Galvin, T. J., Duchesne, S. W., et al. 2026, arXiv e-prints, arXiv:2605.16917, doi: 10.48550/arXiv.2605.16917 Van Eck, C. L. 2025, FRion: Time averaged correction of Faraday Rotation from the IONosphere,, Astrophysics Source Code Library, record ascl:2508.001 http://ascl.net/2508.001
work page internal anchor Pith review Pith/arXiv arXiv doi:10.48550/arxiv.2605.16917 2026
discussion (0)
Sign in with ORCID, Apple, or X to comment. Anyone can read and Pith papers without signing in.