Quality Assessment of Spectroscopic Data Reduction Pipelines Using Artificial Intelligence: Scrutinizing Data Release 2 from the DESI Survey
Pith reviewed 2026-06-26 13:43 UTC · model grok-4.3
The pith
An unsupervised clustering method flags reduction artifacts in 67 percent of DESI outlier spectra that standard pipelines leave unflagged.
A machine-rendered reading of the paper's core claim, the machinery that carries it, and where it could break.
Core claim
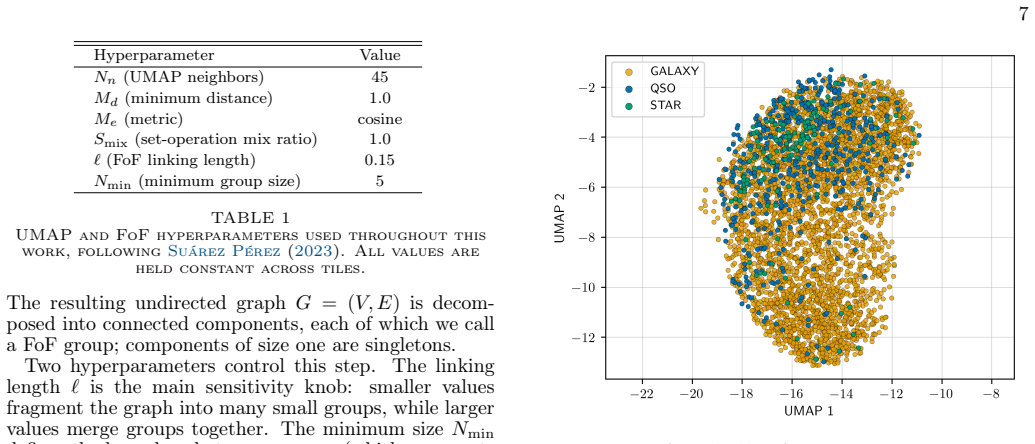
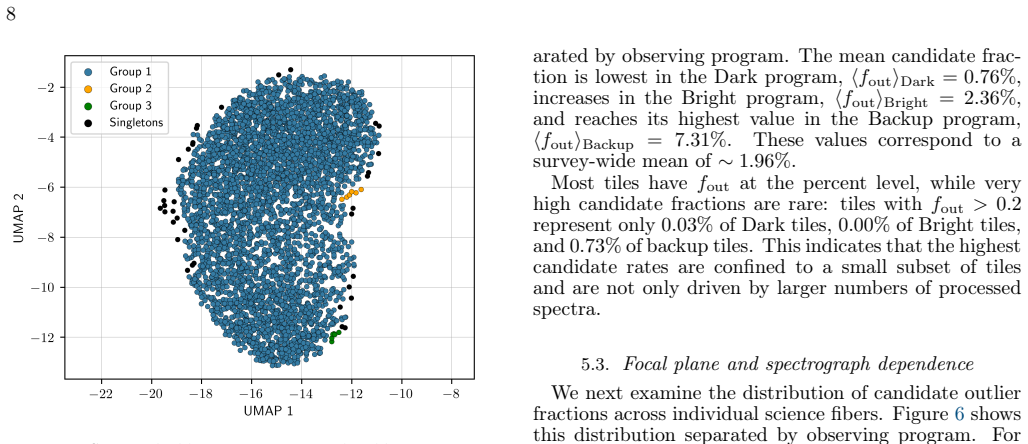
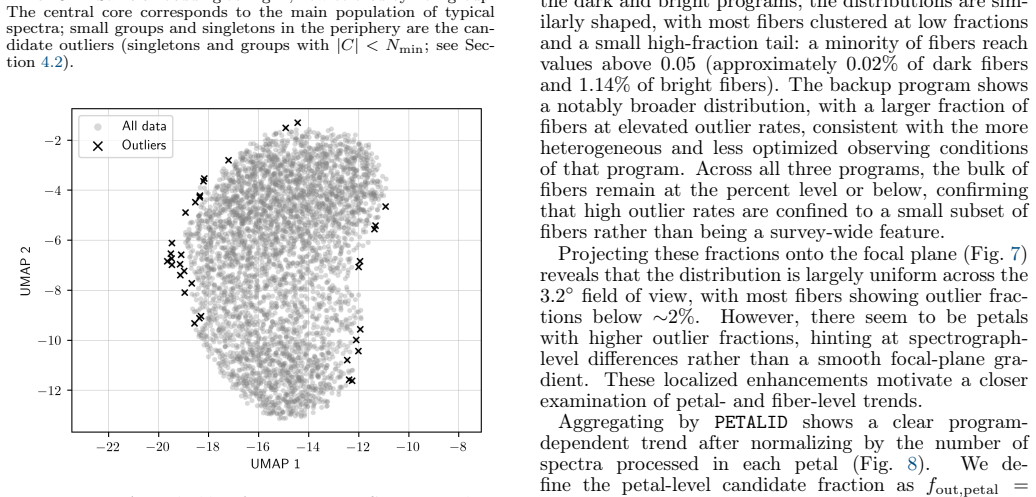
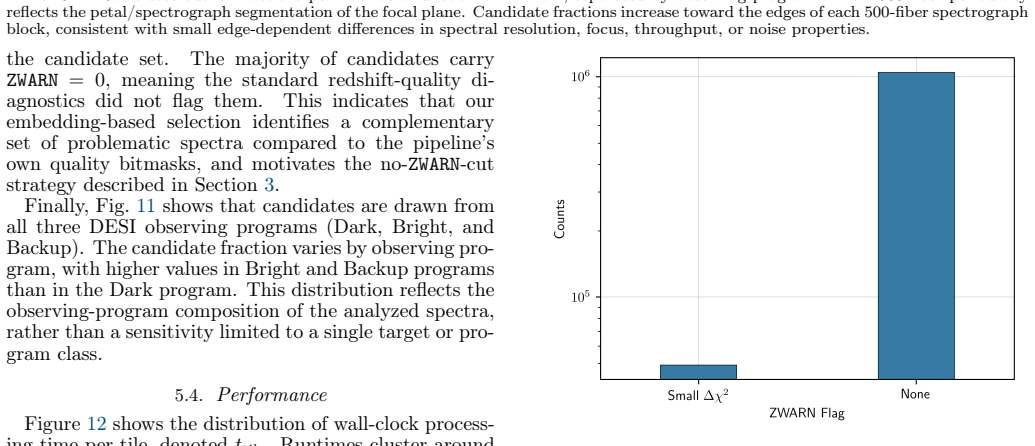
The pipeline applies UMAP dimensionality reduction and Friends-of-Friends clustering independently to each tile, separating a dense core of typical spectra from small isolated groups and singletons that total 1,095,816 candidates. Inspection of 391 sampled outliers from the main survey programs finds that 66.8 percent show identifiable reduction and calibration effects, while only 4.1 percent carry non-zero quality flags from the standard pipeline. Extrapolating to the full main-survey catalog yields an estimate of roughly 218,000 candidates free of such artifacts.
What carries the argument
UMAP dimensionality reduction combined with Friends-of-Friends clustering applied independently per tile to separate typical spectra from isolated outliers.
If this is right
- The method supplies a complementary quality-assessment layer that recovers a substantial population of problematic spectra missed by standard diagnostics.
- Roughly 218,000 candidate outliers appear free of reduction artifacts and may represent genuine atypical spectra.
- The approach is scalable and reproducible across successive data releases for ongoing monitoring.
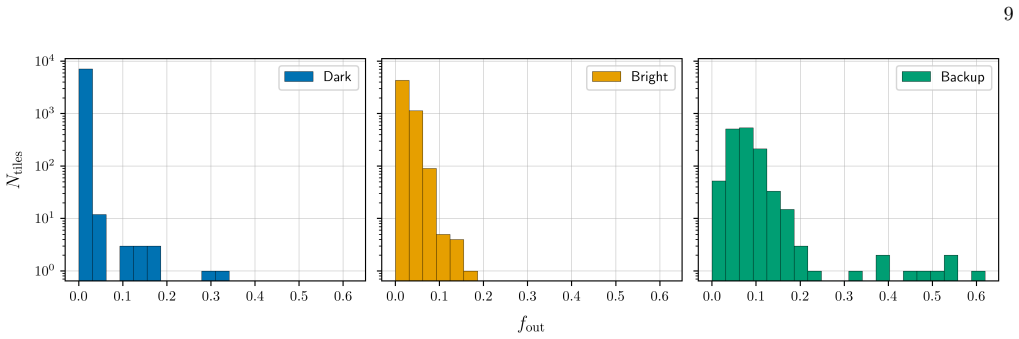
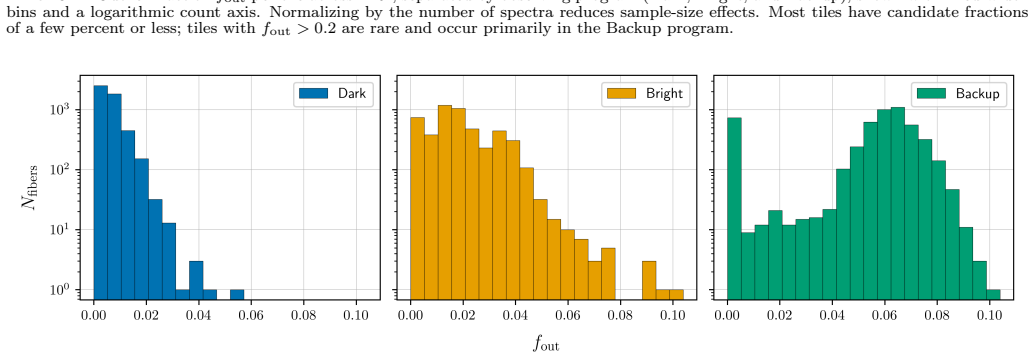
- Mean outlier fractions are 0.76 percent in dark programs and 2.36 percent in bright programs.
Where Pith is reading between the lines
- The same per-tile clustering workflow could be applied to data from other large spectroscopic surveys to surface hidden reduction issues.
- The estimated 218,000 artifact-free outliers merit targeted follow-up observations to determine whether they correspond to rare astronomical objects.
- Adjusting clustering parameters with feedback from more inspections could sharpen the separation between artifacts and valid but unusual spectra.
Load-bearing premise
The selected UMAP and Friends-of-Friends parameters per tile isolate reduction artifacts rather than genuine rare spectra, and the 391 inspected candidates represent the full set of over one million outliers.
What would settle it
A larger visual inspection of several thousand randomly selected candidates that finds the fraction with identifiable reduction anomalies falling below 50 percent would undermine the claim that the method reliably recovers missed problematic spectra.
Figures


read the original abstract
Large spectroscopic surveys now collect data at a scale that makes traditional visual inspection impractical. We present an unsupervised pipeline for spectroscopic quality assessment that requires no labeled training data. The method combines Uniform Manifold Approximation and Projection for dimensionality reduction with Friends-of-Friends clustering to isolate anomalous spectra for targeted review. We apply this pipeline to 58,291,334 spectra across 14,199 tiles from DESI Data Release 2, processing each tile independently to produce a tile-level outlier catalog. In each tile, the pipeline separates a dense core of typical spectra from small, isolated components and singletons, yielding a total of 1,095,816 outlier candidates. The mean tile-level outlier fraction is about 1.96 percent overall, with values of 0.76 percent and 2.36 percent for the dark and bright main-survey programs, respectively. From the visual inspection of 391 outlier candidates from the dark and bright programs of the main survey, we find that 66.8 percent exhibit identifiable spectral anomalies consistent with known reduction and calibration effects. By contrast, only 4.1 percent carry a non-zero quality flag from the standard reduction pipeline. This shows that the method provides a complementary quality-assessment layer to existing pipeline diagnostics and recovers a substantial population of problematic spectra that standard diagnostics miss. Extrapolating to the main-survey catalog, we estimate that approximately 218,000 candidate outliers are free of identifiable reduction artifacts and may correspond to genuine atypical spectra in the context of DESI. The pipeline is scalable, reproducible, and directly comparable across successive data releases, making it a practical quality-assurance monitor for DESI and future multi-object spectroscopic surveys.
Editorial analysis
A structured set of objections, weighed in public.
Referee Report
Summary. The paper presents an unsupervised pipeline combining UMAP dimensionality reduction and Friends-of-Friends clustering to detect anomalous spectra in DESI DR2 without labeled training data. Applied tile-by-tile to 58,291,334 spectra, it identifies 1,095,816 outlier candidates (mean fraction ~1.96%). Visual inspection of 391 candidates from dark/bright main-survey programs finds 66.8% with identifiable reduction/calibration anomalies, compared to only 4.1% flagged by the standard pipeline. The work claims complementarity to existing diagnostics and extrapolates to ~218,000 genuine atypical spectra, positioning the method as a scalable QA monitor for DESI and future surveys.
Significance. If the central results hold, the approach offers a practical, reproducible, label-free tool for quality assessment at the scale of modern spectroscopic surveys, directly addressing the impracticality of full visual inspection. Strengths include the tile-independent processing (avoiding global parameter biases), the large application to 14,199 tiles, and the explicit comparison to standard quality flags. The extrapolation to 218k genuine outliers provides a falsifiable prediction for targeted follow-up. However, the significance is tempered by the small inspected sample size and lack of reported sampling/parameter details, which limit confidence in the complementarity claim.
major comments (1)
- [Abstract / Results] Abstract and Results (visual inspection paragraph): The claim that 66.8% of inspected candidates show reduction artifacts (vs. 4.1% standard flags) is load-bearing for the complementarity conclusion and the 218k extrapolation. The manuscript provides no information on how the 391 candidates were selected from the 1,095,816 (random, score-stratified, or otherwise), nor on inter-rater reliability or exact UMAP/FoF hyperparameters per tile. Without this, the inspected fraction cannot be shown to be representative, undermining generalization to the full set.
minor comments (2)
- [Abstract] The reported mean outlier fractions (0.76% dark, 2.36% bright) would benefit from accompanying standard deviations or tile-to-tile histograms to convey variability.
- [Methods] Notation for the outlier catalog (e.g., how singletons vs. small clusters are defined) should be clarified with a brief equation or pseudocode in the methods.
Simulated Author's Rebuttal
We thank the referee for their thoughtful review and for identifying a point that requires clarification to strengthen the manuscript. We address the major comment below and will revise the paper accordingly.
read point-by-point responses
-
Referee: [Abstract / Results] Abstract and Results (visual inspection paragraph): The claim that 66.8% of inspected candidates show reduction artifacts (vs. 4.1% standard flags) is load-bearing for the complementarity conclusion and the 218k extrapolation. The manuscript provides no information on how the 391 candidates were selected from the 1,095,816 (random, score-stratified, or otherwise), nor on inter-rater reliability or exact UMAP/FoF hyperparameters per tile. Without this, the inspected fraction cannot be shown to be representative, undermining generalization to the full set.
Authors: We agree that the manuscript does not provide sufficient detail on the selection of the 391 inspected candidates, the precise UMAP and FoF hyperparameters used on a per-tile basis, or inter-rater reliability for the visual inspection. These omissions limit the ability of readers to evaluate the representativeness of the inspected sample. In the revised manuscript we will add a new subsection (or expand the existing Methods/Results section) that explicitly describes the sampling procedure used to choose the 391 spectra, the hyperparameter values (or ranges) applied tile-by-tile, and any steps taken to assess consistency in the visual classifications. This addition will directly address the concern and support the generalization to the full outlier catalog. revision: yes
Circularity Check
No circularity: unsupervised data-driven method with independent validation
full rationale
The derivation applies standard UMAP dimensionality reduction and Friends-of-Friends clustering independently per tile to raw spectra, with no labeled data, no parameter fitting to target quality flags, and no self-referential definitions. The 66.8% anomaly rate comes from separate visual inspection of a sample, not from any equation or prior result that reduces to the method's own outputs. No self-citations, uniqueness theorems, or ansatzes are invoked as load-bearing steps. The pipeline is self-contained against external benchmarks and does not rename known results or smuggle assumptions via citation.
Axiom & Free-Parameter Ledger
Reference graph
Works this paper leans on
-
[1]
2025, Journal of Cosmology and Astroparticle Physics, 2025, 028, doi: 10.1088/1475-7516/2025/07/028
Adame, A., Aguilar, J., Ahlen, S., et al. 2025, Journal of Cosmology and Astroparticle Physics, 2025, 028, doi: 10.1088/1475-7516/2025/07/028
-
[2]
, year=2024, month=aug, volume=
Adame, A. G., Aguilar, J., Ahlen, S., et al. 2024, The Astronomical Journal, 168, 58, doi: 10.3847/1538-3881/ad3217 16
-
[3]
Alexander, D. M., Davis, T. M., Chaussidon, E., et al. 2023, The Astronomical Journal, 165, 124, doi: 10.3847/1538-3881/acacfc
-
[4]
2024, arXiv e-prints, arXiv:2405.12518, doi: 10.48550/arXiv.2405.12518
Bacon, R., Maineiri, V., Randich, S., et al. 2024, arXiv e-prints, arXiv:2405.12518, doi: 10.48550/arXiv.2405.12518
-
[5]
2016, Monthly Notices of the Royal Astronomical Society, 465, 4530–4555, doi: 10.1093/mnras/stw3021
Baron, D., & Poznanski, D. 2016, Monthly Notices of the Royal Astronomical Society, 465, 4530–4555, doi: 10.1093/mnras/stw3021
-
[6]
2025, Journal of Cosmology and Astroparticle Physics, 2025, 130, doi: 10.1088/1475-7516/2025/01/130
Bault, A., Kirkby, D., Guy, J., et al. 2025, Journal of Cosmology and Astroparticle Physics, 2025, 130, doi: 10.1088/1475-7516/2025/01/130
-
[7]
2025, arXiv e-prints, arXiv:2503.07923, doi: 10.48550/arXiv.2503.07923
Besuner, R., Dey, A., Drlica-Wagner, A., et al. 2025, arXiv e-prints, arXiv:2503.07923, doi: 10.48550/arXiv.2503.07923
-
[8]
Breunig, Hans-Peter Kriegel, Raymond T
Breunig, M. M., Kriegel, H.-P., Ng, R. T., & Sander, J. 2000a, SIGMOD Rec., 29, 93–104, doi: 10.1145/335191.335388
-
[9]
M., Kriegel, H.-P., Ng, R
Breunig, M. M., Kriegel, H.-P., Ng, R. T., & Sander, J. 2000b, in Proceedings of the 2000 ACM SIGMOD International Conference on Management of Data, SIGMOD ’00 (New York,
2000
-
[10]
NY, USA: Association for Computing Machinery), 93–104, doi: 10.1145/342009.335388
-
[11]
2023, The Astronomical Journal, 166, 66, doi: 10.3847/1538-3881/ace35d
Brodzeller, A., Dawson, K., Bailey, S., et al. 2023, The Astronomical Journal, 166, 66, doi: 10.3847/1538-3881/ace35d
-
[12]
2023, The Astrophysical Journal, 944, 107, doi: 10.3847/1538-4357/acb3c2
Chaussidon, E., Yèche, C., Palanque-Delabrouille, N., et al. 2023, The Astrophysical Journal, 944, 107, doi: 10.3847/1538-4357/acb3c2
-
[13]
2020, The Messenger, 180, 10
Cirasuolo, M., et al. 2020, The Messenger, 180, 10
2020
-
[14]
Clopper, C. J., & Pearson, E. S. 1934, Biometrika, 26, 404, doi: 10.1093/biomet/26.4.404
-
[15]
2016, The DESI Experiment Part II: Instrument Design
Collaboration, D., Aghamousa, A., Aguilar, J., et al. 2016, The DESI Experiment Part II: Instrument Design. https://arxiv.org/abs/1611.00037
Pith/arXiv arXiv 2016
-
[16]
L., Bandi, B., Philipsborn, S., et al
Cook, T. L., Bandi, B., Philipsborn, S., et al. 2024, Monthly Notices of the Royal Astronomical Society, 535, 2129–2148, doi: 10.1093/mnras/stae2389
-
[17]
Cooper, A. P., Koposov, S. E., Allende Prieto, C., et al. 2023, The Astrophysical Journal, 947, 37, doi: 10.3847/1538-4357/acb3c0
-
[18]
DESI DR2 Results II: Measurements of Baryon Acoustic Oscillations and Cosmological Constraints
Dalton, G., et al. 2024, Monthly Notices of the Royal Astronomical Society, 530, 2688 de Jong, R. S., Agertz, O., Berbel, A. A., et al. 2019, The Messenger, 175, 3 DESI Collaboration. 2025a, Phys. Rev. D, 112, 083515. https://arxiv.org/abs/2503.14738 —. 2025b, Phys. Rev. D, 112, 083514. https://arxiv.org/abs/2503.14739 DESI Collaboration, Adame, A. G., Ag...
work page internal anchor Pith review Pith/arXiv arXiv doi:10.1088/1475-7516/2025/07/017 2024
-
[19]
Dey, A., Schlegel, D. J., Lang, D., et al. 2019, The Astronomical Journal, 157, 168, doi: 10.3847/1538-3881/ab089d
-
[20]
Guy, J., Bailey, S., Kremin, A., et al. 2023, The Astronomical Journal, 165, 144, doi: 10.3847/1538-3881/acb212
-
[21]
Hahn, C., Wilson, M. J., Ruiz-Macias, O., et al. 2023, The Astronomical Journal, 165, 253, doi: 10.3847/1538-3881/accff8
-
[22]
Huchra, J. P., & Geller, M. J. 1982, Astrophysical Journal, 257, 423, doi: 10.1086/160000
-
[23]
Juneau, S., Canning, R., Alexander, D. M., et al. 2025, The Astronomical Journal, 169, 157, doi: 10.3847/1538-3881/adab0d
-
[24]
SDSS-V: Pioneering Panoptic Spectroscopy
Kollmeier, J. A., Zasowski, G., Rix, H.-W., et al. 2017, arXiv e-prints, arXiv:1711.03234, doi: 10.48550/arXiv.1711.03234
work page internal anchor Pith review Pith/arXiv arXiv doi:10.48550/arxiv.1711.03234 2017
-
[25]
Krolewski, A., Yu, J., Ross, A. J., et al. 2025, J. Cosmology Astropart. Phys., 2025, 147, doi: 10.1088/1475-7516/2025/01/147
-
[26]
2023, The Astrophysical Journal, 943, 68, doi: 10.3847/1538-4357/aca5fa
Lan, T.-W., Tojeiro, R., Armengaud, E., et al. 2023, The Astrophysical Journal, 943, 68, doi: 10.3847/1538-4357/aca5fa
-
[27]
The DESI Experiment, a whitepaper for Snowmass 2013
Levi, M., Bebek, C., Beers, T., et al. 2013, arXiv e-prints, arXiv:1308.0847, doi: 10.48550/arXiv.1308.0847
work page internal anchor Pith review Pith/arXiv arXiv doi:10.48550/arxiv.1308.0847 2013
-
[28]
2023, ApJ, 956, L6, doi: 10.3847/2041-8213/acfa03
Liang, Y., Melchior, P., Hahn, C., et al. 2023, ApJ, 956, L6, doi: 10.3847/2041-8213/acfa03
-
[29]
Liu, F. T., Ting, K. M., & Zhou, Z.-H. 2008, in 2008 Eighth IEEE International Conference on Data Mining, 413–422, doi: 10.1109/ICDM.2008.17
-
[30]
McGurk, R. C., Kimball, A. E., & Ivezić, Ž. 2010, The Astronomical Journal, 139, 1261, doi: 10.1088/0004-6256/139/3/1261
-
[31]
2020, UMAP: Uniform Manifold Approximation and Projection for Dimension Reduction
McInnes, L., Healy, J., & Melville, J. 2020, UMAP: Uniform Manifold Approximation and Projection for Dimension Reduction. https://arxiv.org/abs/1802.03426
Pith/arXiv arXiv 2020
-
[32]
N., Doel, P., Gutierrez, G., et al
Miller, T. N., Doel, P., Gutierrez, G., et al. 2023, The Optical Corrector for the Dark Energy Spectroscopic Instrument. https://arxiv.org/abs/2306.06310
arXiv 2023
-
[33]
Moustakas, J., Lang, D., Dey, A., et al. 2023, The Astrophysical Journal Supplement Series, 269, 3, doi: 10.3847/1538-4365/acfaa2
-
[34]
2022, Monthly Notices of the Royal Astronomical Society, 517, 393–419, doi: 10.1093/mnras/stac2582
Narayan, G. 2022, Monthly Notices of the Royal Astronomical Society, 517, 393–419, doi: 10.1093/mnras/stac2582
-
[35]
D., Moustakas, J., Bailey, S., et al
Myers, A. D., Moustakas, J., Bailey, S., et al. 2023, The Astronomical Journal, 165, 50, doi: 10.3847/1538-3881/aca5f9
-
[36]
Nicolaou, C., Nathan, R. P., Lahav, O., et al. 2026, Monthly Notices of the Royal Astronomical Society, 547, stag010, doi: 10.1093/mnras/stag010
-
[37]
2014, The Astrophysical Journal, 793, 23, doi: 10.1088/0004-637x/793/1/23
Nun, I., Pichara, K., Protopapas, P., & Kim, D.-W. 2014, The Astrophysical Journal, 793, 23, doi: 10.1088/0004-637x/793/1/23
-
[38]
2025, Astronomy & Astrophysics, 703, A242, doi: 10.1051/0004-6361/202556339
Ortiz, E., & Boquien, M. 2025, Astronomy & Astrophysics, 703, A242, doi: 10.1051/0004-6361/202556339
-
[39]
2024, AJ, 168, 245, doi: 10.3847/1538-3881/ad76a4
Poppett, C., Tyas, L., Aguilar, J., et al. 2024, The Astronomical Journal, 168, 245, doi: 10.3847/1538-3881/ad76a4
-
[40]
Portillo, S. K. N., Parejko, J. K., Vergara, J. R., & Connolly, A. J. 2020, The Astronomical Journal, 160, 45, doi: 10.3847/1538-3881/ab9644
-
[41]
Raichoor, A., Eisenstein, D. J., Karim, T., et al. 2020, Research Notes of the AAS, 4, 180, doi: 10.3847/2515-5172/abc078
-
[42]
Raichoor, A., Moustakas, J., Newman, J. A., et al. 2023, The Astronomical Journal, 165, 126, doi: 10.3847/1538-3881/acb213
-
[43]
Rosito, M. S., Bignone, L. A., Tissera, P. B., & Pedrosa, S. E. 2023, Astronomy & Astrophysics, 671, A19, doi: 10.1051/0004-6361/202244707
-
[44]
J., Beutler, F., Chuang, C.-H., et al
Ross, A. J., Beutler, F., Chuang, C.-H., et al. 2016, Monthly Notices of the Royal Astronomical Society, 464, 1168–1191, doi: 10.1093/mnras/stw2372
-
[45]
J., Aguilar, J., Ahlen, S., et al
Ross, A. J., Aguilar, J., Ahlen, S., et al. 2025, Journal of Cosmology and Astroparticle Physics, 2025, 020, doi: 10.1088/1475-7516/2025/01/020
-
[46]
2021, Monthly Notices of the Royal Astronomical Society, 502, 4328, doi: 10.1093/mnras/stab292
Ruiz-Macias, O., Zarrouk, P., Cole, S., et al. 2021, Monthly Notices of the Royal Astronomical Society, 502, 4328, doi: 10.1093/mnras/stab292
-
[47]
Schlafly, E. F., Kirkby, D., Schlegel, D. J., et al. 2023, AJ, 166, 259, doi: 10.3847/1538-3881/ad0832
-
[48]
2023, Monthly Notices of the Royal Astronomical Society, 526, 585, doi: 10.1093/mnras/stad2668
Sharbaf, Z., Ferreras, I., & Lahav, O. 2023, Monthly Notices of the Royal Astronomical Society, 526, 585, doi: 10.1093/mnras/stad2668
-
[49]
Silber, J. H., Fagrelius, P., Fanning, K., et al. 2022, The Astronomical Journal, 165, 9, doi: 10.3847/1538-3881/ac9ab1 Suárez-Pérez, J. F., & Forero-Romero, J. 2025, in IAU
-
[50]
Symposium, Vol. 19, IAU Symposium, ed. J. McIver, A. Mahabal, & C. Fluke, 91–94, doi: 10.1017/S1743921322003568 Suárez Pérez, J. F. 2023, PhD thesis, Universidad de los Andes. https://hdl.handle.net/1992/68996 Sánchez-Sáez, P., Lira, H., Martí, L., et al. 2021, The Astronomical Journal, 162, 206, doi: 10.3847/1538-3881/ac1426
-
[51]
2016, Proceedings of the SPIE, 9908, 99081A van der Maaten, L., & Hinton, G
Takada, M., et al. 2016, Proceedings of the SPIE, 9908, 99081A van der Maaten, L., & Hinton, G. 2008, Journal of Machine Learning Research, 9, 2579
2016
-
[52]
J., Scargle, J
Way, M. J., Scargle, J. D., Ali, K., & Srivastava, A. N. 2012, Advances in Machine Learning and Data Mining for
2012
-
[53]
Yip, C. W., Connolly, A. J., Szalay, A. S., et al. 2004a, The Astronomical Journal, 128, 585–609, doi: 10.1086/422429
-
[54]
Yip, C. W., Connolly, A. J., Vanden Berk, D. E., et al. 2004b, The Astronomical Journal, 128, 2603–2630, doi: 10.1086/425626
-
[55]
Zhao, C., Huang, S., He, M., et al. 2024, arXiv e-prints, arXiv:2411.07970, doi: 10.48550/arXiv.2411.07970
work page internal anchor Pith review Pith/arXiv arXiv doi:10.48550/arxiv.2411.07970 2024
-
[56]
Zhou, R., Dey, B., Newman, J. A., et al. 2023, The Astronomical Journal, 165, 58, doi: 10.3847/1538-3881/aca5fb
-
[57]
Zou, H., Zhou, X., Fan, X., et al. 2017, Publications of the Astronomical Society of the Pacific, 129, 064101, doi: 10.1088/1538-3873/aa65ba This paper was built using the Open Journal of As- trophysics LATEX template. The OJA is a journal which provides fast and easy peer review for new papers in the astro-phsectionofthearXiv, makingthereviewingpro- cess...
discussion (0)
Sign in with ORCID, Apple, or X to comment. Anyone can read and Pith papers without signing in.