Deep Neural Networks with Ordinal Loss for Medical Applications
Pith reviewed 2026-06-25 20:25 UTC · model grok-4.3
The pith
Ordinal Cross-Entropy extends standard cross-entropy with a cost matrix to respect ordering and asymmetric error costs in medical predictions.
A machine-rendered reading of the paper's core claim, the machinery that carries it, and where it could break.
Core claim
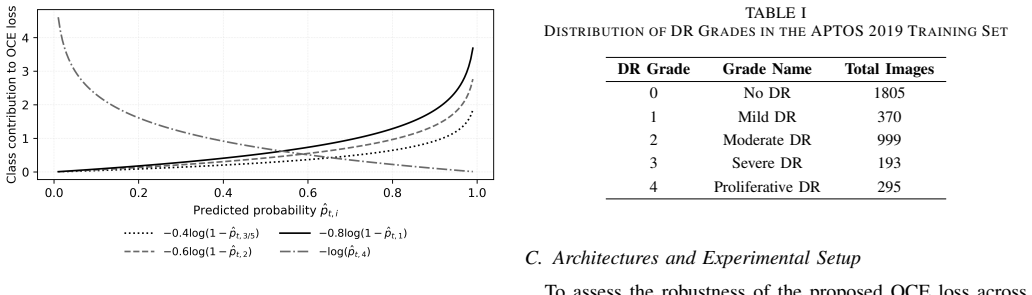
The Ordinal Cross-Entropy (OCE) framework modifies the standard cross-entropy loss by incorporating an ordinal cost matrix that assigns higher penalties to misclassifications between distant ordinal categories; the resulting loss preserves a probabilistic interpretation, admits a closed-form gradient with improved ordinal consistency, and yields lower cumulative prediction costs together with improved calibration when used to train deep networks on ordinal medical data.
What carries the argument
Ordinal Cross-Entropy (OCE) loss, which re-weights each term of the usual cross-entropy by an entry from a user-supplied ordinal cost matrix that encodes clinical misclassification severity.
If this is right
- Deep networks trained with OCE produce predictions whose total cost, measured by the same ordinal matrix, is lower than that of networks trained with ordinary cross-entropy.
- The same networks exhibit improved probability calibration relative to existing ordinal regression techniques.
- The OCE gradient yields smoother optimization trajectories that maintain ordinal consistency throughout training.
- Because the method only changes the loss function, it applies to any deep architecture already used for classification.
Where Pith is reading between the lines
- The approach could be tested on non-medical ordinal problems such as age estimation or product rating prediction to check whether the same cost-matrix formulation transfers.
- If the cost matrix must be set by domain experts, an interesting next step would be to learn a small number of matrix parameters jointly with the network weights.
- Because the method keeps the probabilistic output layer intact, it remains straightforward to combine OCE with existing calibration or uncertainty techniques.
Load-bearing premise
A suitable ordinal cost matrix can be chosen in advance that correctly captures the asymmetric clinical consequences of different errors without later tuning that would change the reported performance gains.
What would settle it
On the same benchmark datasets, training with the proposed loss and a fixed cost matrix produces higher total error cost or worse calibration than standard cross-entropy or prior ordinal losses.
Figures


read the original abstract
In many prediction problems in medical applications, target labels exhibit an inherent ordinal structure, where class ordering reflects clinically meaningful severity levels. The cost associated with misclassification is often non-uniform and asymmetric, as errors between distant ordinal categories may have substantially more severe consequences than errors between adjacent ones, and overestimating disease severity may have different clinical implications than underestimating it. Traditional loss functions such as multi-class cross-entropy treat all misclassifications equally and fail to incorporate this ordering information. Recent advances in ordinal regression aim to address this limitation by integrating rank-based structures into deep learning models. In this work, we introduce the \textbf{Ordinal Cross-Entropy (OCE)} framework, a general and architecture-independent approach for learning from ordinal data. The proposed method extends the standard cross-entropy formulation to account for misclassification severity through an ordinal cost matrix while preserving the probabilistic interpretation and optimization benefits of the conventional loss. We provide a theoretical analysis of the OCE gradient behavior and show that it yields smoother optimization dynamics and improved ordinal consistency. Experiments on benchmark datasets show that our method achieves lower prediction error costs and better calibration compared to existing state-of-the-art ordinal approaches, establishing OCE as a simple yet effective solution for ordinal regression in deep neural networks.
Editorial analysis
A structured set of objections, weighed in public.
Referee Report
Summary. The manuscript introduces Ordinal Cross-Entropy (OCE), a modification of standard multi-class cross-entropy that multiplies per-class log-probabilities by entries from a user-specified ordinal cost matrix C to penalize misclassifications according to their ordinal distance and asymmetry. The authors claim this yields smoother optimization dynamics via a theoretical gradient analysis while preserving probabilistic interpretation, and report experimental results on benchmark datasets showing lower prediction error costs and better calibration than prior ordinal regression methods for deep networks in medical applications.
Significance. If the gradient analysis is rigorous and the reported gains can be isolated from the choice of C, OCE would provide a lightweight, architecture-agnostic way to encode clinically asymmetric costs into DNN training. The approach builds directly on cross-entropy without new parameters or architectural changes, which could be practically useful if the cost matrix can be fixed in advance.
major comments (2)
- [Abstract] Abstract: the central claim of a 'theoretical analysis of the OCE gradient behavior' is asserted without any equations, derivation, or even the explicit form of the OCE loss; this prevents evaluation of the stated 'smoother optimization dynamics and improved ordinal consistency.'
- [Abstract] Abstract (and throughout): no description is given of how the ordinal cost matrix C is constructed for each dataset or experiment (fixed |i-j| distances, clinically elicited values, or optimized on validation data). Because the empirical claim of lower weighted error and better calibration rests on this matrix, the absence of this information makes it impossible to determine whether gains are due to OCE or to post-hoc cost encoding, directly undermining the weakest assumption identified in the stress test.
minor comments (1)
- [Abstract] Abstract: the phrase 'prediction error costs' is used without defining the precise metric (e.g., mean absolute error on the ordinal scale, expected cost under C, or another quantity).
Simulated Author's Rebuttal
We thank the referee for the constructive comments. We address the two major points below and will make the requested revisions to improve clarity and reproducibility.
read point-by-point responses
-
Referee: [Abstract] Abstract: the central claim of a 'theoretical analysis of the OCE gradient behavior' is asserted without any equations, derivation, or even the explicit form of the OCE loss; this prevents evaluation of the stated 'smoother optimization dynamics and improved ordinal consistency.'
Authors: We agree that the abstract should contain the explicit form of the OCE loss to allow immediate evaluation of the central claim. The full gradient analysis and derivations appear in Section 3, but the abstract will be revised to include the OCE loss equation and a one-sentence summary of the key gradient properties (smoother dynamics and ordinal consistency). revision: yes
-
Referee: [Abstract] Abstract (and throughout): no description is given of how the ordinal cost matrix C is constructed for each dataset or experiment (fixed |i-j| distances, clinically elicited values, or optimized on validation data). Because the empirical claim of lower weighted error and better calibration rests on this matrix, the absence of this information makes it impossible to determine whether gains are due to OCE or to post-hoc cost encoding, directly undermining the weakest assumption identified in the stress test.
Authors: We agree that the construction of C must be stated explicitly. In the revised manuscript we will add a new subsection (Section 4.2) that specifies, for every dataset, whether C uses fixed |i-j| distances, clinically elicited values, or any validation-based tuning, together with the exact numerical matrices employed. This will make clear that performance differences arise from the OCE formulation rather than from undisclosed post-hoc encoding. revision: yes
Circularity Check
No circularity: OCE is a direct non-tautological extension of cross-entropy
full rationale
The paper defines OCE as a straightforward modification of standard cross-entropy that incorporates a user-specified ordinal cost matrix C while preserving probabilistic interpretation. No equations are shown to reduce to their own inputs by construction, no fitted parameters are relabeled as predictions, and no load-bearing self-citations or uniqueness theorems are invoked. The gradient analysis and benchmark comparisons rest on independent evaluation rather than self-referential definitions or ansatzes smuggled via prior work. This is the normal case of a self-contained empirical proposal with no detectable circular steps.
Axiom & Free-Parameter Ledger
Reference graph
Works this paper leans on
-
[1]
Deep residual learning for image recognition,
K. He, X. Zhang, S. Ren, and J. Sun, “Deep residual learning for image recognition,” inProceedings of the IEEE conference on computer vision and pattern recognition, 2016, pp. 770–778
2016
-
[2]
DeepLung: 3D Deep Convolutional Nets for Automated Pulmonary Nodule Detection and Classification
W. Zhu, C. Liu, W. Fan, and X. Xie, “Deeplung: 3d deep convolutional nets for automated pulmonary nodule detection and classification,”arXiv preprint arXiv:1709.05538, 2017
work page internal anchor Pith review Pith/arXiv arXiv 2017
-
[3]
Deep learning in medical image analysis,
D. Shen, G. Wu, and H.-I. Suk, “Deep learning in medical image analysis,”Annual review of biomedical engineering, vol. 19, no. 1, pp. 221–248, 2017
2017
-
[4]
Literature review: Efficient deep neural networks tech- niques for medical image analysis,
M. A. Abdou, “Literature review: Efficient deep neural networks tech- niques for medical image analysis,”Neural Computing and Applications, vol. 34, no. 8, pp. 5791–5812, 2022
2022
-
[5]
A review of convolutional neural network based methods for medical image classification,
C. Chen, N. A. M. Isa, and X. Liu, “A review of convolutional neural network based methods for medical image classification,”Computers in biology and medicine, vol. 185, p. 109507, 2025
2025
-
[6]
Automatic age estimation based on facial aging patterns,
X. Geng, Z.-H. Zhou, and K. Smith-Miles, “Automatic age estimation based on facial aging patterns,”IEEE Transactions on pattern analysis and machine intelligence, vol. 29, no. 12, pp. 2234–2240, 2007
2007
-
[7]
Making better mistakes: Leveraging class hierarchies with deep networks,
L. Bertinetto, R. Mueller, K. Tertikas, S. Samangooei, and N. A. Lord, “Making better mistakes: Leveraging class hierarchies with deep networks,” inProceedings of the IEEE/CVF conference on computer vision and pattern recognition, 2020, pp. 12 506–12 515
2020
-
[8]
Development and validation of a deep learning algorithm for detection of diabetic retinopathy in retinal fundus photographs,
V . Gulshan, L. Peng, M. Coram, M. C. Stumpe, D. Wu, A. Narayanaswamy, S. Venugopalan, K. Widner, T. Madams, J. Cuadros et al., “Development and validation of a deep learning algorithm for detection of diabetic retinopathy in retinal fundus photographs,”jama, vol. 316, no. 22, pp. 2402–2410, 2016
2016
-
[9]
Automated grading of prostate cancer using convolutional neural network and ordinal class classifier,
B. Abraham and M. S. Nair, “Automated grading of prostate cancer using convolutional neural network and ordinal class classifier,”Informatics in Medicine Unlocked, vol. 17, p. 100256, 2019
2019
-
[10]
Deep learning to improve breast cancer detection on screening mammography,
L. Shen, L. R. Margolies, J. H. Rothstein, E. Fluder, R. McBride, and W. Sieh, “Deep learning to improve breast cancer detection on screening mammography,”Scientific reports, vol. 9, no. 1, p. 12495, 2019
2019
-
[11]
An ordinal cnn approach for the assessment of neurological damage in parkinson’s disease patients,
J. Barbero-G ´omez, P.-A. Guti ´errez, V .-M. Vargas, J.-A. Vallejo-Casas, and C. Herv ´as-Mart´ınez, “An ordinal cnn approach for the assessment of neurological damage in parkinson’s disease patients,”Expert Systems with Applications, vol. 182, p. 115271, 2021
2021
-
[12]
Rank consistent ordinal regres- sion for neural networks with application to age estimation,
W. Cao, V . Mirjalili, and S. Raschka, “Rank consistent ordinal regres- sion for neural networks with application to age estimation,”Pattern Recognition Letters, vol. 140, pp. 325–331, 2020
2020
-
[13]
Deep neural networks for rank- consistent ordinal regression based on conditional probabilities,
X. Shi, W. Cao, and S. Raschka, “Deep neural networks for rank- consistent ordinal regression based on conditional probabilities,”Pattern Analysis and Applications, vol. 26, no. 3, pp. 941–955, 2023
2023
-
[14]
Unimodal probability distributions for deep or- dinal classification,
C. Beckham and C. Pal, “Unimodal probability distributions for deep or- dinal classification,” inInternational Conference on Machine Learning. PMLR, 2017, pp. 411–419
2017
-
[15]
Unimodal regularized neuron stick-breaking for ordinal classification,
X. Liu, F. Fan, L. Kong, Z. Diao, W. Xie, J. Lu, and J. You, “Unimodal regularized neuron stick-breaking for ordinal classification,”Neurocom- puting, vol. 388, pp. 34–44, 2020
2020
-
[16]
The unimodal model for the classification of ordinal data,
J. F. P. da Costa, H. Alonso, and J. S. Cardoso, “The unimodal model for the classification of ordinal data,”Neural Networks, vol. 21, no. 1, pp. 78–91, 2008
2008
-
[17]
Unimodal regularisation based on beta distribution for deep ordinal regression,
V . M. Vargas, P. A. Guti ´errez, and C. Herv ´as-Mart´ınez, “Unimodal regularisation based on beta distribution for deep ordinal regression,” Pattern Recognition, vol. 122, p. 108310, 2022
2022
-
[18]
An introduction to categorical data analysis,
D. Sloane and S. P. Morgan, “An introduction to categorical data analysis,”Annual review of sociology, vol. 22, no. 1, pp. 351–375, 1996
1996
-
[19]
Disease-grading networks with ordinal regularization for medical imaging,
W. Tang, Z. Yang, and Y . Song, “Disease-grading networks with ordinal regularization for medical imaging,”Neurocomputing, vol. 545, p. 126245, 2023
2023
-
[20]
Disease-grading networks with asymmetric gaus- sian distribution for medical imaging,
W. Tang and Z. Yang, “Disease-grading networks with asymmetric gaus- sian distribution for medical imaging,”IEEE Transactions on Medical Imaging, 2025
2025
-
[21]
Learning from imbalanced data sets with weighted cross-entropy func- tion,
Y . S. Aurelio, G. M. De Almeida, C. L. de Castro, and A. P. Braga, “Learning from imbalanced data sets with weighted cross-entropy func- tion,”Neural processing letters, vol. 50, no. 2, pp. 1937–1949, 2019
1937
-
[22]
Fully automatic brain tumor segmentation with deep learning-based selective attention using over- lapping patches and multi-class weighted cross-entropy,
M. Akil, R. Saouli, R. Kachouriet al., “Fully automatic brain tumor segmentation with deep learning-based selective attention using over- lapping patches and multi-class weighted cross-entropy,”Medical image analysis, vol. 63, p. 101692, 2020
2020
-
[23]
Fully automatic knee osteoarthritis severity grading using deep neural networks with a novel ordinal loss,
P. Chen, L. Gao, X. Shi, K. Allen, and L. Yang, “Fully automatic knee osteoarthritis severity grading using deep neural networks with a novel ordinal loss,”Computerized Medical Imaging and Graphics, vol. 75, pp. 84–92, 2019
2019
-
[24]
Impact and therapy of osteoarthritis: the arthritis care oa nation 2012 survey,
P. G. Conaghan, M. Porcheret, S. R. Kingsbury, A. Gammon, A. Soni, M. Hurley, M. P. Rayman, J. Barlow, R. G. Hull, J. Cumminget al., “Impact and therapy of osteoarthritis: the arthritis care oa nation 2012 survey,”Clinical rheumatology, vol. 34, no. 9, pp. 1581–1588, 2015
2012
-
[25]
The epidemiology and impact of pain in osteoarthritis,
T. Neogi, “The epidemiology and impact of pain in osteoarthritis,” Osteoarthritis and cartilage, vol. 21, no. 9, pp. 1145–1153, 2013
2013
-
[26]
An aging nation: The older population in the united states,
J. M. Ortman, V . A. Velkoff, and H. Hogan, “An aging nation: The older population in the united states,” U.S. Census Bureau, Economics and Statistics Administration, U.S. Department of Commerce, Washington, DC, USA, Current Population Reports P25-1140, 2014
2014
-
[27]
The value of deep learning-based x-ray techniques in detecting and classifying kl grades of knee osteoarthritis: a systematic review and meta-analysis,
H. Zhao, L. Ou, Z. Zhang, L. Zhang, K. Liu, and J. Kuang, “The value of deep learning-based x-ray techniques in detecting and classifying kl grades of knee osteoarthritis: a systematic review and meta-analysis,” European Radiology, vol. 35, no. 1, pp. 327–340, 2025
2025
-
[28]
The foundations of cost-sensitive learning,
C. Elkan, “The foundations of cost-sensitive learning,” inInternational joint conference on artificial intelligence, vol. 17, no. 1. Lawrence Erlbaum Associates Ltd, 2001, pp. 973–978
2001
-
[29]
Weighted kappa loss function for multi-class classification of ordinal data in deep learning,
J. de La Torre, D. Puig, and A. Valls, “Weighted kappa loss function for multi-class classification of ordinal data in deep learning,”Pattern Recognition Letters, vol. 105, pp. 144–154, 2018. APPENDIX DERIVATION OF THEOCE GRADIENT In this appendix, we provide the detailed derivation of the gradient expression given in Equation (4). OCE k =− cmk,mk zk,...
2018
discussion (0)
Sign in with ORCID, Apple, or X to comment. Anyone can read and Pith papers without signing in.