Direct numerical simulations of turbulent drag reduction via piezoelectric actuation
Pith reviewed 2026-07-03 04:40 UTC · model grok-4.3
The pith
Piezoelectric surface deformations reduce turbulent drag by up to 27 percent via spanwise waves.
A machine-rendered reading of the paper's core claim, the machinery that carries it, and where it could break.
Core claim
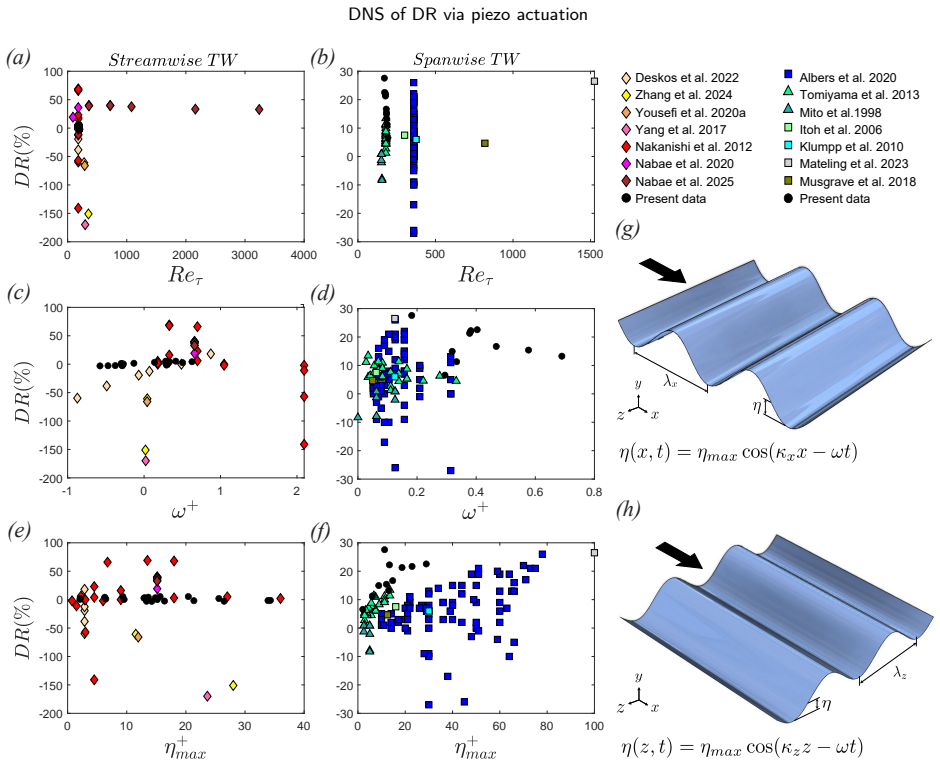
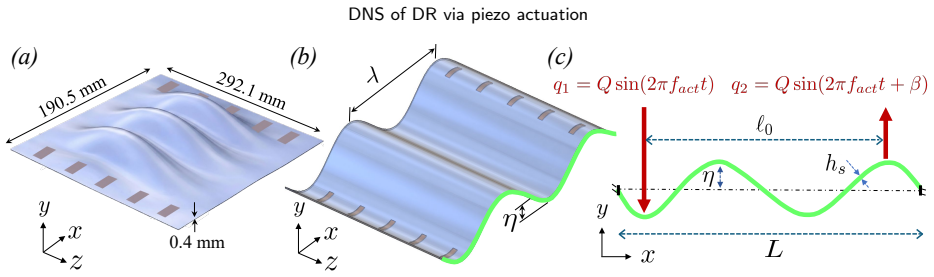
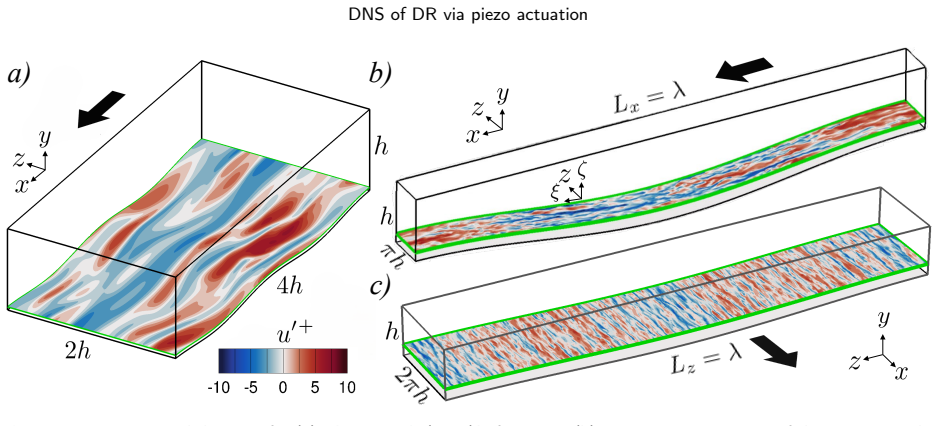
Surface deformations generated by piezoelectric actuators beneath an aluminum sheet produce spanwise hybrid waves that introduce transverse shear and high-low streamwise-momentum zones, thereby disrupting the near-wall turbulence-regeneration cycle and yielding up to 27 percent net drag reduction at Re_tau = 200.
What carries the argument
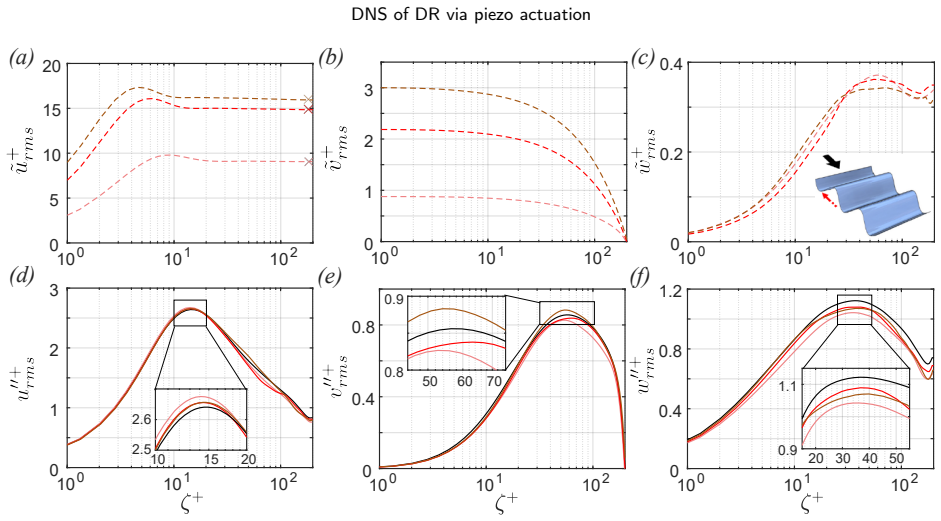
The spanwise hybrid wave, which imposes transverse shear on the near-wall flow and creates alternating high- and low-momentum streaks that attenuate the turbulence regeneration cycle.
If this is right
- Streamwise waves produce only marginal net drag change because local drag increases and decreases from alternating pressure gradients largely cancel.
- Spanwise waves achieve the largest reductions (up to 27.6 percent) by generating transverse shear that breaks the near-wall turbulence cycle.
- The hybrid spanwise wave from a realistic actuator geometry already reaches 27 percent reduction, showing that unconventional surface shapes can be effective.
- Drag reduction occurs across the tested actuation frequencies and voltages without requiring idealized sinusoidal walls.
Where Pith is reading between the lines
- If two-way fluid-structure coupling were added, the actuator deformation amplitude and phase might shift enough to change the reported reduction percentages.
- The same actuator geometry could be tested at higher Reynolds numbers to check whether the spanwise-wave mechanism scales to practical engineering flows.
- Combining the spanwise hybrid wave with other near-wall control techniques might produce additive reductions beyond the 27 percent shown here.
Load-bearing premise
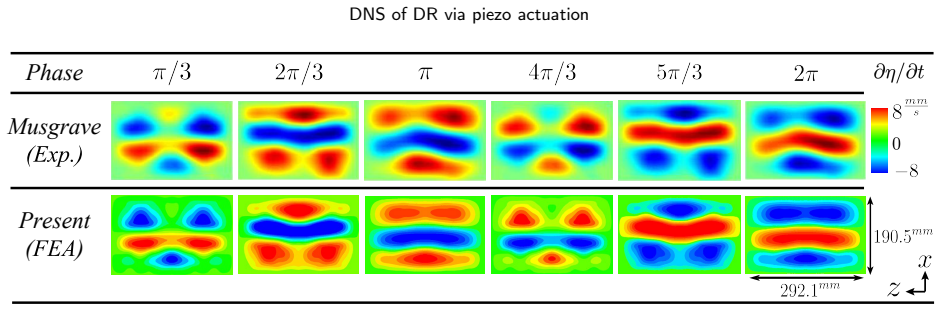
The surface shapes computed from finite-element analysis of the actuator can be imposed directly as time-dependent wall boundary conditions without two-way fluid-structure interaction or extra modeling error.
What would settle it
A simulation or experiment that includes two-way coupling between the deforming surface and the flow and then measures whether the spanwise-wave drag reduction stays above 20 percent.
Figures


read the original abstract
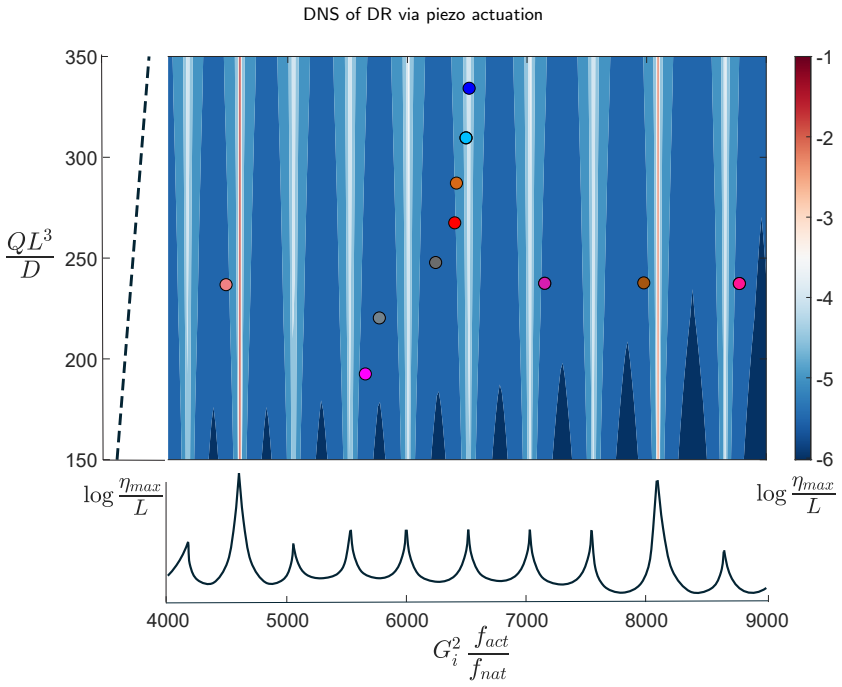
We have conducted Direct Numerical Simulations of turbulent half-channel flow over realistic surface deformations at friction Reynolds number $Re_\tau=200$. We generated the surface deformations using piezoelectric actuators. We simulated the piezoelectric actuation over the practical actuation frequency range $(119Hz\le f_\mathrm{act}\le543Hz)$ and voltage range $(250V\le Q \le500V)$ beneath an Aluminum sheet using Finite Element Analysis. The sheet deformation amplitude and actuation frequency in viscous units vary within the range $2 \le \eta^+_\mathrm{max} \le 34$, and $-0.58 \le \omega^+ \le 0.70$. The vertical surface deformations from our actuation setup generate three types of waves: travelling, hybrid, and standing waves. Surface deformations are applied as bottom-wall boundary conditions of the turbulent channel flow to generate waves in the upstream, downstream, and spanwise directions. We achieved maximum drag reductions of 1.6\%, 5.4\%, and 27.6\% for upstream, downstream, and spanwise waves, respectively. The streamwise waves generate alternating adverse and favorable pressure gradients, which locally increase and decrease drag, leading to a marginal net change in drag. In contrast, spanwise waves introduce transverse shear, accompanied by high- and low-streamwise-momentum zones that respectively attenuate and energize the near-wall turbulence. Such disruption of the near-wall turbulence-regeneration cycle produces up to $27\%$ drag reduction for the realistic spanwise hybrid wave; such an outcome demonstrates the efficacy of unconventional realistic surface deformations in achieving significant drag reduction.
Editorial analysis
A structured set of objections, weighed in public.
Referee Report
Summary. The manuscript reports direct numerical simulations of turbulent half-channel flow at Re_τ=200 over surface deformations obtained from finite-element analysis of piezoelectric actuators. These deformations are imposed as time-dependent Dirichlet boundary conditions to generate upstream, downstream, and spanwise (including hybrid) waves with amplitudes 2 ≤ η_max^+ ≤ 34 and frequencies -0.58 ≤ ω^+ ≤ 0.70. The simulations yield maximum drag reductions of 1.6%, 5.4%, and 27.6% for the three wave directions, with the spanwise hybrid wave claimed to disrupt the near-wall turbulence regeneration cycle via transverse shear and momentum zones.
Significance. If the one-way coupling approximation holds, the work provides quantitative evidence that realistic, FEA-derived actuator deformations can produce substantial drag reduction (up to ~27%) at moderate Reynolds number, bridging actuator physics with flow-control outcomes and extending beyond idealized traveling-wave studies.
major comments (2)
- [Abstract] Abstract and methods: Surface deformations are generated via standalone FEA and imposed directly as time-dependent boundary conditions on the DNS without two-way fluid-structure interaction. At Re_τ=200 and η_max^+ up to 34, turbulent pressure fluctuations produce hydrodynamic loads comparable in magnitude to actuator forces; these loads can alter instantaneous amplitude and phase of the waves. Because no estimate or sensitivity study of the back-effect is provided, the reported drag reductions (1.6–27.6%) rest on an unverified kinematic assumption that directly affects the claimed attenuation of the near-wall cycle.
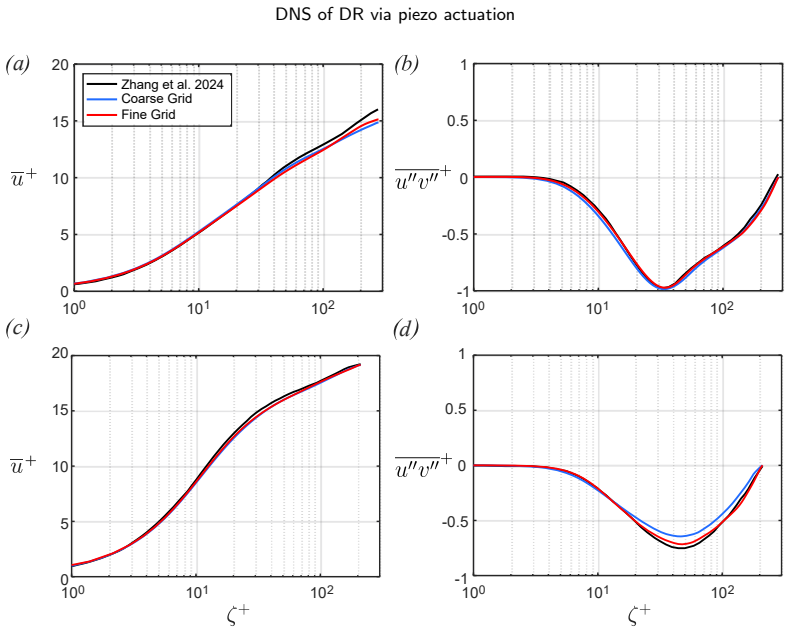
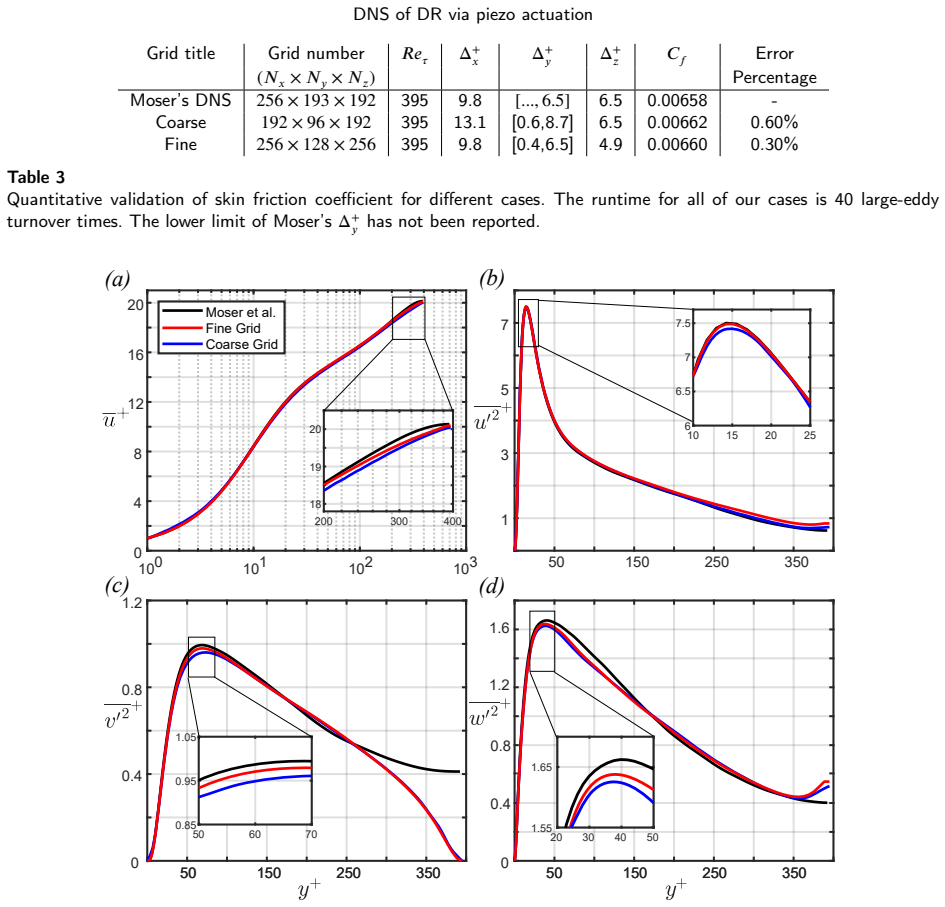
- [Abstract] Abstract: The manuscript states that DNS were performed but supplies no grid-resolution metrics (Δx^+, Δy^+, Δz^+), domain size, or validation against established Re_τ=200 channel-flow statistics (e.g., mean velocity profile, Reynolds stresses). These quantities are load-bearing for any quantitative claim of drag reduction percentages.
minor comments (1)
- [Abstract] The abstract refers to “turbulent half-channel flow” while the title mentions “turbulent drag reduction”; clarify whether the setup is a half-channel or full channel and ensure consistent terminology throughout.
Simulated Author's Rebuttal
We thank the referee for their thorough review and valuable comments. We address the major comments point-by-point below and will revise the manuscript accordingly to improve clarity and completeness.
read point-by-point responses
-
Referee: [Abstract] Abstract and methods: Surface deformations are generated via standalone FEA and imposed directly as time-dependent boundary conditions on the DNS without two-way fluid-structure interaction. At Re_τ=200 and η_max^+ up to 34, turbulent pressure fluctuations produce hydrodynamic loads comparable in magnitude to actuator forces; these loads can alter instantaneous amplitude and phase of the waves. Because no estimate or sensitivity study of the back-effect is provided, the reported drag reductions (1.6–27.6%) rest on an unverified kinematic assumption that directly affects the claimed attenuation of the near-wall cycle.
Authors: We acknowledge the validity of this concern regarding the one-way coupling approximation. Our study focuses on the flow response to prescribed realistic deformations derived from FEA, which is a standard approach to evaluate potential control strategies before full FSI. However, to address the referee's point, in the revised version we will add a discussion estimating the hydrodynamic loads (using the pressure fluctuations from the DNS) compared to the actuator forces from the FEA. This will help quantify the potential back-effect. A complete two-way coupled simulation is beyond the current scope due to computational cost but is noted as future work. We believe this addition will strengthen the manuscript without altering the main conclusions. revision: partial
-
Referee: [Abstract] Abstract: The manuscript states that DNS were performed but supplies no grid-resolution metrics (Δx^+, Δy^+, Δz^+), domain size, or validation against established Re_τ=200 channel-flow statistics (e.g., mean velocity profile, Reynolds stresses). These quantities are load-bearing for any quantitative claim of drag reduction percentages.
Authors: We agree that these details are essential for reproducibility and credibility of the results. The revised manuscript will include a dedicated subsection in the Methods describing the computational domain (streamwise and spanwise extents), grid resolutions in viscous units, and validation of the uncontrolled channel flow against reference DNS data at Re_τ=200, including comparisons of the mean velocity profile and Reynolds stress components. This information was omitted in the initial submission but is available from our simulations. revision: yes
Circularity Check
No circularity: simulation results from independent FEA-to-DNS pipeline
full rationale
The paper performs FEA to obtain surface deformations from piezoelectric actuation, then imposes those deformations as time-dependent Dirichlet boundary conditions in DNS of channel flow at Re_tau=200. Reported drag reductions (1.6%, 5.4%, 27.6%) are direct numerical outcomes against external turbulence statistics benchmarks. No derivation, prediction, or uniqueness claim reduces by construction to fitted parameters or self-citations; the one-way coupling is an explicit modeling choice, not a self-referential loop. No load-bearing self-citations, ansatzes, or renamings appear in the provided text.
Axiom & Free-Parameter Ledger
axioms (2)
- standard math Incompressible Navier-Stokes equations govern the flow at the simulated Reynolds number.
- domain assumption Surface deformations from separate FEA can be imposed directly as time-dependent wall boundary conditions.
Reference graph
Works this paper leans on
-
[1]
A study on steady-state traveling waves in one-dimensional non-dispersive finite media. J. Sound Vib. 528, 116907. Bai,H.,Zhou,Y.,Zhang,W.,Xu,S.,Wang,Y.,Antonia,R.,2014. Activecontrolofaturbulentboundarylayerbasedonlocalsurfaceperturbation. J. Fluid Mech 750, 316–354. Chorin, A.,
2014
-
[2]
Characteristics of drag-reduced turbulent boundary layers with pulsed-direct-current plasma actuation. J. Fluid Mech 915, A113. doi:10.1017/jfm.2021.167. Duong,A.,Midya,S.,Corke,T.,Hussain,F.,Thomas,F.,2019. Turbulentboundarylayerdragreductionusingpulsed-dcplasmaactuation. J.Fluid Mech . Endrikat, S., Modesti, D., Garcia-Mayoral, R., Hutchins, N., Chung, D.,
-
[3]
Dissimilarcontrolofmomentumandheattransferinafullydevelopedturbulentchannelflow
Hasegawa,Y.,Kasagi,N.,2011. Dissimilarcontrolofmomentumandheattransferinafullydevelopedturbulentchannelflow. J.FluidMech.683, 57–93. Hussain, A., Reynolds, W.,
2011
-
[4]
The largest scales of turbulent wall flows. J. Fluid Mech. 842, P1. doi:10.1017/jfm.2018.144. Jiménez, J., Moin, P.,
-
[5]
The minimal flow unit in near-wall turbulence. J. Fluid Mech. 225, 213–240. doi:10.1017/S0022112091002033. Jung, W., Mangiavacchi, N., Akhavan, R.,
-
[6]
J. Fluid Mech. 759, 432–471. doi:10.1017/jfm.2014.575. Maaß, C., Schumann, U.,
-
[7]
Wall-bounded turbulent flows at high reynolds numbers: recent advances and key issues. J. Fluid Mech. 716, R3. doi:10.1017/jfm.2012.426. A.Amjadimanesh et al.:Preprint submitted to ElsevierPage 22 of 24 DNS of DR via piezo actuation 𝑊 𝑎𝑣𝑒(𝐶𝐹[%])𝜅 + × 104 𝜔+ 𝜂1 + max, 𝜂+ 2 max 𝜙1, 𝜙2 𝑅𝑒𝜏 𝐿𝑥∕ℎΔ𝑥 +,Δ𝑧 + 𝐷𝑅[%] DSHW-90* 5.010.146.81,6.15 0.73,-0.83 196 63.79 (...
-
[8]
Phys. Fluids 11, 943–945. Musgrave,P.,Borggaard,J.,Devenport,W.,Kochersberger,K.,Kurdila,A.,2018.TURBULENTBOUNDARYLAYEROVERAPIEZOELECTRI- CALLYEXCITEDTRAVELINGWAVESURFACE.Phdinmech.eng..VirginiaPolytechnicInstituteandStateUniversity.Blacksburg,Virginia. Musgrave,P.,Tarazaga,P.,2017. Skinfrictiondragreductioninturbulentflowusingspanwisetravelingsurfacewave...
-
[9]
Large-eddy simulation of high-reynolds-number turbulent channel flow controlled using streamwise travelling wave-like wall deformation for drag reduction. J. Fluid Mech 1003, A2. doi:10.1017/jfm.2024.1183. A.Amjadimanesh et al.:Preprint submitted to ElsevierPage 23 of 24 DNS of DR via piezo actuation Nabae, Y., Kawai, K., Fukagata, K.,
-
[10]
Int J Heat Fluid Fl 35, 152–159
Relaminarization of turbulent channel flow using traveling wave-like wall deformation. Int J Heat Fluid Fl 35, 152–159. Park,H.,Sun,G.,etal.,2014. Superhydrophobicturbulentdragreductionasafunctionofsurfacegratingparameters. J.FluidMech747,722–734. Quadrio, M.,
2014
-
[11]
Critical assessment of turbulent drag reduction through spanwise wall oscillations. J. Fluid Mech. 521, 251–271. doi:10.1017/S0022112004002149. Quadrio, M., Ricco, P., Viotti, C.,
-
[12]
Riblet-generated flow mechanisms that lead to local breaking of reynolds analogy. J. Fluid Mech 951, A45. Rouhi,A.,Fu,M.,Chandran,D.,Zampiron,A.,Smits,A.,Marusic,I.,2023. Turbulentdragreductionbyspanwisewallforcing.part1:Large-eddy simulation. J. Fluid Mech. 968, A6. Rouhi, A., Hultmark, M., Smits, A.,
2023
-
[13]
The characteristics of low-speed streaks in the near-wall region of a turbulent boundary layer. J. Fluid Mech. 129, 27–54. doi:10.1017/S002211208300116X. Smith, J., Brown, L., Müller, T.,
-
[14]
Timoshenko, S., Woinowsky-Krieger, S.,
Sovran,G.,1983.Tractive-energy-basedformulaefortheimpactofaerodynamicsonfueleconomyovertheepadrivingschedules.SAETransactions , 1039–1050. Timoshenko, S., Woinowsky-Krieger, S.,
1983
-
[15]
2nd ed., McGraw-Hill
Theory of Plates and Shells. 2nd ed., McGraw-Hill. Tomikawa,Y.,Adachi,K.,Hirata,H.,Suzuki,T.,Takano,T.,1990. Excitationofaprogressivewaveinaflexurallyvibratingtransmissionmedium. Jpn. J. Appl. Phys. 29,
1990
-
[16]
Near-wallstreakmodificationbyspanwiseoscillatorywallmotionanddrag-reductionmechanisms
Touber,E.,Leschziner,M.,2012. Near-wallstreakmodificationbyspanwiseoscillatorywallmotionanddrag-reductionmechanisms. J.FluidMech 693, 150–200. Weller, H., Tabor, G., Jasak, H., Fureby, C.,
2012
discussion (0)
Sign in with ORCID, Apple, or X to comment. Anyone can read and Pith papers without signing in.