Pith. sign in

REVIEW 2 major objections 5 minor 210 references

Sensitive FAST single-pulse snapshots find nulling, mode changes or subpulse modulation in 374 pulsars, mostly older and slower, with P3 tied to spin and field.

Reviewed by Pith at T0; open to challenge. T0 means a machine referee read the full paper against a public rubric. the ladder, T0–T4 →

T0 review · grok-4.5

2026-07-12 05:13 UTC pith:TPJAY2OX

load-bearing objection Large, homogeneous FAST single-pulse catalog that multiplies the known sample of nullers, mode-changers and modulators; short snapshots limit quantitative fractions but not the existence claims or population trends. the 2 major comments →

arxiv 2607.03047 v1 pith:TPJAY2OX submitted 2026-07-03 astro-ph.HE

FAST Pulsar Database III. Snapshots of nulling, mode-changing and subpulse modulation of 374 pulsars

classification astro-ph.HE
keywords pulsarsnullingmode changingsubpulse driftingsubpulse modulationFASTP3single-pulse sequences
verification ladder T0 review T1 audit T2 compute T3 formal T4 reserved

The pith

A machine-rendered reading of the paper's core claim, the machinery that carries it, and where it could break.

This paper uses the high sensitivity of FAST at L-band to examine single-pulse sequences of hundreds of pulsars and to catalogue three classic emission behaviours: nulling (radio emission that switches off for one or more periods), mode changing (abrupt switches between quasi-stable average pulse shapes), and subpulse modulation or drifting (systematic intensity or phase patterns that repeat every few periods). It reports these phenomena in 374 sources, the large majority of which are first detections: 127 new nullers, 51 new mode-changers and 180 new modulators. The affected pulsars are statistically older, longer-period and lower-spin-down than the general population, and the modulation cycle length P3 correlates with rotation period, magnetic field and spin-down luminosity. The result matters because these single-pulse behaviours are widely regarded as direct diagnostics of magnetospheric current systems and carousel-like spark patterns; a large, homogeneous sample therefore constrains which physical regimes allow the emission to switch or organise itself.

Core claim

From FAST L-band single-pulse sequences the authors identify nulling, mode-changing or subpulse modulation in 374 pulsars (160 nullers of which 127 are new, 52 mode-changers of which 51 are new, 272 modulators of which 180 are new). Objects that show these behaviours are preferentially older, longer-period and lower-Ė, and the modulation period P3 is correlated with rotation period, magnetic-field strength and spin-down energy-loss rate.

What carries the argument

Longitude-resolved fluctuation spectra (LRFS) and two-dimensional fluctuation spectra (2DFS) applied to FAST single-pulse stacks, which extract the modulation cycle P3, the phase separation P2 and the drift rate D = P2/P3 for each profile component, together with on-pulse energy histograms that quantify nulling fractions and separate emission modes.

Load-bearing premise

That short FAST snapshots, typically only a few hundred to a few thousand periods long, are long enough both to detect the presence of nulling or modulation and to yield representative P3 values, even though the paper itself notes that reliable nulling fractions need longer integrations.

What would settle it

A set of multi-hour continuous observations of a substantial fraction of the newly claimed nullers and modulators that either fails to recover the reported behaviours or yields systematically different P3 and nulling statistics.

Watch this falsifier — get emailed when new claim-graph text bears on it.

Editorial analysis

A structured set of objections, weighed in public.

Desk editor's note, referee report, simulated authors' rebuttal, and a circularity audit.

Referee Report

2 major / 5 minor

Summary. The paper presents a large-scale single-pulse survey of 374 pulsars observed with FAST at L-band (1.0–1.5 GHz). Using standard tools (on-pulse energy histograms for nulling fractions, visual and histogram-based mode classification, LRFS/2DFS and cross-correlation for subpulse modulation), the authors report nulling in 160 sources (127 new), mode-changing in 52 (51 new), and subpulse modulation in 272 (180 new). Detailed examples and per-source parameters (Tables 1–5) are given, together with population statistics showing that nulling/modulating pulsars are preferentially older, longer-period and lower-Ė, and that P3 correlates with P, B and Ė.

Significance. This is a substantial observational contribution. The combination of FAST sensitivity and a sample of 374 objects yields the largest single-instrument catalogue of nulling, mode-changing and subpulse-modulation detections to date, with hundreds of first-time reports. The tabulated P2/P3/D values with uncertainties, the multi-mode examples (e.g. J1927+1852, J2051+4434g), and the clear population trends provide a high-value reference for magnetospheric models (carousel, partially screened gap, etc.). The work is purely empirical, uses well-established analysis methods, and makes the qualitative detections checkable via the published stacks, histograms and spectra.

major comments (2)
  1. Section 5 (and abstract): the claimed correlations of P3 with P, B and Ė, and the statement that nulling/modulating pulsars are older/longer-P/lower-Ė, are load-bearing for the paper’s statistical conclusions. The manuscript does not yet show the actual correlation plots, Spearman/Pearson coefficients, sample sizes after cuts, or control for selection (e.g. period-dependent detectability of drifting in short snapshots). These quantitative results must be presented with uncertainties and a brief discussion of possible biases before the claims can be fully assessed.
  2. Section 3 and Table 1: many NF and P3 values are derived from 5–15 min snapshots. While the paper correctly notes that quantitative NF requires longer data, the tabulated NF values and the “first-time” counts are still used in the population statistics. A short, explicit statement of how many sources have only upper/lower limits or single-epoch detections, and whether those objects are retained or down-weighted in the §5 statistics, is needed so that readers can judge robustness.
minor comments (5)
  1. Table 1 is extremely long and dense; a machine-readable electronic table (or a split into nulling-only / mode-only / modulation-only) would greatly improve usability.
  2. Notation for modulation features (W.1, L.1, C.1, T.1, M.W.1, etc.) is introduced only in the Table 2 note; a short paragraph in §3.3 would help readers before they reach the tables.
  3. A few previously known nullers (e.g. J0540+3207, J0629+2415) are reclassified as weak-mode rather than nulling; a brief comparison with earlier NF values would clarify whether this is a sensitivity effect or a true state change.
  4. Occasional typographical inconsistencies appear (e.g. “gpps” numbering, mixed B/J names, “D M” vs “DM”); a light copy-edit pass would clean these up.
  5. Figures 1–23 are clear, but later individual-source figures in §4 are numerous; consider moving the bulk of §4 to an online appendix or electronic supplement while retaining the key multi-mode examples in the main text.

Circularity Check

0 steps flagged

No circularity: purely observational catalog of single-pulse phenomena with empirical population statistics; detections and correlations do not reduce to fitted inputs or self-citation chains.

full rationale

The paper reports detections of nulling, mode-changing and subpulse modulation from FAST single-pulse sequences (energy histograms, LRFS/2DFS, polarization profiles) and then presents sample statistics (older/longer-P/lower-Ė preference; P3 vs P/B/Ė). These are direct measurements and empirical correlations, not theoretical predictions derived from parameters fitted to the same data. Methods (NF from on/off energy Gaussians; P2/P3/D from LRFS/2DFS or cross-correlation) are standard and applied independently to each source. Self-citations (Han et al. GPPS survey papers, prior FAST polarization/single-pulse papers by the same group) supply independent data products or previously published individual sources; they are not load-bearing uniqueness theorems, ansatze, or definitions that force the present results. Short snapshot lengths are a completeness caveat already noted by the authors, not a circularity. No step reduces a claimed prediction to its own inputs by construction.

Axiom & Free-Parameter Ledger

0 free parameters · 3 axioms · 0 invented entities

The paper is an observational catalog; it inherits standard radio-astronomy reduction assumptions and the conventional definitions of nulling fraction, P2, P3 and drift rate. No free parameters are fitted to produce the central claims, and no new physical entities are postulated.

axioms (3)
  • domain assumption Nulling is identified by an excess of near-zero on-pulse energy relative to an off-pulse Gaussian of the same width.
    Standard operational definition used throughout Section 3.1 and the individual source notes.
  • domain assumption Subpulse modulation parameters P2, P3 and D are extracted from peaks in the longitude-resolved and two-dimensional fluctuation spectra (LRFS/2DFS).
    Method of Backer, Edwards & Stappers, Weltevrede et al., adopted without modification (Section 3.3).
  • ad hoc to paper Short FAST integrations are sufficient to establish the qualitative presence of the three phenomena even if quantitative fractions require longer data.
    Explicitly stated by the authors in Section 3; underpins the claim of 374 detections.

pith-pipeline@v1.1.0-grok45 · 94248 in / 2110 out tokens · 24829 ms · 2026-07-12T05:13:50.963601+00:00 · methodology

0 comments
read the original abstract

Based on sensitive L-band (1.0 to 1.5 GHz) observations of pulsars using the Five-hundred-meter Aperture Spherical radio Telescope (FAST), we analyzed single-pulse sequences from FAST-detected pulsars and identified nulling, mode changing, or subpulse modulation phenomena in 374 sources. Among these, nulling has been detected in 160 pulsars, with 127 cases reported for the first time. Emission mode changes have been observed in 52 pulsars, including 51 first-time detections. Subpulse modulation has been identified in 272 pulsars, 180 of which are newly revealed, with the majority displaying subpulse drifting behavior. Subpulse drifting in some pulsars exhibits distinct modes with varying drift properties, leading to mode changes and divergent mean profiles. Statistics on pulsar parameters show that pulsars exhibiting nulling and/or subpulse modulation tend to be older, with longer periods and lower spin-down energy-loss rates. The modulation period P3 is predominantly correlated with pulsar rotation periods, magnetic field strengths, and spin-down energy loss.

Figures

Figures reproduced from arXiv: 2607.03047 by C. Wang, D. J. Zhou, J. L. Han, J. Xu, N. N. Cai, P. F. Wang, T. Wang, W. C. Jing, W. Q. Su, Yi Yan, Z. L. Yang.

Figure 1
Figure 1. Figure 1: Single-pulse sequence of PSR J1501-0046 observed by FAST on 2020 December 18 (hereafter in format of “20201218”), accompanied by a zoom-in view in the right for the period range No. 380480. The color is scaled by σbin, which is the standard deviation of the off-pulse data sampling. The detailed variations of on-pulse energy of individual pulses are plotted in the right sub-panel, scaled to σE, which is the… view at source ↗
Figure 2
Figure 2. Figure 2: On-pulse energy histogram of individual pulses of PSR J1501-0046 from the FAST observation on 20201218, as shown in [PITH_FULL_IMAGE:figures/full_fig_p011_2.png] view at source ↗
Figure 3
Figure 3. Figure 3: Distribution of period numbers for continuous nulling PN against period numbers for adjacent pulses PE of PSR J1501−0046 (NE for advance nulling or EN for follow-up nulling) observed by FAST on 20201218. Symbols with deeper color in the PN and PE panel indicate a larger number of data with the same value. The duration histograms for the emission and nulls are shown in the top and right panels, respectively… view at source ↗
Figure 5
Figure 5. Figure 5: Similar to [PITH_FULL_IMAGE:figures/full_fig_p012_5.png] view at source ↗
Figure 4
Figure 4. Figure 4: Histogram of the nulling degree and nulling scale (see Yang et al. 2014; Wang et al. 2020) for PSR J1501-0046 observed by FAST on 20201218. The nulling scale and degree have the average (and standard deviation) of 57◦ (18) and 4(2) pulsar period. the negative part of this distribution with a Gaussian func￾tion. This is because this part of the distribution stems from the random fluctuations during nulling … view at source ↗
Figure 7
Figure 7. Figure 7: Averaged intensity profiles (I, solid line), the linear po￾larization profiles (L, dashed line) and the circular polarization pro￾files (V , dotted line) for the weak (red) and bright (blue) emission modes of PSR J1848-0023 observed on 20211226 are shown in the top panel. The averaged PA curves of the two emission modes are shown in the bottom panel. For every emission mode, the profiles in the top panel a… view at source ↗
Figure 8
Figure 8. Figure 8: Similar to [PITH_FULL_IMAGE:figures/full_fig_p013_8.png] view at source ↗
Figure 10
Figure 10. Figure 10: Similar to [PITH_FULL_IMAGE:figures/full_fig_p017_10.png] view at source ↗
Figure 9
Figure 9. Figure 9: Intensity fluctuation analysis of PSR J1832+2749 with the LRFS (top-left) and 2DFS approaches for the emission of the whole pulse phase range (top-right), the Leading half part (bottom left), and the Trailing half part (bottom right). Regular modulations for all parts exhibit a widely enhanced fluctuation spectrum with a peak frequency around 1/P3 = 0.22, corresponding to P3 = 4.4 periods. The drifting fre… view at source ↗
Figure 11
Figure 11. Figure 11: Similar to [PITH_FULL_IMAGE:figures/full_fig_p018_11.png] view at source ↗
Figure 12
Figure 12. Figure 12: Similar to [PITH_FULL_IMAGE:figures/full_fig_p019_12.png] view at source ↗
Figure 13
Figure 13. Figure 13: Similar to [PITH_FULL_IMAGE:figures/full_fig_p019_13.png] view at source ↗
Figure 16
Figure 16. Figure 16: Similar to [PITH_FULL_IMAGE:figures/full_fig_p020_16.png] view at source ↗
Figure 14
Figure 14. Figure 14: Similar to [PITH_FULL_IMAGE:figures/full_fig_p020_14.png] view at source ↗
Figure 15
Figure 15. Figure 15: Similar to [PITH_FULL_IMAGE:figures/full_fig_p020_15.png] view at source ↗
Figure 18
Figure 18. Figure 18: Similar to [PITH_FULL_IMAGE:figures/full_fig_p022_18.png] view at source ↗
Figure 17
Figure 17. Figure 17: Similar to [PITH_FULL_IMAGE:figures/full_fig_p022_17.png] view at source ↗
Figure 19
Figure 19. Figure 19: Similar to [PITH_FULL_IMAGE:figures/full_fig_p023_19.png] view at source ↗
Figure 18
Figure 18. Figure 18: Continued for [PITH_FULL_IMAGE:figures/full_fig_p023_18.png] view at source ↗
Figure 21
Figure 21. Figure 21: Similar to [PITH_FULL_IMAGE:figures/full_fig_p024_21.png] view at source ↗
Figure 20
Figure 20. Figure 20: Similar to [PITH_FULL_IMAGE:figures/full_fig_p024_20.png] view at source ↗
Figure 23
Figure 23. Figure 23: Similar to [PITH_FULL_IMAGE:figures/full_fig_p025_23.png] view at source ↗
Figure 25
Figure 25. Figure 25: Fluctuation analysis of PSR J0039+35 from the FAST observa￾tion on 20210927, with LRFS and 2DFS for the whole pulse phase range in a mean pulse profile. 0 8 16 0 200 400 600 800 1000 1200 1400 1600 Pulse No. I/ bin J0115+6325 20250811 20 0 20 Longitude ( ) 0 1 I/Ipeak 0 5 E/ E 0 8 16 50 100 150 200 250 300 350 Pulse No. I/ bin J0115+6325 20250811 20 0 20 Longitude ( ) 0 1 I/Ipeak 0 5 E/ E [PITH_FULL_IMAG… view at source ↗
Figure 24
Figure 24. Figure 24: Single pulse sequences of PSR J0039+35 from the FAST ob￾servation on 20210927. tence of subpulse drifting behavior. The negative drift feature in LRFS and 2DFS is distributed over a wide temporal range, which suggests a non-systematic modulation. The centroid of the drift feature in 2DFS is characterized by frequencies of 1/P3 = 0.096 ± 0.002 and 1/P2 = −11 ± 3, corre￾sponding to periodicities of P3 = 10.… view at source ↗
Figure 26
Figure 26. Figure 26: Single pulse sequence of PSR J0115+6325 from the FAST observation on 20250811, and a zoomed-in view of pulses No.1-400 [PITH_FULL_IMAGE:figures/full_fig_p026_26.png] view at source ↗
Figure 29
Figure 29. Figure 29: On-pulse energy histogram of individual pulses of PSR J0137+6349 from the observation on 20250811. 20 15 10 5 0 5 10 15 Longitude ( ) 0.0 0.4 0.8 I/Ip e a k J0137+6349 20250811 Aver. Prof. Weak Bright [PITH_FULL_IMAGE:figures/full_fig_p027_29.png] view at source ↗
Figure 27
Figure 27. Figure 27: Fluctuation analysis of PSR J0115+6325 from the FAST obser￾vation on 20250811, with LRFS and 2DFS for the whole pulse phase range in a mean pulse profile. 0 15 30 200 400 600 800 1000 1200 Pulse No. I/ bin J0137+6349 20250811 20 0 Longitude ( ) 0 1 I/Ipeak 0 100 E/ E 0 15 30 525 550 575 600 625 650 675 Pulse No. I/ bin J0137+6349 20250811 20 0 Longitude ( ) 0 1 I/Ipeak 0 100 E/ E [PITH_FULL_IMAGE:figures… view at source ↗
Figure 28
Figure 28. Figure 28: Single pulse sequence of PSR J0137+6349 from the FAST observation on 20250811, and a zoomed-in view of pulses No.500-700. 0 50 100 Number I = 0 J0137+6349 20250811 0 20 40 60 80 100 E/ E 0 1 2 3 4 5 I/<I> [PITH_FULL_IMAGE:figures/full_fig_p027_28.png] view at source ↗
Figure 32
Figure 32. Figure 32: On-pulse energy histogram of individual pulses of PSR J0209+5759 from the FAST observation on 20250823. The inset provides a view of the xaxis region from -9 to 15. 0 10 20 20 40 60 80 100 120 140 Pulse No. I/ bin J0244+14 20210927 10 0 Longitude ( ) 0 1 I/Ipeak 0 10 E/ E [PITH_FULL_IMAGE:figures/full_fig_p028_32.png] view at source ↗
Figure 33
Figure 33. Figure 33: Single pulse sequence of PSR J0244+14 from the FAST obser￾vation on 20210927. the properties of the weak emission and its relationship with nulling and bright states. 4.5. J0244+14 PSR J0244+14 was discovered by the Arecibo telescope at 327 MHz (Deneva et al. 2013). This pulsar was observed by FAST on 20210927 for 5 min￾utes, with a rotation period P = 2.1279 s and a dispersion measure DM = 27.2 cm−3 pc f… view at source ↗
Figure 31
Figure 31. Figure 31: Single pulse sequences of PSR J0209+5759 from the FAST observation on 20250823. 0 20 40 60 80 100 E/ E 0 50 100 150 Number J0209+5759 20250823 0 10 20 30 40 I/<I> 0 10 0 100 [PITH_FULL_IMAGE:figures/full_fig_p028_31.png] view at source ↗
Figure 34
Figure 34. Figure 34: On-pulse energy histogram of individual pulses of PSR J0244+14 from the FAST observation on 20210927. 0 40 80 50 100 150 200 250 Pulse No. I/ bin J0302+2252 20201101 0 20 Longitude ( ) 0 1 I/Ipeak 0 250 E/ E 0 40 80 300 350 400 450 500 Pulse No. I/ bin J0302+2252 20201101 0 20 Longitude ( ) 0 1 I/Ipeak 0 250 E/ E [PITH_FULL_IMAGE:figures/full_fig_p029_34.png] view at source ↗
Figure 37
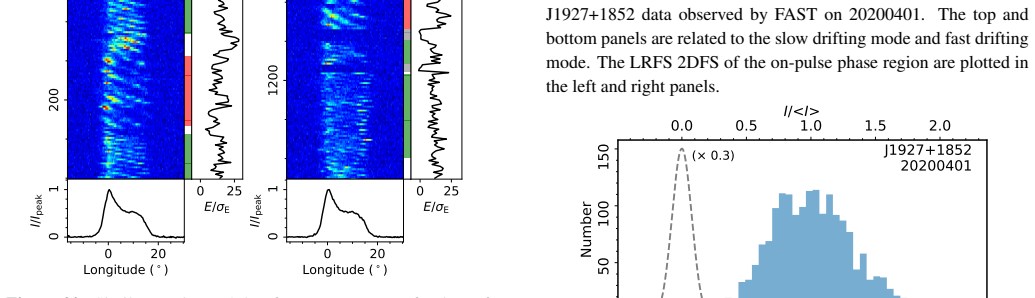
Figure 37. Figure 37: Averaged polarization profiles (the top panel) for the slow drift￾ing mode and fast drifting mode of PSR J0302+2252 from the observation on 20201101, as well as the average PA curves (the bottom panel). Profiles in the top panel are normalized to their respective peaks. This pulsar was observed by FAST on 20201101, with a rotation period P = 1.2071 s and a dispersion measure DM = 19.0 cm−3 pc. Single puls… view at source ↗
Figure 35
Figure 35. Figure 35: Single pulse sequences of PSR J0302+2252 from the FAST observation on 20201101. tence of the nulling phenomenon. Based on the on-pulse in￾tegral energy histogram ( [PITH_FULL_IMAGE:figures/full_fig_p029_35.png] view at source ↗
Figure 40
Figure 40. Figure 40: Fluctuation analysis of PSR J0343+5312 from the FAST obser￾vation on 20210108, with LRFS and 2DFS for the whole pulse phase range in a mean pulse profile. has 1/P2 = −62 ± 4 and 1/P3 = 0.343 ± 0.002, yielding P2 = −5.8±0.4 ◦ and P3 = 2.91±0.02 periods. In addition, there is also a drift feature with f3 widely ranging from 0.18 to 0.32, indicating the variation of drifting properties, which requires a long… view at source ↗
Figure 38
Figure 38. Figure 38: Single pulse sequence of PSR J0343+5312 from the FAST observation on 20240623. 5 0 5 10 15 20 25 E/ E 0 20 40 60 Number J0343+5312 20240623 0 1 2 3 I/<I> [PITH_FULL_IMAGE:figures/full_fig_p030_38.png] view at source ↗
Figure 39
Figure 39. Figure 39: On-pulse energy histogram of PSR J0343+5312 from the ob￾servation on 20240623. PSR J0343+5312 was discovered using the 91-m transit telescope of the National Radio Astronomy Observatory in Green Bank (Damashek et al. 1978). This pulsar was observed by FAST on 20240623 for 5 min￾utes, deriving a rotation period P = 1.9344 s and a dis￾persion measure DM = 66.3 cm−3 pc. The single pulse sequence in [PITH_FU… view at source ↗
Figure 41
Figure 41. Figure 41: Single pulse sequence of PSR J0453+1559 from the FAST observation on 20210108, accompanied by a zoomed-in view in the right for the period range No. 1230-1450. This pulsar was observed by FAST on 20250823 for 15 minutes, deriving a rotation period P = 3.7667 s and a dis￾persion measure DM = 49.8 cm−3 pc. From the single pulse sequence and fluctuation spectra, the pulsar has a neg￾ative drift behavior. The… view at source ↗
Figure 42
Figure 42. Figure 42: Fluctuation analysis of PSR J0453+1559 from the FAST ob￾servation on 20210108, with LRFS (top-left), and 2DFS for the whole pulse phase range (top-right), the leading part (bottom left) and the central part (bottom-right) of a mean pulse profile. whereas the weak mode lasts from 1 to 5 periods and typi￾cally only one period. Weak and strong modes both exhibit precursor emission over the longitude range -2… view at source ↗
Figure 43
Figure 43. Figure 43: Single pulse sequence of PSR J0458-0505 from the FAST observation on 20250823. LRFS 0.4 0.8 Norm. Power 0 10 Longitude ( ) 0 1 Norm. I 0.1 0.2 0.3 0.4 F r e q. ( 1 / P 3 ) J0458-0505 20250823 2DFS: W 0.4 0.8 Norm. Power 250 0 250 Freq. (1/P2) 0 1 Norm. P. 0.1 0.2 0.3 0.4 F r e q. ( 1 / P 3 ) J0458-0505 20250823 [PITH_FULL_IMAGE:figures/full_fig_p032_43.png] view at source ↗
Figure 45
Figure 45. Figure 45: Single pulse sequence of PSR J0502+4654 from the FAST ob￾servation on 20220917, and a zoomed-in view of pulses No. 1400-1600. In the right subpanel, the energy variation is integrated over the longitude range from -6.9◦ to 11.1◦. The magenta dash-dot line represents the boundary be￾tween the two emission modes [PITH_FULL_IMAGE:figures/full_fig_p032_45.png] view at source ↗
Figure 46
Figure 46. Figure 46: Energy histograms of PSR J0502+4654 from the FAST obser￾vation on 20220917. For every single pulse, the energy is integrated over the longitude range from -6.9◦ to 11.1◦. The weak and strong emission modes are labeled in red and green, respectively. 0 10 20 Counts N=30(41) 10 0 10 1 10 2 Periods for strong mode PS (P) 1 2 3 4 5 P erio d s f or w e a k m o d e P W (P) WS SW 0 100 Counts N=1(0) [PITH_FULL_… view at source ↗
Figure 47
Figure 47. Figure 47: Distribution of period numbers for the weak emission mode PW against period numbers for the adjacent strong mode PS of PSR J0502+4654 observed by FAST on 20220917, as well as the duration his￾tograms for the strong and weak emission modes shown in the top and right panels, respectively. PSR J0514+4009g was discovered in the FAST GPPS sur￾vey (Han et al. 2021, 2025). This pulsar was observed by FAST on 202… view at source ↗
Figure 49
Figure 49. Figure 49: Single pulse sequence of PSR J0514+4009 from the FAST observation on 20230213. with the temporal frequency of 1/P3 = 0.047±0.001, which corresponds to P3 = 21.5 ± 0.5 periods. 4.12. J0517+3436g PSR J0517+3436g was discovered in the FAST GPPS sur￾vey (Han et al. 2021, 2025) [PITH_FULL_IMAGE:figures/full_fig_p033_49.png] view at source ↗
Figure 51
Figure 51. Figure 51: Single pulse sequences of PSR J0517+3436g from the obser￾vation on 20240629. 2.5 0.0 2.5 5.0 7.5 10.0 12.5 E/ E 0 20 40 60 80 100 Number J0517+3436g 20240629 1 0 1 2 3 4 I/<I> [PITH_FULL_IMAGE:figures/full_fig_p034_51.png] view at source ↗
Figure 50
Figure 50. Figure 50: Fluctuation analysis of PSR J0514+4009 from the FAST observation on 20230213, with LRFS (top-left), and 2DFS for the whole pulse phase range (top-right), the leading half (bottom left) and central half (bottom-right) of a mean pulse profile. This pulsar was observed by FAST for 15 minutes on 20240629, and for 5 minutes each on 20250205, 20250308 and 20250815. From the 15-minute data, a rotation pe￾riod P … view at source ↗
Figure 55
Figure 55. Figure 55: Single pulse sequences of PSR J0528+2200 from the FAST observation on 20230913. 0 200 400 600 800 E/ E 0 20 40 60 Number (× 0.2) J0528+2200 20230913 0.0 0.5 1.0 1.5 2.0 2.5 3.0 I/<I> 10 0 10 0 25 50 (× 0.2) [PITH_FULL_IMAGE:figures/full_fig_p035_55.png] view at source ↗
Figure 56
Figure 56. Figure 56: On-pulse energy histogram of PSR J0528+2200 from the ob￾servation on 20230913. This pulsar was observed by FAST on 20230913 for 49 minutes, with a rotation period P = 3.7452 s and a dis￾persion measure DM = 51.7 cm−3 pc. Single pulse se￾quences in [PITH_FULL_IMAGE:figures/full_fig_p035_56.png] view at source ↗
Figure 58
Figure 58. Figure 58: Single pulse sequences of PSR J0538+2817 from the FAST observation on 20190320. This pulsar was observed by FAST on 20190320 for 5 min￾utes, deriving a rotation period P = 0.1432 s and a disper￾sion measure DM = 40.0 cm−3 pc. Single pulse sequences in [PITH_FULL_IMAGE:figures/full_fig_p036_58.png] view at source ↗
Figure 57
Figure 57. Figure 57: Fluctuation analysis of PSR J0528+2200 from the FAST observation on 20230913, with LRFS (top-left), and 2DFS for the whole pulse phase range (top-right), the leading half (bottom left) and central half (bottom-right) of the mean pulse profile. profile part, the centroid of the drift feature in 2DFS is at 1/P3 = 0.275 ± 0.002 and 1/P2 = −64 ± 1, correspond￾ing to P3 = 3.64 ± 0.03 periods and P2 = −5.6 ± 0.… view at source ↗
Figure 59
Figure 59. Figure 59: Fluctuation analysis of PSR J0538+2817 from the FAST ob￾servation on 20190320, with LRFS (top-left), and 2DFS for the whole pulse phase range (top-right), the leading half (bottom left) and the central half (bottom-right) of the mean pulse profile. gle pulse sequences and two segments of zoomed-in views are displayed in [PITH_FULL_IMAGE:figures/full_fig_p037_59.png] view at source ↗
Figure 60
Figure 60. Figure 60: Single pulse sequences of PSR J0540+3207 from the FAST observation on 20191002, as well as two zoomed-in segments in the bottom [PITH_FULL_IMAGE:figures/full_fig_p037_60.png] view at source ↗
Figure 61
Figure 61. Figure 61: On-pulse energy histograms of PSR J0540+3207 from the FAST observation on 20191002. 0 20 40 Counts N=3(3) 0 8 16 24 Periods for bright mode (P0) 4 8 12 P erio d s f or w e a k m o d e (P 0) WN NW 0 50 Counts N=3(2) [PITH_FULL_IMAGE:figures/full_fig_p038_61.png] view at source ↗
Figure 64
Figure 64. Figure 64: Single pulse sequences of PSR J0543+2329 from the FAST observation on 20190422. 4.17. J0543+2329 PSR J0543+2329 was discovered by the Jodrell Bank Mark IA radio telescope at 408 MHz (Davies et al. 1972). This pulsar was reported to have mode changing behavior. Nowakowski (1991) took repeated short segments of single pulses behaving in a similar way as different modes at 430 MHz, and the typical duration i… view at source ↗
Figure 63
Figure 63. Figure 63: Mean profiles for the weak and bright emission modes of PSR J0540+3207 from the observation on 20191002. Profiles are normalized by their respective peaks. one period or several periods. From the duration distribu￾tions of two emission modes in [PITH_FULL_IMAGE:figures/full_fig_p038_63.png] view at source ↗
Figure 67
Figure 67. Figure 67: On-pulse energy histogram of PSR J0546+2441 from the ob￾servation on 20190418. 6 4 2 0 2 4 6 Longitude interval ( °) 0.0 0.4 0.8 Norm. corre. coeffi. J0546+2441 20190418 [PITH_FULL_IMAGE:figures/full_fig_p039_67.png] view at source ↗
Figure 65
Figure 65. Figure 65: Fluctuation analysis of PSR J0543+2329 from the observation on 20190422, with LRFS and 2DFS for the whole pulse phase range of a mean pulse profile. 0 100 200 20 40 60 80 100 Pulse No. I/ bin J0546+2441 20190418 5 0 5 Longitude ( ) 0 1 I/Ipeak 0 100 E/ E [PITH_FULL_IMAGE:figures/full_fig_p039_65.png] view at source ↗
Figure 66
Figure 66. Figure 66: Single pulse sequence of PSR J0546+2441 from the observa￾tion on 20190418. 0 50 100 150 E/ E 0 5 10 15 20 25 Number (× 0.6) J0546+2441 20190418 0 1 2 3 4 5 6 I/<I> 10 0 10 0 10 20 (× 0.6) [PITH_FULL_IMAGE:figures/full_fig_p039_66.png] view at source ↗
Figure 69
Figure 69. Figure 69: Single pulse sequence of PSR J0555+3948 from the observa￾tion on 20210524. 0 10 20 30 40 50 E/ E 0 10 20 30 40 50 Number (× 0.55) J0555+3948 20210524 1 0 1 2 3 4 5 6 I/<I> [PITH_FULL_IMAGE:figures/full_fig_p040_69.png] view at source ↗
Figure 70
Figure 70. Figure 70: On-pulse energy histogram of individual pulses of PSR J0555+39481 from the observation on 20210524. 4.20. J0611+30 PSR J0611+30 was discovered by Camilo et al. (1996a) using the Arecibo telescope at 430 MHz. This pulsar was observed by FAST on 20210526 for 5 min￾utes, deriving a rotation period P = 1.4119 s and a disper￾sion measure DM = 43.0 cm−3 pc. The single pulse se￾quence ( [PITH_FULL_IMAGE:figures… view at source ↗
Figure 73
Figure 73. Figure 73: Single pulse sequences of PSR J0612+3721 from the FAST observation on 20210109. ing parameters of the central component are estimated to be P3 = 35±2 periods and P2 = −11±1 ◦ . The trailing compo￾nent has a temporal modulation of 30±4 periods. Different from other components, the leading part of the mean profile has a lower modulation periodicity of 9.8±0.2 periods. 4.22. J0613+3731 PSR J0613+3731 was dis… view at source ↗
Figure 74
Figure 74. Figure 74: Fluctuation analysis of PSR J0612+3721 from the FAST ob￾servation on 20210109, with LRFS (top-left), and 2DFS for the leading part (top-right), the central part (bottom left) and trailing part (bottom-right) of a mean pulse profile. P2=10+10 −3 degrees, as well as P3-only feature of 2.10(4) P0, were reported by Song et al. (2023). The pulsar was observed by FAST on 20220307 for 5 min￾utes, with a rotation… view at source ↗
Figure 75
Figure 75. Figure 75: Single pulse sequences of PSR J0613+3731 from the FAST observation on 20210110. 4.24. J0621+1002 PSR J0621+1002 was discovered using the Arecibo tele￾scope at 430 MHz Camilo et al. (1996a). Wang et al. (2021) reported intensity modulation features in fluctuation spectra of the first component with peak of 3.0 ± 0.1 periods, and third pulse components with two diffused peaks of 3.0 ± 0.1 periods and 200 ± … view at source ↗
Figure 76
Figure 76. Figure 76: Fluctuation analysis of PSR J0613+3731 from the FAST ob￾servation on 20210110, with LRFS (top-left), and 2DFS for the leading part (top-right), the central part (bottom left) and trailing part (bottom-right) of a mean pulse profile. tion with the centroid of 1/P3 = 0.028 ± 0.001, that cor￾responds P3 = 35 ± 1 periods for the trailing component. There is also a very narrow modulation frequency on time of 1… view at source ↗
Figure 77
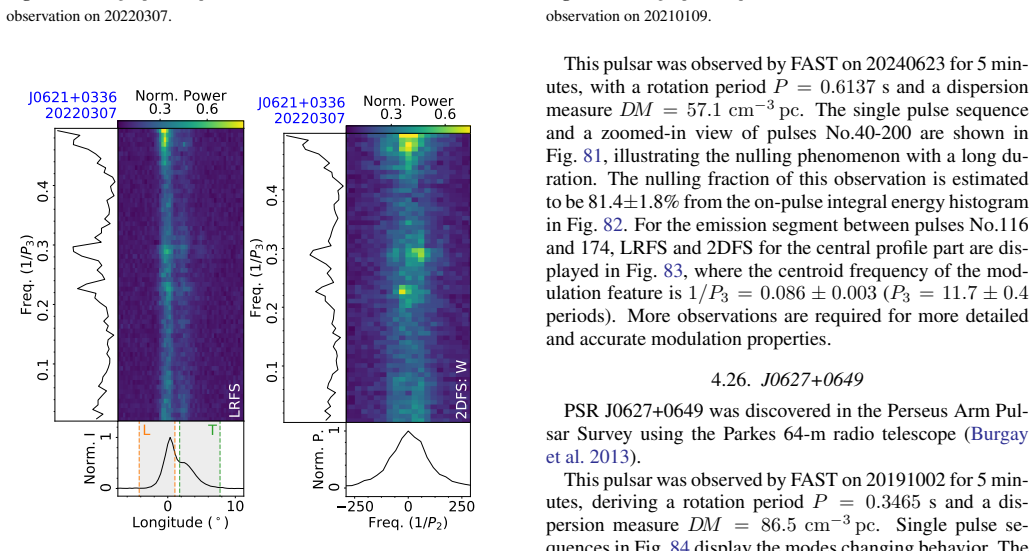
Figure 77. Figure 77: Single pulse sequences of PSR J0621+0336 from the FAST observation on 20220307. LRFS 0.3 0.6 Norm. Power 0 10 Longitude ( ) 0 1 Norm. I L T 0.1 0.2 0.3 0.4 F r e q. ( 1 / P 3 ) J0621+0336 20220307 2DFS: W 0.3 0.6 Norm. Power 250 0 250 Freq. (1/P2) 0 1 Norm. P. 0.1 0.2 0.3 0.4 F r e q. ( 1 / P 3 ) J0621+0336 20220307 [PITH_FULL_IMAGE:figures/full_fig_p043_77.png] view at source ↗
Figure 78
Figure 78. Figure 78: Fluctuation analysis of PSR J0621+0336 from the FAST ob￾servation on 20220307, with LRFS and 2DFS for the on-pulse phase range of a mean pulse profile. 0 10 20 0 10000 20000 30000 40000 50000 Pulse No. I/ bin J0621+1002 20210109 100 0 Longitude ( ) 0 1 I/Ipeak 0 50 E/ E 0 10 20 325 350 375 400 425 450 475 Pulse No. I/ bin J0621+1002 20210109 100 0 Longitude ( ) 0 1 I/Ipeak 0 50 E/ E [PITH_FULL_IMAGE:figu… view at source ↗
Figure 81
Figure 81. Figure 81: Single pulse sequence of PSR J0623+0340 from the FAST observation on 20240623, and a zoomed-in view of pulses No.40-200. 0 10 20 30 40 50 E/ E 0 50 100 150 Number J0623+0340 20240623 0 5 10 15 20 I/<I> [PITH_FULL_IMAGE:figures/full_fig_p044_81.png] view at source ↗
Figure 80
Figure 80. Figure 80: Fluctuation analysis of PSR J0621+1002 from the observation on 20210109, with LRFS (top-left), and 2DFS for the leading part (top￾right), the central part (bottom left) and trailing part (bottom-right) of a mean pulse profile. variation histogram ( [PITH_FULL_IMAGE:figures/full_fig_p044_80.png] view at source ↗
Figure 83
Figure 83. Figure 83: Fluctuation analysis of PSR J0623+0340 for pulses No.116- 174 from the observation on 20240623, with LRFS and 2DFS for the central part of a mean pulse profile. shape corresponding to two emission modes. Two emission modes are labeled using red and green colors. To analyse the relationship between MP and IP, we set the weak mode to be "0" and the bright mode to be "1". As a result, two 0-1 sequences relat… view at source ↗
Figure 85
Figure 85. Figure 85: On-pulse energy histogram of PSR J0627+0649 from the ob￾servation on 20210111. 10 5 0 5 10 15 20 Longitude ( ) 0.0 0.4 0.8 I/Ip e a k J0627+0649 20191002 Aver. Prof. Normal Abnormal [PITH_FULL_IMAGE:figures/full_fig_p045_85.png] view at source ↗
Figure 86
Figure 86. Figure 86: Mean profiles for the normal and abnormal modes of PSR J0627+0649 from the observation on 20200401. Profiles in the plot are nor￾malized by the respective peaks [PITH_FULL_IMAGE:figures/full_fig_p045_86.png] view at source ↗
Figure 88
Figure 88. Figure 88: Occurrence correlation between two emission modes of PSR J0627+0706 from the FAST observation on 20191126. 0 250 500 Number I = 0 J0627+0706 20191126 0 50 100 150 200 250 E/ E 0 1 2 3 4 5 I/<I> 0 200 400 Number I = 0 J0627+0706 20191126 0 20 40 60 E/ E 0.0 0.5 1.0 1.5 2.0 2.5 3.0 I / <I> [PITH_FULL_IMAGE:figures/full_fig_p046_88.png] view at source ↗
Figure 89
Figure 89. Figure 89: On-pulse energy histogram of PSR J0627+0706 for the main pulse and inter-pulse from the observation on 20210111. vation, the temporal modulation periodicity P3 is estimated to be 6.56±0.03 periods with no apparent phase modulation. 4.29. J0630+1002g PSR J0630+1002g was discovered in the FAST GPPS sur￾vey (Han et al. 2021, 2025). FAST observed the pulsar on 20240414 for 15 minutes and on 20250125 for 46 mi… view at source ↗
Figure 87
Figure 87. Figure 87: Single pulse sequences of PSR J0627+0706 from the FAST observation on 20191126. 100 75 50 25 0 25 50 IP Lagged Period number 0.41 0.42 0.43 0.44 Arbitrary Correlation Coefficient Origin Smoothed [PITH_FULL_IMAGE:figures/full_fig_p046_87.png] view at source ↗
Figure 90
Figure 90. Figure 90: Mean profiles of the weak (red dashed line) and bright emission (green dotted line) modes for the main pulse (upper plot) and interpulse (lower plot) of PSR J0627+0706, from the FAST observation on 20191126. The profiles of the two modes are normalized by the peak of the mean profile (black solid line) of all periods. ing component has the centroid phase modulation frequency of 1/P2 = 166 ± 7, which corre… view at source ↗
Figure 92
Figure 92. Figure 92: On-pulse energy histogram of PSR J0629+2415 from the FAST observation on 20210111. existence of the nulling behavior. There are 26 single pulses whose integral energies are less than 3σE in this observation. 4.32. J0652-0142 PSR J0652-0142 was discovered in the Perseus Arm Pulsar Survey with the Parkes 64-m radio telescope (Burgay et al. 2013). This pulsar was observed by FAST on 20240624 for 5 min￾utes, … view at source ↗
Figure 95
Figure 95. Figure 95: Fluctuation analysis of PSR J0630+1002g from the FAST ob￾servation on 20240414, with LRFS and 2DFS for the on-pulse phase range of a mean pulse profile. 0 30 60 100 200 300 400 500 Pulse No. I/ bin J0646+0905 20231212 20 0 20 Longitude ( ) 0 1 I/Ipeak 0 250 E/ E 0 30 60 600 700 800 900 1000 1100 Pulse No. I/ bin J0646+0905 20231212 20 0 20 Longitude ( ) 0 1 I/Ipeak 0 250 E/ E [PITH_FULL_IMAGE:figures/ful… view at source ↗
Figure 96
Figure 96. Figure 96: Single pulse sequences of PSR J0646+0905 from the FAST observation on 20231212 [PITH_FULL_IMAGE:figures/full_fig_p048_96.png] view at source ↗
Figure 99
Figure 99. Figure 99: On-pulse energy histogram of PSR J0647+0913 from the ob￾servation on 20200113. 0 8 16 50 100 150 200 250 300 350 Pulse No. I/ bin J0658+2936 20240821 10 0 10 Longitude ( ) 0 1 I/Ipeak 0 25 E/ E 0 8 16 400 450 500 550 600 650 700 Pulse No. I/ bin J0658+2936 20240821 10 0 10 Longitude ( ) 0 1 I/Ipeak 0 25 E/ E [PITH_FULL_IMAGE:figures/full_fig_p049_99.png] view at source ↗
Figure 97
Figure 97. Figure 97: Fluctuation analysis of PSR J0646+0905 from the FAST ob￾servation on 20231212, with LRFS and 2DFS for the on-pulse phase range of a mean pulse profile. 0 25 50 50 100 150 200 Pulse No. I/ bin J0647+0913 20200113 0 20 Longitude ( ) 0 1 I/Ipeak 0 50 E/ E [PITH_FULL_IMAGE:figures/full_fig_p049_97.png] view at source ↗
Figure 100
Figure 100. Figure 100: Single pulse sequences of PSR J0658+2936 from the obser￾vation on 20240821. tra in [PITH_FULL_IMAGE:figures/full_fig_p049_100.png] view at source ↗
Figure 98
Figure 98. Figure 98: Single pulse sequence of PSR J0647+0913 from the observa￾tion on 20200113. 10 0 10 20 30 40 50 60 E/ E 0 20 40 60 Number (× 0.4) J0647+0913 20200113 0.5 0.0 0.5 1.0 1.5 2.0 2.5 3.0 I/<I> [PITH_FULL_IMAGE:figures/full_fig_p049_98.png] view at source ↗
Figure 101
Figure 101. Figure 101: On-pulse energy histogram of PSR J0658+2936 from the observation on 20240821. 0 8 16 50 100 150 200 250 300 Pulse No. I/ bin J0652-0142 20240624 25 0 25 Longitude ( ) 0 1 I/Ipeak 0 25 E/ E [PITH_FULL_IMAGE:figures/full_fig_p050_101.png] view at source ↗
Figure 103
Figure 103. Figure 103: Fluctuation analysis of PSR J0652-0142 from the FAST ob￾servation on 20240624, with LRFS and 2DFS for the on-pulse phase range of the mean pulse profile. 0 40 80 25 50 75 100 125 150 175 200 Pulse No. I/ bin J0711+0931 20210111 5 0 5 Longitude ( ) 0 1 I/Ipeak 0 50 E/ E [PITH_FULL_IMAGE:figures/full_fig_p050_103.png] view at source ↗
Figure 102
Figure 102. Figure 102: Single pulse sequence of PSR J0652-0142 from the FAST observation on 20240624. persion measure DM = 38.8 cm−3 pc were determined. Single pulse sequences in [PITH_FULL_IMAGE:figures/full_fig_p050_102.png] view at source ↗
Figure 104
Figure 104. Figure 104: Single pulse sequence of PSR J0711+0931 from the observa￾tion on 20210111 [PITH_FULL_IMAGE:figures/full_fig_p050_104.png] view at source ↗
Figure 105
Figure 105. Figure 105: On-pulse energy histogram of PSR J0711+0931 from the observation on 20210111. LRFS 0.2 0.4 Norm. Power 5 0 5 Longitude ( ) 0 1 Norm. I 0.1 0.2 0.3 0.4 F r e q. ( 1 / P 3 ) J0711+0931 20210111 2DFS: W 0.2 0.4 Norm. Power 250 0 250 Freq. (1/P2) 0 1 Norm. P. 0.1 0.2 0.3 0.4 F r e q. ( 1 / P 3 ) J0711+0931 20210111 [PITH_FULL_IMAGE:figures/full_fig_p051_105.png] view at source ↗
Figure 107
Figure 107. Figure 107: Single pulse sequence of PSR J0811+37 from the observation on 20210928. 5 0 5 10 E/ E 0 20 40 60 80 Number J0811+37 20210928 2 1 0 1 2 3 4 I/<I> [PITH_FULL_IMAGE:figures/full_fig_p051_107.png] view at source ↗
Figure 108
Figure 108. Figure 108: On-pulse energy histogram of PSR J0811+37 for the observa￾tion on 20210928. This pulsar was observed by FAST on 20210928 for 5 min￾utes, with a rotation period P = 1.2483 s and a dispersion measure DM = 17.2 cm−3 pc from this observation. The single pulse sequence of the FAST observation is shown in [PITH_FULL_IMAGE:figures/full_fig_p051_108.png] view at source ↗
Figure 109
Figure 109. Figure 109: Fluctuation analysis of PSR J0811+37 from the observation on 20210928, with LRFS and 2DFS for the on-pulse phase range of a mean pulse profile. 0 10 20 50 100 150 200 250 300 350 400 Pulse No. I/ bin J0815+4611 20201124 10 0 10 Longitude ( ) 0 1 I/Ipeak 0 25 E/ E 0 10 20 450 500 550 600 650 700 750 800 850 Pulse No. I/ bin J0815+4611 20201124 10 0 10 Longitude ( ) 0 1 I/Ipeak 0 25 E/ E [PITH_FULL_IMAGE:… view at source ↗
Figure 110
Figure 110. Figure 110: Single pulse sequences of PSR J0815+4611 from the obser￾vation on 20201124. LRFS 0.3 0.6 Norm. Power 10 0 10 Longitude ( ) 0 1 Norm. I 0.1 0.2 0.3 0.4 F r e q. ( 1 / P 3 ) J0815+4611 20201124 2DFS: W 0.4 0.8 Norm. Power 100 0 100 Freq. (1/P2) 0 1 Norm. P. 0.1 0.2 0.3 0.4 F r e q. ( 1 / P 3 ) J0815+4611 20201124 [PITH_FULL_IMAGE:figures/full_fig_p052_110.png] view at source ↗
Figure 113
Figure 113. Figure 113: On-pulse energy histogram of PSR J0944+4106 from the observation on 20201124. 4.36. J0815+4611 PSR J0815+4611 was first reported by Sanidas et al. (2019) using the LOFAR Tied-Array All-Sky Survey (LOTAAS). Zhao et al. (2023) reported the drifting properties at 290-500 MHz using the FAST wide-band observations. The pulsar was also observed by FAST on 20201124 for 6 minutes, yielding a rotation period P = … view at source ↗
Figure 114
Figure 114. Figure 114: Fluctuation analysis of PSR J0944+4106 for the observation on 20201124, with LRFS (top-left), and 2DFS for the leading part (top￾right), central part (bottom-left) and trailing part (bottom-right) of a mean pulse profile. 2DFS, the centroid frequencies of the positive drift feature are estimated to be 1/P3 = 0.290 ± 0.003 and 1/P2 = 173 ± 7, corresponding to periodicities of P3 = 3.45 ± 0.03 periods and … view at source ↗
Figure 115
Figure 115. Figure 115: Single pulse sequences of PSR J1048+5349 from the obser￾vation on 20240821. LRFS 0.4 0.8 Norm. Power 5 0 5 Longitude ( ) 0 1 Norm. I 0.1 0.2 0.3 0.4 0.5 F r e q. ( 1 / P 3 ) J1048+5349 20240821 2DFS: W 0.4 0.8 Norm. Power 250 0 250 Freq. (1/P2) 0 1 Norm. P. 0.1 0.2 0.3 0.4 0.5 F r e q. ( 1 / P 3 ) J1048+5349 20240821 [PITH_FULL_IMAGE:figures/full_fig_p054_115.png] view at source ↗
Figure 118
Figure 118. Figure 118: On-pulse integral energy histogram of PSR J1236-0159 from the observation on 20210111. to be 23±3% from the on-pulse integral energy histogram in [PITH_FULL_IMAGE:figures/full_fig_p054_118.png] view at source ↗
Figure 116
Figure 116. Figure 116: Fluctuation analysis of PSR J1048+5349 for the observation on 20240821, with LRFS and 2DFS for the on-pulse phase range of a mean pulse profile. 0 15 30 20 40 60 80 100 120 140 Pulse No. I/ bin J1236-0159 20201219 10 0 10 Longitude ( ) 0 1 I/Ipeak 0 25 E/ E [PITH_FULL_IMAGE:figures/full_fig_p054_116.png] view at source ↗
Figure 121
Figure 121. Figure 121: On-pulse integral energy histogram of individual pulses of PSR J1404+1159 from the observation on 20220913. 0 10 20 20 40 60 80 100 120 140 160 Pulse No. I/ bin J1502+4653 20250125 10 0 10 Longitude ( ) 0 1 I/Ipeak 0 10 E/ E 0 10 20 180 200 220 240 260 280 300 320 340 Pulse No. I/ bin J1502+4653 20250125 10 0 10 Longitude ( ) 0 1 I/Ipeak 0 10 E/ E [PITH_FULL_IMAGE:figures/full_fig_p055_121.png] view at source ↗
Figure 119
Figure 119. Figure 119: Single pulse sequences of PSR J1404+1159 from the FAST observation on 20220913. LRFS 0.2 0.4 Norm. Power 10 0 10 Longitude ( ) 0 1 Norm. I 0.1 0.2 0.3 0.4 F r e q. ( 1 / P 3 ) J1404+1159 20220913 2DFS: W 0.2 0.4 Norm. Power 200 0 200 Freq. (1/P2) 0 1 Norm. P. 0.1 0.2 0.3 0.4 F r e q. ( 1 / P 3 ) J1404+1159 20220913 [PITH_FULL_IMAGE:figures/full_fig_p055_119.png] view at source ↗
Figure 122
Figure 122. Figure 122: Single pulse sequences of PSR J1502+4653 from the FAST observation on 20250125. dispersion measure DM = 18.9 cm−3 pc. Single pulse se￾quences in [PITH_FULL_IMAGE:figures/full_fig_p055_122.png] view at source ↗
Figure 120
Figure 120. Figure 120: Fluctuation analysis of PSR J1404+1159 from the FAST ob￾servation on 20220913, with LRFS and 2DFS for the on-pulse region of a mean pulse profile. 0 10 20 30 40 50 60 E/ E 0 20 40 60 Number (× 0.3) J1404+1159 20220913 0.00 0.25 0.50 0.75 1.00 1.25 1.50 I/<I> [PITH_FULL_IMAGE:figures/full_fig_p055_120.png] view at source ↗
Figure 123
Figure 123. Figure 123: On-pulse integral energy histogram of individual pulses of PSR J1502+4653 from the observation on 20250125. energy decrease is not nulls, as there is no single pulse whose on-pulse integral energy is less than 3σE ( [PITH_FULL_IMAGE:figures/full_fig_p056_123.png] view at source ↗
Figure 124
Figure 124. Figure 124: Fluctuation analysis of PSR J1502+4653 from the FAST ob￾servation on 20250125, with LRFS (top-left), and 2DFS for the on-pulse region (top-right), leading part (bottom-left) and trailing part (bottom-right) of a mean pulse profile. nent, with the centroid frequencies of 1/P3 = 0.341 ± 0.001 and 1/P2 = −19 ± 2, corresponding to periodicities of P3 = 2.93 ± 0.01 periods and P2 = −19 ± 2 degrees. The featur… view at source ↗
Figure 125
Figure 125. Figure 125: Single pulse sequence of PSR J1547-0944 from the FAST observation on 20250811, and a zoomed-in view of pulses No. 100-200. LRFS 0.0 0.3 0.6 Norm. Power 0 10 Longitude ( ) 0 1 Norm. I 0.1 0.2 0.3 0.4 F r e q. ( 1 / P 3 ) J1543-0620 20250525 2DFS: W 0.2 0.5 Norm. Power 250 0 250 Freq. (1/P2) 0 1 Norm. P. 0.1 0.2 0.3 0.4 F r e q. ( 1 / P 3 ) J1543-0620 20250525 [PITH_FULL_IMAGE:figures/full_fig_p057_125.png] view at source ↗
Figure 128
Figure 128. Figure 128: On-pulse integral energy histogram of individual pulses of PSR J1547-0944 from the observation on 20250811. PSR J1547-0944 was discovered by the Green Bank Tele￾scope Lynch et al. (2013). This pulsar was observed by FAST on 20250811 for 15 minutes, and a rotation period P = 1.5771 s and a dispersion measure DM = 36.4 cm−3 pc were derived. Single pulse sequences are shown in [PITH_FULL_IMAGE:figures/full… view at source ↗
Figure 126
Figure 126. Figure 126: Fluctuation analysis of PSR J1543-0620 from the FAST ob￾servation on 20250525, with LRFS and 2DFS for the on-pulse region of a mean pulse profile. 0 10 20 50 100 150 200 250 Pulse No. I/ bin J1547-0944 20250811 10 0 Longitude ( ) 0 1 I/Ipeak 0 25 E/ E 0 10 20 300 350 400 450 500 550 Pulse No. I/ bin J1547-0944 20250811 10 0 Longitude ( ) 0 1 I/Ipeak 0 25 E/ E [PITH_FULL_IMAGE:figures/full_fig_p057_126.png] view at source ↗
Figure 131
Figure 131. Figure 131: Fluctuation analysis of PSR J1549+2113 from the FAST ob￾servation on 20250217, with LRFS and 2DFS for the on-pulse region of a mean pulse profile. in [PITH_FULL_IMAGE:figures/full_fig_p058_131.png] view at source ↗
Figure 129
Figure 129. Figure 129: Single pulse sequences of PSR J1549+2113 from the FAST observation on 20250217. 0 10 20 30 E/ E 0 50 100 150 Number J1549+2113 20250217 0.5 0.0 0.5 1.0 1.5 2.0 2.5 I/<I> [PITH_FULL_IMAGE:figures/full_fig_p058_129.png] view at source ↗
Figure 130
Figure 130. Figure 130: On-pulse integral energy histogram of individual pulses of PSR J1549+2113 from the FAST observation on 20250217. PSR J1549+2113 was discovered by the Arecibo telescope (Foster et al. 1995). This pulsar was reported by citet￾Song2023 to have the drifting behavior of P3 = 2.58 ± 0.09 periods and P2 = −9.8 +2 −0.9 degrees, as well as a P3-only feature of P3 = 71 ± 21 periods. The pulsar was observed by FAST… view at source ↗
Figure 133
Figure 133. Figure 133: On-pulse integral energy histogram of individual pulses of PSR J1610-1322 from the FAST observation on 20250816. centroid at 1/P3 = 0.221±0.004 and 1/P2 = −30±1, cor￾responding to P3 = 4.5 ± 0.1 periods and P2 = −12.1 ± 0.5 degrees. 4.46. J1623-0908 PSR J1623-0908 was discovered from observations at the Molonglo Radio Observatory and the Australian National Radio Astronomy Observatory, Parkes (Manchester… view at source ↗
Figure 132
Figure 132. Figure 132: Single pulse sequences of PSR J1610-1322 from the FAST observation on 20250816. The normal, slow drifting, and fast drifting modes are labeled with orange, red, and green bars, respectively. 0 10 20 30 E/ E 0 100 200 300 400 Number J1610-1322 20250816 0 1 2 3 I/<I> [PITH_FULL_IMAGE:figures/full_fig_p059_132.png] view at source ↗
Figure 135
Figure 135. Figure 135: Single pulse sequences of PSR J1623-0908 from the observa￾tion on 20250217. 0 25 50 75 100 125 150 E/ E 0 25 50 75 100 125 Number (× 0.4) J1623-0908 20250217 0.0 0.5 1.0 1.5 2.0 2.5 3.0 3.5 I/<I> [PITH_FULL_IMAGE:figures/full_fig_p060_135.png] view at source ↗
Figure 136
Figure 136. Figure 136: On-pulse integral energy histogram of individual pulses of PSR J1623-0908 from the FAST observation on 20250217. PSR J1657+3304 was discovered by Tyul’bashev et al. (2017) at 111 MHz. The nulling fraction was reported to be 27%-43% by Tan et al. (2020) from four observations of LOFAR at 149 MHz. This pulsar was observed by FAST on 20210203 for 9 min￾utes, deriving a rotation period P = 1.5704 s and a dis… view at source ↗
Figure 134
Figure 134. Figure 134: Fluctuation analysis of PSR J1610-1322 from the FAST ob￾servation on 20250816, with LRFS and 2DFS for the on-pulse region of the mean pulse profile. The normal, slow drifting, and fast drifting modes are shown at the top, center, and bottom, respectively. 0 60 120 50 100 150 200 Pulse No. I/ bin J1623-0908 20250217 5 0 5 Longitude ( ) 0 1 I/Ipeak 0 100 E/ E 0 60 120 250 300 350 400 450 Pulse No. I/ bin J… view at source ↗
Figure 137
Figure 137. Figure 137: Fluctuation analysis of PSR J1623-0908 from the observation on 20250217, with LRFS and 2DFS for the on-pulse region of a mean pulse profile. 0 15 50 100 150 200 250 Pulse No. I/ bin J1643+1338 20210203 10 0 10 Longitude ( ) 0 1 I/Ipeak 10 20 E/ E 0 15 250 300 350 400 450 Pulse No. I/ bin J1643+1338 20210203 10 0 10 Longitude ( ) 0 1 I/Ipeak 10 20 E/ E [PITH_FULL_IMAGE:figures/full_fig_p061_137.png] view at source ↗
Figure 138
Figure 138. Figure 138: Single pulse sequences of PSR J1643+1338 from the obser￾vation on 20210203. LRFS 0.3 0.6 Norm. Power 10 0 10 Longitude ( ) 0 1 Norm. I 0.1 0.2 0.3 0.4 F r e q. ( 1 / P 3 ) J1643+1338 20210203 2DFS: W 0.0 0.5 Norm. Power 250 0 250 Freq. (1/P2) 0 1 Norm. P. 0.1 0.2 0.3 0.4 F r e q. ( 1 / P 3 ) J1643+1338 20210203 [PITH_FULL_IMAGE:figures/full_fig_p061_138.png] view at source ↗
Figure 141
Figure 141. Figure 141: On-pulse energy histogram of PSR J1657+3304 from the observation on 20210203. 0 40 80 20 40 60 80 100 Pulse No. I/ bin J1714-1054 20250523 0 10 20 Longitude ( ) 0 1 I/Ipeak 0 100 E/ E 0 40 80 120 140 160 180 200 220 Pulse No. I/ bin J1714-1054 20250523 0 10 20 Longitude ( ) 0 1 I/Ipeak 0 100 E/ E [PITH_FULL_IMAGE:figures/full_fig_p062_141.png] view at source ↗
Figure 143
Figure 143. Figure 143: Fluctuation analysis of PSR J1714-1054 from the FAST ob￾servation on 20250523, with LRFS (top-left), and 2DFS for the on-pulse region (top-right), leading part (bottom-left) and trailing part (bottom-right) of a mean pulse profile. tra ( [PITH_FULL_IMAGE:figures/full_fig_p062_143.png] view at source ↗
Figure 144
Figure 144. Figure 144: Single pulse sequence of PSR J1722+35 from the observation on 20211030. LRFS 0.3 0.6 Norm. Power 10 0 10 Longitude ( ) 0 1 Norm. I 0.1 0.2 0.3 0.4 0.5 F r e q. ( 1 / P 3 ) J1722+35 20211030 2DFS: W 0.4 0.8 Norm. Power 250 0 250 Freq. (1/P2) 0 1 Norm. P. 0.1 0.2 0.3 0.4 0.5 F r e q. ( 1 / P 3 ) J1722+35 20211030 [PITH_FULL_IMAGE:figures/full_fig_p063_144.png] view at source ↗
Figure 145
Figure 145. Figure 145: Fluctuation analysis of PSR J1722+35 from the observation on 20211030, with LRFS and 2DFS for the on-pulse region of a mean pulse profile. 0 20 40 50 100 150 200 250 300 350 400 Pulse No. I/ bin J1735-0724 20250127 20 0 20 Longitude ( ) 0 1 I/Ipeak 0 50 E/ E 0 20 40 450 500 550 600 650 700 750 800 850 Pulse No. I/ bin J1735-0724 20250127 20 0 20 Longitude ( ) 0 1 I/Ipeak 0 50 E/ E [PITH_FULL_IMAGE:figur… view at source ↗
Figure 148
Figure 148. Figure 148: Single pulse sequence of PSR J1739+0612 from the FAST observation on 20201013, and a zoomed-in view of pulses No. 300-500. The pulsar was observed by FAST on 20211030 for 5 min￾utes, with a rotation period P = 0.8217 s and a dispersion measure DM = 23.6 cm−3 pc from this observation. The single pulse sequence is shown in [PITH_FULL_IMAGE:figures/full_fig_p064_148.png] view at source ↗
Figure 149
Figure 149. Figure 149: Fluctuation analysis of PSR J1739+0612 from the observation on 20201013, with LRFS and 2DFS for the on-pulse region of a mean pulse profile. 0.046 ± 0.001, corresponding to P3 = 21.9 ± 0.4 periods. There are also short-duration intensity decreases lasting for about 1-period, and longer observations are required for fur￾ther analysis. 4.52. J1739+0612 PSR J1739+0612 was discovered by the 64 m Parkes radio… view at source ↗
Figure 150
Figure 150. Figure 150: Single pulse sequences of PSR J1741-0840 from the FAST observation on 20250521. 0 50 100 150 200 E/ E 0 10 20 30 40 50 Number (× 0.3) J1741-0840 20250521 0.0 0.5 1.0 1.5 2.0 2.5 3.0 I/<I> 0 20 0 20 40 (× 0.3) [PITH_FULL_IMAGE:figures/full_fig_p065_150.png] view at source ↗
Figure 152
Figure 152. Figure 152: Fluctuation analysis of PSR J1741-0840 from the observation on 20250521, with LRFS and 2DFS for the on-pulse region of a mean pulse profile. corresponding to the unsystematic drifting property in single pulse sequences, and reflects the varying drifting direction. The phase interval between adjacent subpulses is stable to be P2 = 8.9 ±0.1◦. 4.53. J1741-0840 PSR J1741-0840 was discovered in the second Mol… view at source ↗
Figure 155
Figure 155. Figure 155: Mean profiles of two emission modes of PSR J1743-0339 from the observation on 20201114. 0 30 60 50 100 150 200 Pulse No. I/ bin J1745-0129 20201128 10 0 Longitude ( ) 0 1 I/Ipeak 0 50 E/ E 0 30 60 250 300 350 400 450 Pulse No. I/ bin J1745-0129 20201128 10 0 Longitude ( ) 0 1 I/Ipeak 0 50 E/ E [PITH_FULL_IMAGE:figures/full_fig_p066_155.png] view at source ↗
Figure 153
Figure 153. Figure 153: Single pulse sequences of PSR J1743-0339 from the FAST observation on 20201114, as well as the energy variation of the leading pro￾file part in the right subpanel. 0 100 200 Number I = 0 J1743-0339 20201114 0 20 40 60 80 E/ E 0 10 20 30 40 I / <I> [PITH_FULL_IMAGE:figures/full_fig_p066_153.png] view at source ↗
Figure 156
Figure 156. Figure 156: Single pulse sequences of PSR J1745-0129 from the FAST observation on 20201128. tra ( [PITH_FULL_IMAGE:figures/full_fig_p066_156.png] view at source ↗
Figure 157
Figure 157. Figure 157: On-pulse energy histogram of single pulses of PSR J1745- 0129 from the FAST observation on 20201128. LRFS 0.25 0.50 Norm. Power 10 0 Longitude ( ) 0 1 Norm. I 0.1 0.2 0.3 0.4 F r e q. ( 1 / P 3 ) J1745-0129 20201128 2DFS: W 0.25 0.50 Norm. Power 250 0 250 Freq. (1/P2) 0 1 Norm. P. 0.1 0.2 0.3 0.4 F r e q. ( 1 / P 3 ) J1745-0129 20201128 [PITH_FULL_IMAGE:figures/full_fig_p067_157.png] view at source ↗
Figure 159
Figure 159. Figure 159: Single pulse sequences of PSR J1748-1300 from the FAST observation on 20250127. The pulsar was discovered in a survey of intermediate Galactic latitudes using the Parkes 64-m radio telescope (Ed￾wards et al. 2001). The positive drifting behavior of P3 = 2.61 ± 0.04 and P2 = 5.3 +0.9 −0.5 degrees has been reported by Song et al. (2023). This pulsar was observed by FAST on 20201128 for 8 min￾utes, deriving… view at source ↗
Figure 161
Figure 161. Figure 161: Single pulse sequence of PSR J1749+5952 from the FAST observation on 20250816, and a zoomed-in view of pulses No. 1600-1900. LRFS 0.3 0.6 0.9 Norm. Power 0 25 Longitude ( ) 0 1 Norm. I 0.1 0.2 0.3 0.4 0.5 F r e q. ( 1 / P 3 ) J1749+5952 20250816 2DFS: W 0.3 0.6 Norm. Power 100 0 100 Freq. (1/P2) 0 1 Norm. P. 0.1 0.2 0.3 0.4 0.5 F r e q. ( 1 / P 3 ) J1749+5952 20250816 [PITH_FULL_IMAGE:figures/full_fig_p… view at source ↗
Figure 160
Figure 160. Figure 160: Fluctuation analysis of PSR J1807+0756 from the FAST ob￾servation on 20210117, with LRFS (top-left), and 2DFS for the leading part (top-right), central part (bottom-left) and trailing part (bottom-right) of a mean pulse profile. with P3 = 7 ± 2 periods and P2 = 28+20 −7 degrees, and a P3- only feature with P3 = 7.2 ± 0.4 periods. This pulsar was observed by FAST on 20250127 for 6 min￾utes, deriving a rot… view at source ↗
Figure 162
Figure 162. Figure 162: Fluctuation analysis of PSR J1749+5952 from the FAST ob￾servation on 20250816, with LRFS and 2DFS for the on-pulse region of a mean pulse profile [PITH_FULL_IMAGE:figures/full_fig_p068_162.png] view at source ↗
Figure 165
Figure 165. Figure 165: Single pulse sequences of PSR J1759-1029 from the FAST observation on 20250803. 0 10 20 30 40 50 60 E/ E 0 10 20 30 Number (× 0.2) J1759-1029 20250803 0 1 2 3 I/<I> [PITH_FULL_IMAGE:figures/full_fig_p069_165.png] view at source ↗
Figure 164
Figure 164. Figure 164: On-pulse integral histogram of PSR J1750+07 from the FAST observation on 20210208. degrees. The 2DFS of the central and trailing profile parts show modulation features without a preferred drift direction, and the centroid frequencies are 1/P3 = 0.147 ± 0.001 and 0.146 ± 0.002, yielding P3 = 6.8 ± 0.1 and 6.9 ± 0.1 peri￾ods, respectively. In contrast, the distribution of modulation features along the vert… view at source ↗
Figure 169
Figure 169. Figure 169: On-pulse energy histogram of single pulses of PSR J1800+5034 from the FAST observation on 20201016. 10 5 0 5 10 Longitude ( ) 0.0 0.5 1.0 Normalized I J1800+5034 20201016 Aver. Prof. Weak Bright [PITH_FULL_IMAGE:figures/full_fig_p070_169.png] view at source ↗
Figure 167
Figure 167. Figure 167: Fluctuation analysis of PSR J1759-1029 for the FAST obser￾vation on 20250803, with LRFS and 2DFS for the on-pulse region of the mean pulse profile. 0 8 16 100 200 300 400 500 Pulse No. I/ bin J1800+5034 20201016 10 0 10 Longitude ( ) 0 1 I/Ipeak 0 25 E/ E 0 8 16 600 700 800 900 1000 Pulse No. I/ bin J1800+5034 20201016 10 0 10 Longitude ( ) 0 1 I/Ipeak 0 25 E/ E [PITH_FULL_IMAGE:figures/full_fig_p070_167.png] view at source ↗
Figure 168
Figure 168. Figure 168: Single pulse sequences of PSR J1800+5034 from the FAST observation on 20201016. 0 50 100 Number I = 0 J1800+5034 20201016 5 0 5 10 15 20 25 30 E/ E 0.0 0.5 1.0 1.5 2.0 2.5 I/<I> [PITH_FULL_IMAGE:figures/full_fig_p070_168.png] view at source ↗
Figure 173
Figure 173. Figure 173: Fluctuation analysis of PSR J1802+0128 for the FAST obser￾vation on 20210117, with LRFS and 2DFS for the on-pulse region of a mean pulse profile. pears to be bimodal corresponding to two emission modes, which is used to distinguish the weak and bright emis￾sion modes. The contrast of mean profiles are displayed in [PITH_FULL_IMAGE:figures/full_fig_p071_173.png] view at source ↗
Figure 171
Figure 171. Figure 171: Single pulse sequences of PSR J1802+0128 from the FAST observation on 20210117. 0 20 40 60 80 100 120 E/ E 0 25 50 75 100 125 Number (× 0.4) J1802+0128 20210117 0 1 2 3 4 I/<I> [PITH_FULL_IMAGE:figures/full_fig_p071_171.png] view at source ↗
Figure 172
Figure 172. Figure 172: On-pulse energy histogram of PSR J1802+0128 from the FAST observation on 20210117. periodicities of P3 = 3.46±0.03 periods and P2 = 10.4±0.5 degrees. 4.60. J1800+5034 PSR J1800+5034 was discovered by Stovall et al. (2014) using the Green Bank Telescope at 350 MHz. The pulsar was observed by FAST on 20201016 for 10 minutes, deriving a rotation period P = 0.5784 s and a dispersion measure DM = 22.7 cm−3 pc… view at source ↗
Figure 176
Figure 176. Figure 176: Fluctuation analysis of PSR J1802-0523 for the FAST obser￾vation on 20250910, with LRFS and 2DFS for the on-pulse region of a mean pulse profile. 0 40 80 100 200 300 400 500 600 Pulse No. I/ bin J1806-1154 20250319 20 0 Longitude ( ) 0 1 I/Ipeak 0 200 E/ E 0 40 80 125 150 175 200 225 250 275 Pulse No. I/ bin J1806-1154 20250319 20 0 Longitude ( ) 0 1 I/Ipeak 0 200 E/ E [PITH_FULL_IMAGE:figures/full_fig_… view at source ↗
Figure 174
Figure 174. Figure 174: Single pulse sequence of PSR J1802-0523 from the FAST observation on 20250910. 0 10 20 30 40 E/ E 0 5 10 15 20 25 Number (× 0.5) J1802-0523 20250910 0 1 2 3 I/<I> [PITH_FULL_IMAGE:figures/full_fig_p072_174.png] view at source ↗
Figure 175
Figure 175. Figure 175: On-pulse energy histogram of PSR J1802-0523 from the FAST observation on 20250910. periodicities of P3 = 7.9 ± 0.1 periods and P2 = 6.3 ± 0.2 degrees. 4.63. J1806-1154 PSR J1806-1154 was discovered by Stokes et al. (1985) with the 92-m telescope at Green Bank. Song et al. (2023) reported a drift feature with P3 = 2.3±0.1 periods and P2 = 61+10 −54 degrees, and a P3-only feature with P3 = 12 ± 11 periods.… view at source ↗
Figure 177
Figure 177. Figure 177: Single pulse sequence of PSR J1806-1154 from the FAST observation on 20250319, and a zoomed-in view of pulses No. 100-300 [PITH_FULL_IMAGE:figures/full_fig_p072_177.png] view at source ↗
Figure 178
Figure 178. Figure 178: Fluctuation analysis of PSR J1806-1154 from the FAST ob￾servation on 20250319, with LRFS (top-left), and 2DFS for the on-pulse region and leading part of the mean pulse profile. 0 8 16 0 100 200 300 400 500 Pulse No. I/ bin J1807+0756 20210117 20 0 20 Longitude ( ) 0 1 I/Ipeak 0 20 E/ E 0 8 16 600 700 800 900 1000 1100 Pulse No. I/ bin J1807+0756 20210117 20 0 20 Longitude ( ) 0 1 I/Ipeak 0 20 E/ E [PIT… view at source ↗
Figure 180
Figure 180. Figure 180: Fluctuation analysis of PSR J1807+0756 from the FAST ob￾servation on 20210117, with LRFS (top-left), and 2DFS for the on-pulse region (top-right), leading part (bottom-left) and trailing part (bottom-right) of a mean pulse profile. measure DM = 122.4 cm−3 pc derived. The single pulse sequence and a zoomed-in view of pulses No. 100-300 are shown in [PITH_FULL_IMAGE:figures/full_fig_p073_180.png] view at source ↗
Figure 179
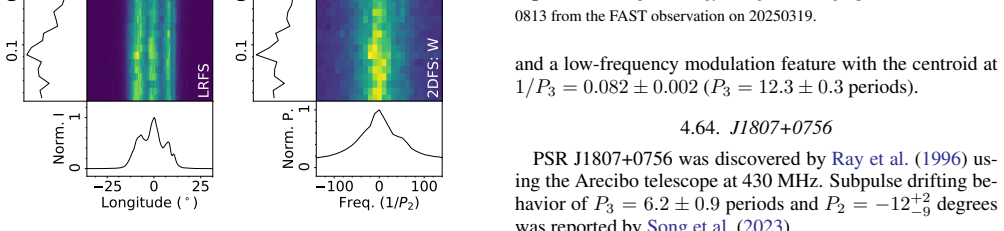
Figure 179. Figure 179: Single pulse sequences of PSR J1807+0756 from the FAST observation on 20210117. LRFS 0.3 0.6 Norm. Power 20 0 20 Longitude ( ) 0 1 Norm. I L T 0.1 0.2 0.3 0.4 F r e q. ( 1 / P 3 ) J1807+0756 20210117 2DFS: W 0.0 0.5 Norm. Power 200 0 200 Freq. (1/P2) 0 1 Norm. P. 0.1 0.2 0.3 0.4 F r e q. ( 1 / P 3 ) J1807+0756 20210117 2DFS: L 0.0 0.6 Norm. Power 200 0 200 Freq. (1/P2) 0 1 Norm. P. 0.1 0.2 0.3 0.4 F r e … view at source ↗
Figure 183
Figure 183. Figure 183: Single pulse sequences of PSR J1808-0813 from the FAST observation on 20250319. 0 50 100 150 E/ E 0 10 20 30 40 50 Number (× 0.3) J1808-0813 20250319 0.0 0.5 1.0 1.5 2.0 I/<I> [PITH_FULL_IMAGE:figures/full_fig_p074_183.png] view at source ↗
Figure 184
Figure 184. Figure 184: On-pulse energy histogram of single pulses of PSR J1808- 0813 from the FAST observation on 20250319. and a low-frequency modulation feature with the centroid at 1/P3 = 0.082 ± 0.002 (P3 = 12.3 ± 0.3 periods). 4.64. J1807+0756 PSR J1807+0756 was discovered by Ray et al. (1996) us￾ing the Arecibo telescope at 430 MHz. Subpulse drifting be￾havior of P3 = 6.2 ± 0.9 periods and P2 = −12+2 −9 degrees was repor… view at source ↗
Figure 182
Figure 182. Figure 182: Fluctuation analysis of PSR J1807-0847 for the observation on 20250319, with LRFS and 2DFS for the on-pulse region of a mean pulse profile. 0 15 30 25 50 75 100 125 150 175 200 Pulse No. I/ bin J1808-0813 20250319 20 0 Longitude ( ) 0 1 I/Ipeak 0 200 E/ E 0 15 30 225 250 275 300 325 350 375 400 Pulse No. I/ bin J1808-0813 20250319 20 0 Longitude ( ) 0 1 I/Ipeak 0 200 E/ E [PITH_FULL_IMAGE:figures/full_f… view at source ↗
Figure 185
Figure 185. Figure 185: Single pulse sequence of PSR J1809+17 from the FAST ob￾servation on 20240920, and a zoomed-in view of pulses No. 251-350. LRFS 0.4 0.8 Norm. Power 5 0 5 Longitude ( ) 0 1 Norm. I 0.1 0.2 0.3 0.4 0.5 F r e q. ( 1 / P 3 ) J1809+17 20240920 2DFS: W 0.4 0.8 Norm. Power 200 0 200 Freq. (1/P2) 0 1 Norm. P. 0.1 0.2 0.3 0.4 0.5 F r e q. ( 1 / P 3 ) J1809+17 20240920 [PITH_FULL_IMAGE:figures/full_fig_p075_185.png] view at source ↗
Figure 187
Figure 187. Figure 187: Single pulse sequences of PSR J1809-0119. 4.65. J1807-0847 PSR J1807-0847 was discovered by Manchester et al. (1978) in the second Molonglo pulsar survey. Song et al. (2023) reported a positive drifting with P3 = 3.8 ± 0.5 pe￾riods and P2 = 31+10 −16 degrees, and a negative drifting with P3 = 4.6 ± 0.6 periods and P2 = −35+19 −6 degrees, for two components respectively. This pulsar was observed by FAST o… view at source ↗
Figure 186
Figure 186. Figure 186: Fluctuation analysis of PSR J1809+17 for the observation on 20240920, with LRFS and 2DFS for the on-pulse region of a mean pulse profile. havior. From LRFS and 2DFS in [PITH_FULL_IMAGE:figures/full_fig_p075_186.png] view at source ↗
Figure 188
Figure 188. Figure 188: Fluctuation analysis of PSR J1809-0119 from the observation on 20210118, with LRFS and 2DFS for the on-pulse region of a mean pulse profile. features were reported by Song et al. (2023). The centroid frequency of the temporal modulation feature in 2DFS is 1/P3 = 0.068 ± 0.001, corresponding to P3 = 14.8 ± 0.3 periods. The centroid of the positive drift feature is char￾acterized by frequencies of 1/P3 = 0… view at source ↗
Figure 190
Figure 190. Figure 190: On-pulse energy histogram of single pulses of PSR J1810- 0100g from the FAST observation on 20230527 [PITH_FULL_IMAGE:figures/full_fig_p076_190.png] view at source ↗
Figure 191
Figure 191. Figure 191: Fluctuation analysis of PSR J1810-0100g from the observa￾tion on 20230527, with LRFS (top-left), and 2DFS for the on-pulse region (top-right), leading part (bottom-left) and trailing part (bottom-right) of a mean pulse profile. 4.67. J1809+17 PSR was discovered in the LOFAR Tied-Array All-Sky Survey (LOTAAS) (Sanidas et al. 2019). The pulsar was observed by FAST on 20240920 for 15 minutes, deriving a rot… view at source ↗
Figure 192
Figure 192. Figure 192: Single pulse sequences of PSR J1811-0154 from the FAST observation on 20230405. 0 15 30 1100 1200 1300 1400 1500 Pulse No. I/ bin J1811-0154 20230405 10 0 10 Longitude ( ) 0.0 0.5 1.0 I/Ipeak 0 25 E/ E 0 15 30 1600 1700 1800 1900 2000 Pulse No. I/ bin J1811-0154 20230405 10 0 10 Longitude ( ) 0.0 0.5 1.0 I/Ipeak 0 25 E/ E [PITH_FULL_IMAGE:figures/full_fig_p078_192.png] view at source ↗
Figure 192
Figure 192. Figure 192: Continued. 0 15 30 3200 3300 3400 3500 3600 Pulse No. I/ bin J1811-0154 20230405 10 0 10 Longitude ( ) 0.0 0.5 1.0 I/Ipeak 0 25 E/ E 0 15 30 3700 3800 3900 4000 4100 Pulse No. I/ bin J1811-0154 20230405 10 0 10 Longitude ( ) 0.0 0.5 1.0 I/Ipeak 0 25 E/ E [PITH_FULL_IMAGE:figures/full_fig_p079_192.png] view at source ↗
Figure 194
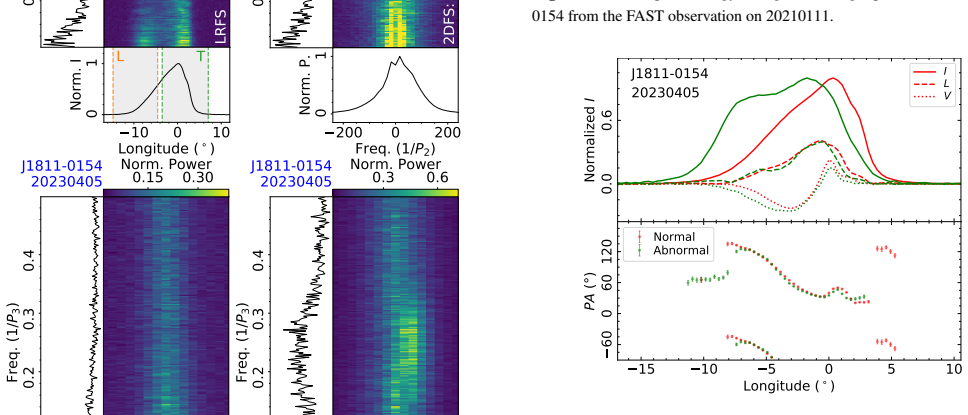
Figure 194. Figure 194: On-pulse energy histogram of single pulses of PSR J1811- 0154 from the FAST observation on 20210111. 0.0 0.6 N orm aliz e d I J1811-0154 20230405 I L V 15 10 5 0 5 10 Longitude ( ) 60 0 60 120 PA (°) Normal Abnormal [PITH_FULL_IMAGE:figures/full_fig_p080_194.png] view at source ↗
Figure 195
Figure 195. Figure 195: Mean polarization profiles (the top panel) for the normal and abnormal emission modes of PSR J1811-0154 from the FAST observation on 20200401, as well as the averaged PA curves (the bottom panel). Profiles in the top panel are normalized by the respective peaks. This pulsar was observed by FAST on 20250818 for 15 minutes, with a rotation period P = 2.6241 s and a disper￾sion measure DM = 253.4 cm−3 pc de… view at source ↗
Figure 193
Figure 193. Figure 193: Fluctuation analysis of PSR J1811-0154 for the observation on 20211123, with LRFS (top-left), and 2DFS for the on-pulse region (top￾right), leading part (bottom-left) and trailing part (bottom-right) of a mean pulse profile. histogram of the leading edge in the profile ( [PITH_FULL_IMAGE:figures/full_fig_p080_193.png] view at source ↗
Figure 196
Figure 196. Figure 196: Single pulse sequences of PSR J1811-1049 from the FAST observation on 20250818. 0 20 40 60 E/ E 0 20 40 60 80 Number (× 0.5) J1811-1049 20250818 0 1 2 3 4 5 I/<I> [PITH_FULL_IMAGE:figures/full_fig_p081_196.png] view at source ↗
Figure 197
Figure 197. Figure 197: On-pulse energy histogram of single pulses of PSR J1811- 1049 from the FAST observation on 20250818. tion. Single pulse sequences are shown in [PITH_FULL_IMAGE:figures/full_fig_p081_197.png] view at source ↗
Figure 201
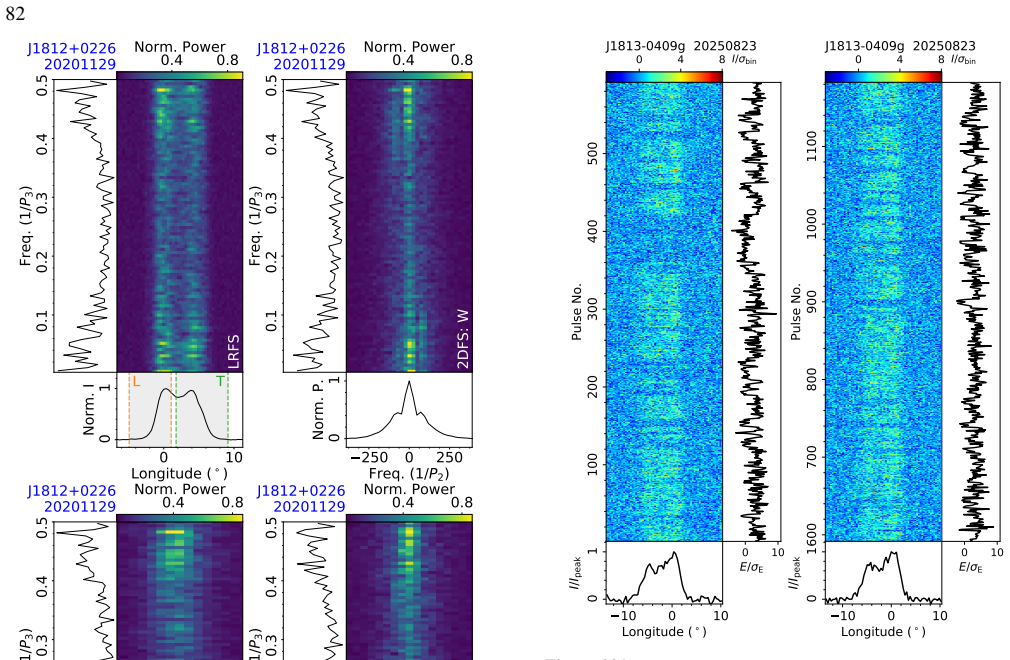
Figure 201. Figure 201: Single pulse sequences of PSR J1813-0409g from the FAST observation on 20250823. 4 2 0 2 4 6 8 10 E/ E 0 50 100 150 Number J1813-0409g 20250823 1 0 1 2 I/<I> [PITH_FULL_IMAGE:figures/full_fig_p082_201.png] view at source ↗
Figure 200
Figure 200. Figure 200: Fluctuation analysis of PSR J1812+0226 from the FAST ob￾servation on 20201129, with LRFS (top-left), and 2DFS for the on-pulse region (top-right), leading part (bottom-left) and trailing part (bottom-right) of a mean pulse profile. modulated seems superimposed on the 2-period modula￾tion, which is significant and similar to the behavior of PSR J1857+0057 (Yan et al. 2023a). 4.73. J1813-0409g PSR J1813-04… view at source ↗
Figure 205
Figure 205. Figure 205: Single pulse sequences of PSR J1818+03 from the FAST observation on 20240208. 0 10 20 30 E/ E 0 25 50 75 100 125 Number J1818+03 20240208 1 0 1 2 3 4 5 6 I/<I> [PITH_FULL_IMAGE:figures/full_fig_p083_205.png] view at source ↗
Figure 206
Figure 206. Figure 206: On-pulse energy histogram of PSR J1818+03 from the FAST observation on 20240208. persion measure DM = 40.2 cm−3 pc derived. Single pulse sequences in [PITH_FULL_IMAGE:figures/full_fig_p083_206.png] view at source ↗
Figure 204
Figure 204. Figure 204: Fluctuation analysis of PSR J1814-0057 for the observation on 20210717, with LRFS and 2DFS for the on-pulse region of a mean pulse profile. 0 8 16 25 50 75 100 125 150 175 Pulse No. I/ bin J1818+03 20240208 20 0 20 Longitude ( ) 0 1 I/Ipeak 0 25 E/ E 0 8 16 200 225 250 275 300 325 350 375 Pulse No. I/ bin J1818+03 20240208 20 0 20 Longitude ( ) 0 1 I/Ipeak 0 25 E/ E [PITH_FULL_IMAGE:figures/full_fig_p08… view at source ↗
Figure 209
Figure 209. Figure 209: Energy histogram for the central component of PSR J1818- 0151 from the FAST observation on 20210923, which is used to distinguish different emission modes. 0.0 0.5 1.0 N orm aliz e d I J1818-0151 20210923 I L V 10 5 0 5 10 15 Longitude ( ) 60 0 60 120 PA (°) Weak Bright [PITH_FULL_IMAGE:figures/full_fig_p084_209.png] view at source ↗
Figure 207
Figure 207. Figure 207: Fluctuation analysis of PSR J1818+03 for the observation on 20240208, with LRFS and 2DFS for the on-pulse region of a mean pulse profile. 0 30 60 50 100 150 200 250 300 350 Pulse No. I/ bin J1818-0151 20210923 10 0 10 Longitude ( ) 0 1 I/Ipeak 0 50 E/ E 0 30 60 110 120 130 140 150 160 170 180 190 Pulse No. I/ bin J1818-0151 20210923 10 0 10 Longitude ( ) 0 1 I/Ipeak 0 50 E/ E [PITH_FULL_IMAGE:figures/fu… view at source ↗
Figure 210
Figure 210. Figure 210: Mean polarization profiles (the top panel) of the weak and bright emission modes of PSR J1818-0151 from the FAST observation on 20210923, as well as the averaged PAs (the bottom panel). This pulsar was observed by FAST on 20240208 for 5 min￾utes, yielding a rotation period P = 0.7991 s and a dis￾persion measure DM = 97.9 cm−3 pc. Single pulse se￾quences shown in [PITH_FULL_IMAGE:figures/full_fig_p084_210.png] view at source ↗
Figure 208
Figure 208. Figure 208: Single pulse sequences of PSR J1818-0151 from the FAST observation on 20210923. 0 25 50 Number I = 0 J1818-0151 20210923 0 20 40 60 80 E/ E 2 0 2 4 6 8 10 12 I/<I> [PITH_FULL_IMAGE:figures/full_fig_p084_208.png] view at source ↗
Figure 211
Figure 211. Figure 211: Single pulse sequences of PSR J1819+1305 from the FAST observation on 20250217. 0 20 40 60 80 E/ E 0 25 50 75 100 125 Number (× 0.6) J1819+1305 20250217 0 1 2 3 I/<I> [PITH_FULL_IMAGE:figures/full_fig_p085_211.png] view at source ↗
Figure 212
Figure 212. Figure 212: On-pulse energy histogram of PSR J1819+1305 from the FAST observation on 20250217. 4.77. J1819+1305 PSR J1819+1305 was discovered in a survey of intermedi￾ate Galactic latitudes using the Parkes 64-m radio telescope Edwards et al. (2001). Periodic nulling with a fraction of LRFS 0.3 0.6 Norm. Power 0 25 Longitude ( ) 0 1 Norm. I L C T 0.1 0.2 0.3 0.4 0.5 F r e q. ( 1 / P 3 ) J1819+1305 20250217 2DFS: L 0… view at source ↗
Figure 215
Figure 215. Figure 215: Fluctuation analysis of PSR J1819-0040g for the observation on 20230613, with LRFS and 2DFS for the on-pulse region of a mean pulse profile. 0 10 20 50 100 150 200 250 300 350 Pulse No. I/ bin J1820+0006g 20240125 20 10 0 Longitude ( ) 0 1 I/Ipeak 0 50 E/ E [PITH_FULL_IMAGE:figures/full_fig_p086_215.png] view at source ↗
Figure 214
Figure 214. Figure 214: Single pulse sequences of PSR J1819-0040g from the FAST observation on 20230613. 4.78. J1819-0040g PSR J1819-0040g was discovered in the FAST GPPS sur￾vey (Han et al. 2021, 2025). This pulsar was observed by FAST on 20230613 for 15 minutes, yielding a rotation period P = 0.1601 s and a dis￾persion measure DM = 58.2 cm−3 pc from this observation. Single pulse sequences displayed in [PITH_FULL_IMAGE:figur… view at source ↗
Figure 216
Figure 216. Figure 216: Single pulse sequence of PSR J1820+0006g from the FAST observation on 20240125 [PITH_FULL_IMAGE:figures/full_fig_p086_216.png] view at source ↗
Figure 217
Figure 217. Figure 217: On-pulse energy histogram of single pulses of PSR J1820+0006g from the FAST observation on 20240125. LRFS 0.3 0.6 Norm. Power 20 0 Longitude ( ) 0 1 Norm. I L T 0.1 0.2 0.3 0.4 F r e q. ( 1 / P 3 ) J1820+0006g 20240125 2DFS: T 0.3 0.6 Norm. Power 500 0 500 Freq. (1/P2) 0 1 Norm. P. 0.1 0.2 0.3 0.4 F r e q. ( 1 / P 3 ) J1820+0006g 20240125 [PITH_FULL_IMAGE:figures/full_fig_p087_217.png] view at source ↗
Figure 219
Figure 219. Figure 219: The single pulse sequence of PSR J1820-0427 from the FAST observation on 20250228, and a zoomed-in view of pulses No. 101-250. LRFS 0.4 0.8 Norm. Power 10 0 10 Longitude ( ) 0 1 Norm. I 0.1 0.2 0.3 0.4 F r e q. ( 1 / P 3 ) J1820-0427 20250228 2DFS: W 0.4 0.8 Norm. Power 200 0 200 Freq. (1/P2) 0 1 Norm. P. 0.1 0.2 0.3 0.4 F r e q. ( 1 / P 3 ) J1820-0427 20250228 [PITH_FULL_IMAGE:figures/full_fig_p087_219.png] view at source ↗
Figure 220
Figure 220. Figure 220: Fluctuation analysis of PSR J1820-0427 for the FAST obser￾vation on 20250228, with LRFS and 2DFS for the on-pulse phase region of a mean pulse profile [PITH_FULL_IMAGE:figures/full_fig_p087_220.png] view at source ↗
Figure 221
Figure 221. Figure 221: Single pulse sequences of PSR J1821+0155 from the FAST observation on 20210618. LRFS 0.3 0.6 Norm. Power 5 0 5 Longitude ( ) 0 1 Norm. I 0.1 0.2 0.3 0.4 F r e q. ( 1 / P 3 ) J1821+0155 20210618 2DFS: W 0.3 0.6 Norm. Power 200 0 200 Freq. (1/P2) 0 1 Norm. P. 0.1 0.2 0.3 0.4 F r e q. ( 1 / P 3 ) J1821+0155 20210618 [PITH_FULL_IMAGE:figures/full_fig_p088_221.png] view at source ↗
Figure 224
Figure 224. Figure 224: On-pulse energy histogram of single pulses of PSR J1821+4147 from the FAST observation on 20201031. PSR J1820-0427 was discovered by Vaughan et al. (1969) using the Molonglo radio telescope. In previous studies of Weltevrede et al. (2007), the pulsar has a very broad feature with a preferred drift direction of P2 = −300+50 −100 degrees and P3 = 3 ± 1 periods at 92 cm, as well as a longitude stationary fe… view at source ↗
Figure 222
Figure 222. Figure 222: Fluctuation analysis of PSR J1821+0155 for the FAST obser￾vation on 20210618, with LRFS and 2DFS for the on-pulse phase region of a mean pulse profile. 0 15 30 25 50 75 100 125 150 175 Pulse No. I/ bin J1821+4147 20201031 0 10 20 Longitude ( ) 0 1 I/Ipeak 0 25 E/ E 0 15 30 200 225 250 275 300 325 350 375 Pulse No. I/ bin J1821+4147 20201031 0 10 20 Longitude ( ) 0 1 I/Ipeak 0 25 E/ E [PITH_FULL_IMAGE:fi… view at source ↗
Figure 225
Figure 225. Figure 225: Fluctuation analysis of PSR J1821+4147 for the observation on 20211123, with LRFS and 2DFS for the central phase region of a mean pulse profile. measure DM = 84.6 cm−3 pc were derived. The single pulse sequence and a zoomed-in view are shown in [PITH_FULL_IMAGE:figures/full_fig_p089_225.png] view at source ↗
Figure 226
Figure 226. Figure 226: Single pulse sequence of PSR J1822+0044g from the FAST observation on 20240627, and a zoomed-in view of pulses No. 605-695. 0 20 40 60 E/ E 0 50 100 150 200 Number J1822+0044g 20240627 0 5 10 15 20 25 I/<I> [PITH_FULL_IMAGE:figures/full_fig_p089_226.png] view at source ↗
Figure 227
Figure 227. Figure 227: On-pulse integral energy histograms of single pulses of PSR J1822+0044g from the FAST observation on 20240627. 15 10 5 0 5 10 15 Longitude interval ( °) 0.0 0.4 0.8 Norm. corre. coeffi. J1822+0044g 20240627 [PITH_FULL_IMAGE:figures/full_fig_p089_227.png] view at source ↗
Figure 228
Figure 228. Figure 228: Cross correlation of PSR J1822+0044g from the FAST obser￾vation on 20240627 [PITH_FULL_IMAGE:figures/full_fig_p089_228.png] view at source ↗
Figure 229
Figure 229. Figure 229: Single pulse sequences of PSR J1822+0705 from the FAST observation on 20210616. mated to be 8.8±0.9%. From single pulse sequences, there is a modulation of dual rotation periods related to changes between weak and bright intensities. The central compo￾nent also exhibits a low-frequency modulation in intensity, with periodic enhancements and weakenings at a centroid frequency of 1/P3 = 0.040 ± 0.002 ( [P… view at source ↗
Figure 230
Figure 230. Figure 230: Fluctuation analysis of PSR J1822+0705 for the observation on 20210616, with LRFS (top-left), and 2DFS for the on-pulse region (top￾right), leading part (bottom-left) and trailing part (bottom-right) of a mean pulse profile. PSR J1822+0705 was discovered by Foster et al. (1995) using the Arecibo telescope. Subpulse drifting behavior was reported by Song et al. (2023) previously. The pulsar was observed b… view at source ↗
Figure 233
Figure 233. Figure 233: Mean profiles of weak and bright emission modes of PSR J1822+1120 from the FAST observation on 20210116. Weak: LRFS 0.25 0.50 Norm. Power 0 10 Longitude ( ) 0 1 Norm. I L T 0.1 0.2 0.3 0.4 F r e q. ( 1 / P 3 ) J1822+1120 20210116 Weak: 2DFS: W 0.3 0.6 Norm. Power 250 0 250 Freq. (1/P2) 0 1 Norm. P. 0.1 0.2 0.3 0.4 F r e q. ( 1 / P 3 ) J1822+1120 20210116 [PITH_FULL_IMAGE:figures/full_fig_p091_233.png] view at source ↗
Figure 231
Figure 231. Figure 231: Single pulse sequence of PSR J1822+1120 from the FAST observation on 20210116. 5 0 5 10 15 20 E/ E 0 20 40 60 Number J1822+1120 20210116 0 1 2 3 I / <I> [PITH_FULL_IMAGE:figures/full_fig_p091_231.png] view at source ↗
Figure 232
Figure 232. Figure 232: On-pulse energy histogram of single pulses of PSR J1822+1120 from the FAST observation on 20210116. 4.85. J1822+1120 PSR J1822+1120 was discovered by the 305-m Arecibo radio telescope in a 430-MHz survey for pulsars (Lorimer et al. 2005). This pulsar was observed by FAST on 20210116 for 9 min￾utes, deriving a rotation period P = 1.7872 s and a disper￾5 0 5 10 Longitude ( ) 0.0 0.8 1.6 Normalized I J1822+… view at source ↗
Figure 237
Figure 237. Figure 237: On-pulse energy histogram of PSR J1824-0127 from the FAST observation on 20211223. LRFS 0.25 0.50 Norm. Power 0 10 Longitude ( ) 0 1 Norm. I L T 0.1 0.2 0.3 0.4 0.5 F r e q. ( 1 / P 3 ) J1824-0127 20211223 2DFS: W 0.3 0.6 Norm. Power 250 0 250 Freq. (1/P2) 0 1 Norm. P. 0.1 0.2 0.3 0.4 0.5 F r e q. ( 1 / P 3 ) J1824-0127 20211223 2DFS: L 0.3 0.6 Norm. Power 250 0 250 Freq. (1/P2) 0 1 Norm. P. 0.1 0.2 0.3 … view at source ↗
Figure 235
Figure 235. Figure 235: Similar to [PITH_FULL_IMAGE:figures/full_fig_p092_235.png] view at source ↗
Figure 238
Figure 238. Figure 238: Fluctuation analysis of PSR J1824-0127 for the observation on 20211223, with LRFS (top-left), and 2DFS for the on-pulse region (top￾right), leading part (bottom-left) and trailing part (bottom-right) of a mean pulse profile [PITH_FULL_IMAGE:figures/full_fig_p092_238.png] view at source ↗
Figure 240
Figure 240. Figure 240: On-pulse energy histogram of single pulses of PSR J1825+0004 from the FAST observation on 20210826. state. Song et al. (2023) reported negative drifting param￾eters of two components, they are P3 = 3.5 ± 0.1 and P2 = −49+40 −2 degrees for the leading component, and P3 = 3.3 ± 0.1 and P2 = −44+25 −39 degrees for the trailing compo￾nent. There is also a P3-only feature of 26 periods. This pulsar was observ… view at source ↗
Figure 239
Figure 239. Figure 239: Single pulse sequence of PSR J1825+0004 from the FAST observation on 20210826, and a zoomed-in view of pulses No. 490-790. 4.86. J1824-0127 PSR J1824-0127 was discovered by (Lorimer et al. 2006) in the Parkes Multibeam Pulsar Survey. Yan et al. (2024) showed this pulsar exhibiting dwarf pulses during the nulling 5 0 5 10 15 20 25 E/ E 0 50 100 150 Number (× 0.4) J1825+0004 20210826 0.0 0.5 1.0 1.5 2.0 I/… view at source ↗
Figure 242
Figure 242. Figure 242: Single pulse sequences of PSR J1825-0208g from the FAST observation on 20221109. 0 10 20 30 40 E/ E 0 25 50 75 100 Number J1825-0208g 20221109 2.5 0.0 2.5 5.0 7.5 10.0 12.5 15.0 I/<I> [PITH_FULL_IMAGE:figures/full_fig_p094_242.png] view at source ↗
Figure 241
Figure 241. Figure 241: Fluctuation analysis of PSR J1825+0004 for the observation on 20210826, with LRFS (top-left), and 2DFS for the on-pulse region (top￾right), leading part (bottom-left) and trailing part (bottom-right) of a mean pulse profile. 4.88. J1825-0208g PSR J1825-0208g was discovered in the FAST GPPS sur￾vey (Han et al. 2021, 2025). This pulsar was observed by FAST on 20221109 for 16 minutes, yielding a rotation pe… view at source ↗
Figure 244
Figure 244. Figure 244: Cross correlation of PSR J1825-0208g from the FAST obser￾vation on 20221109. 0 15 50 100 150 200 Pulse No. I/ bin J1825-1108 20251019 0 10 Longitude ( ) 0 1 I/Ipeak 0 50 E/ E 0 15 250 300 350 400 450 Pulse No. I/ bin J1825-1108 20251019 0 10 Longitude ( ) 0 1 I/Ipeak 0 50 E/ E [PITH_FULL_IMAGE:figures/full_fig_p095_244.png] view at source ↗
Figure 245
Figure 245. Figure 245: Single pulse sequences of PSR J1825-1108 from the FAST observation on 20251019. 4.90. J1826-1131 PSR J1826-1131 was discovered in a survey carried out at Jodrell Bank (Clifton & Lyne 1986). Song et al. (2023) reported modulation parameters for both components. For the leading component, two drift features were identified: P3 = 2.09 ± 0.01 periods and P2 = 16+2 −8 degrees; and P3 = 2.92 ± 0.05 periods and… view at source ↗
Figure 248
Figure 248. Figure 248: On-pulse energy histogram of single pulses of PSR J1826- 1131 from the FAST observation on 20250422. LRFS 0.25 0.50 Norm. Power 10 0 10 Longitude ( ) 0 1 Norm. I L T 0.1 0.2 0.3 0.4 F r e q. ( 1 / P 3 ) J1826-1131 20250422 2DFS: W 0.25 0.50 Norm. Power 250 0 250 Freq. (1/P2) 0 1 Norm. P. 0.1 0.2 0.3 0.4 F r e q. ( 1 / P 3 ) J1826-1131 20250422 2DFS: L 0.25 0.50 Norm. Power 250 0 250 Freq. (1/P2) 0 1 Norm… view at source ↗
Figure 250
Figure 250. Figure 250: Single pulse sequences of PSR J1827-0125g from the FAST observation on 20220329, and a zoomed-in view of pulses No. 505-1005. the trailing profile part exhibits a modulation feature with the centroid frequency of 1/P3 = 0.477 ± 0.002, corresponding to P3 = 2.10±0.01 periods. For the negative drifting behav￾ior of the leading component reported by Song et al. (2023), as well as for the cause of the low-fr… view at source ↗
Figure 249
Figure 249. Figure 249: Fluctuation analysis of PSR J1826-1131 for the observation on 20250422, with LRFS (top-left), and 2DFS for the on-pulse region (top￾right), leading part (bottom-left) and trailing part (bottom-right) of a mean pulse profile. 0 5 10 0 500 1000 1500 2000 2500 Pulse No. I/ bin J1827-0125g 20220329 100 0 Longitude ( ) 0 1 I/Ipeak 0 20 E/ E 0 5 10 600 700 800 900 1000 Pulse No. I/ bin J1827-0125g 20220329 100… view at source ↗
Figure 251
Figure 251. Figure 251: Fluctuation analysis of PSR J1827-0125g for the observation on 20220329, with LRFS (top-left), and 2DFS for the on-pulse region (top￾right), central part (bottom-left) and trailing part (bottom-right) of a mean pulse profile. 4.92. J1829-0500 PSR J1829-0500 was discovered in the Com￾mensal Radio Astronomy FAST Survey (CRAFTS) (http://groups.bao.ac.cn/ism/CRAFTS/). This pulsar was observed by FAST on 2021… view at source ↗
Figure 252
Figure 252. Figure 252: show the emission occasionally brightened. For ev￾ery single pulse, the energy is integrated over the longitude range from -1.58◦ to 8.26◦ , and the resulting energy time series is smoothed with a 5-period moving average. Weak 0 6 12 0 2000 4000 6000 8000 10000 12000 14000 Pulse No. I/ bin J1829-0500 20210222 25 0 25 Longitude ( ) 0 1 I/Ipeak 0 10 E/ E 0 6 12 7600 7800 8000 8200 8400 8600 8800 9000 Pulse… view at source ↗
Figure 253
Figure 253. Figure 253: Histogram of integrated single-pulse energies (longitude -1.58◦ to 8.26◦) for PSR J1829-0500 from the FAST observation on 20210222, with energy values smoothed using a 5-period moving average. 30 20 10 0 10 20 Longitude ( ) 0.0 0.4 0.8 I/Ip e a k J1829-0500 20210222 Aver. Prof. Weak Bright [PITH_FULL_IMAGE:figures/full_fig_p098_253.png] view at source ↗
Figure 254
Figure 254. Figure 254: Mean profiles of weak and bright emission modes of PSR J1829-0500 from the FAST observation on 20210222, normalized by their respective peaks. and bright emission modes of single pulses are then distin￾guished from the energy histogram shown in [PITH_FULL_IMAGE:figures/full_fig_p098_254.png] view at source ↗
Figure 256
Figure 256. Figure 256: Fluctuation analysis of PSR J1830-1135 for the observation on 20260419, with LRFS and 2DFS for the on-pulse region of the mean pulse profile [PITH_FULL_IMAGE:figures/full_fig_p098_256.png] view at source ↗
Figure 259
Figure 259. Figure 259: Fluctuation analysis of PSR J1831+0222g from the FAST observation on 20241107, with LRFS and 2DFS for the central phase region of a mean pulse profile. 0 20 40 50 100 150 200 Pulse No. I/ bin J1831-1141g 20251029 5 0 5 Longitude ( ) 0 1 I/Ipeak 0 50 E/ E [PITH_FULL_IMAGE:figures/full_fig_p099_259.png] view at source ↗
Figure 257
Figure 257. Figure 257: Single pulse sequences of PSR J1831+0222g from the FAST observation on 20241107. 5.0 2.5 0.0 2.5 5.0 7.5 10.0 E/ E 0 20 40 60 80 100 Number J1831+0222g 20241107 1.0 0.5 0.0 0.5 1.0 1.5 2.0 2.5 I/<I> [PITH_FULL_IMAGE:figures/full_fig_p099_257.png] view at source ↗
Figure 258
Figure 258. Figure 258: On-pulse energy histogram of single pulses of PSR J1831+0222g from the FAST observation on 20241107. 158.8 cm−3 pc from the 15-minute observation. Single pulse sequences of the observation on 20241107 in [PITH_FULL_IMAGE:figures/full_fig_p099_258.png] view at source ↗
Figure 260
Figure 260. Figure 260: Single pulse sequence of PSR J1831-1141g from the FAST observation on 20251029 [PITH_FULL_IMAGE:figures/full_fig_p099_260.png] view at source ↗
Figure 261
Figure 261. Figure 261: On-pulse energy histogram of single pulses of PSR J1831- 1141g from the FAST observation on 20251029. 0 10 20 200 400 600 800 1000 Pulse No. I/ bin J1832+0029 20210226 10 0 Longitude ( ) 0 1 I/Ipeak 0 25 E/ E 0 10 20 150 200 250 300 350 Pulse No. I/ bin J1832+0029 20210226 10 0 Longitude ( ) 0 1 I/Ipeak 0 25 E/ E [PITH_FULL_IMAGE:figures/full_fig_p100_261.png] view at source ↗
Figure 263
Figure 263. Figure 263: Fluctuation analysis of PSR J1832+0029 for the observation on 20210226, with LRFS (top-left), and 2DFS for the on-pulse region (top￾right), leading part (bottom-left) and trailing part (bottom-right) of a mean pulse profile. 4.96. J1832+0029 PSR J1832+0029 was discovered in the Parkes multibeam pulsar survey (Lorimer et al. 2006). The pulsar is known as an intermittent pulsar, with off-state time scale f… view at source ↗
Figure 264
Figure 264. Figure 264: Single pulse sequence of PSR J1832+0203g from the FAST observation on 20240422. periods) and 1/P3 = 0.073 ± 0.003 (P3 = 14 ± 1 periods), respectively. 4.97. J1832+0203g PSR J1832+0203g was discovered in the FAST GPPS sur￾vey (Han et al. 2021, 2025). This pulsar was observed by FAST on 20240422 for 5 min￾utes, deriving a rotation period P = 1.2127 s and a dis￾persion measure DM = 226.2 cm−3 pc. The single… view at source ↗
Figure 265
Figure 265. Figure 265: Fluctuation analysis of PSR J1832+0203g for the observation on 20240422, with LRFS (top-left), and 2DFS for the on-pulse region (top￾right), leading part (bottom-left) and trailing part (bottom-right) of a mean pulse profile. modes are distinguished from the on-pulse energy histogram with energy values smoothed using a 5-period moving aver￾age ( [PITH_FULL_IMAGE:figures/full_fig_p101_265.png] view at source ↗
Figure 268
Figure 268. Figure 268: Mean profiles of weak and bright emission modes of PSR J1832-1142g from the FAST observation on 20251201, with each pro￾file normalized separately by its corresponding off-pulse standard deviation σoff . 0 8 16 50 100 150 200 Pulse No. I/ bin J1834+10 20210213 20 0 Longitude ( ) 0 1 I/Ipeak 0 25 E/ E 0 8 16 250 300 350 400 450 Pulse No. I/ bin J1834+10 20210213 20 0 Longitude ( ) 0 1 I/Ipeak 0 25 E/ E [… view at source ↗
Figure 266
Figure 266. Figure 266: Single pulse sequence of PSR J1832-1142g from the FAST observation on 20251201. The right subplot shows the energy variation in￾tegrated over the on-pulse phase region of the mean pulse profile, smoothed with a 5-period moving average. 0 80 160 Number I = 0 J1832-1142g 20251201 2 0 2 4 6 8 10 12 E/ E 2 0 2 4 6 8 10 I/<I> [PITH_FULL_IMAGE:figures/full_fig_p102_266.png] view at source ↗
Figure 269
Figure 269. Figure 269: Single pulse sequences of PSR J1834+10 from the FAST observation on 20210213. For the trailing profile part, the negative drift feature ex￾hibits the centroid frequencies of 1/P3 = 0.337 ± 0.003 and 1/P2 = −31 ± 2, yielding P3 = 2.96 ± 0.02 periods and P2 = −12 ± 1 ◦ . While there is no obvious modulation feature in 2DFS of the data on 20210621. 4.100. J1834-0010 PSR J1834-0010 was discovered by Dewey et… view at source ↗
Figure 270
Figure 270. Figure 270: On-pulse integral energy histogram of single pulses of PSR J1834+10 from the FAST observation on 20210213. LRFS 0.25 0.50 Norm. Power 25 0 Longitude ( ) 0 1 Norm. I L T 0.1 0.2 0.3 0.4 0.5 F r e q. ( 1 / P 3 ) J1834+10 20210213 2DFS: W 0.3 0.6 Norm. Power 100 0 100 Freq. (1/P2) 0 1 Norm. P. 0.1 0.2 0.3 0.4 0.5 F r e q. ( 1 / P 3 ) J1834+10 20210213 2DFS: L 0.3 0.6 Norm. Power 100 0 100 Freq. (1/P2) 0 1 N… view at source ↗
Figure 272
Figure 272. Figure 272: Single pulse sequence of PSR J1834-0010 from the FAST observation on 20190913. LRFS 0.3 0.6 Norm. Power 50 0 50 Longitude ( ) 0 1 Norm. I 0.1 0.2 0.3 0.4 F r e q. ( 1 / P 3 ) J1834-0010 20190913 2DFS: W 0.4 0.8 Norm. Power 50 0 50 Freq. (1/P2) 0 1 Norm. P. 0.1 0.2 0.3 0.4 F r e q. ( 1 / P 3 ) J1834-0010 20190913 [PITH_FULL_IMAGE:figures/full_fig_p103_272.png] view at source ↗
Figure 271
Figure 271. Figure 271: Fluctuation analysis of PSR J1834+10 for the observation on 20210213, with LRFS (top-left), and 2DFS for the on-pulse region (top￾right), leading part (bottom-left) and trailing part (bottom-right) of a mean pulse profile. 0 3 6 0 100 200 300 400 500 600 Pulse No. I/ bin J1834-0010 20190913 50 0 50 Longitude ( ) 0 1 I/Ipeak 0 5 E/ E [PITH_FULL_IMAGE:figures/full_fig_p103_271.png] view at source ↗
Figure 274
Figure 274. Figure 274: Single pulse sequences of PSR J1835+00 from the FAST observation on 20220614. LRFS 0.3 0.6 0.9 Norm. Power 0 10 Longitude ( ) 0 1 Norm. I 0.1 0.2 0.3 0.4 0.5 F r e q. ( 1 / P 3 ) J1835+00 20220614 2DFS: W 0.4 0.8 Norm. Power 200 0 200 Freq. (1/P2) 0 1 Norm. P. 0.1 0.2 0.3 0.4 0.5 F r e q. ( 1 / P 3 ) J1835+00 20220614 [PITH_FULL_IMAGE:figures/full_fig_p104_274.png] view at source ↗
Figure 277
Figure 277. Figure 277: On-pulse energy histograms of single pulses of PSR J1835+0301g from the FAST observation on 20240418. pulsar with a nulling fraction of 2.618% at 327MHz. Song et al. (2023) discovered that the pulsar has drifting behavior of P3 = 37.6 ± 0.7 periods and P2 = 18.5 +0.5 −0.3 degrees. This pulsar was observed by FAST on 20190913 for 5 min￾utes, deriving a rotation period P = 0.5210 s and a disper￾sion measur… view at source ↗
Figure 275
Figure 275. Figure 275: Fluctuation analysis of PSR J1835+00 for the observation on 20220614, with LRFS and 2DFS for the on-pulse region of the mean pulse profile. 0 6 12 50 100 150 200 250 300 350 Pulse No. I/ bin J1835+0301g 20240418 10 0 Longitude ( ) 0 1 I/Ipeak 5 0 5 E/ E [PITH_FULL_IMAGE:figures/full_fig_p104_275.png] view at source ↗
Figure 278
Figure 278. Figure 278: Single pulse sequence of PSR J1835-0112 from the FAST observation on 20211009, and a zoomed-in view of pulses No. 900-1200. LRFS 0.3 0.6 Norm. Power 10 0 10 Longitude ( ) 0 1 Norm. I 0.1 0.2 0.3 0.4 F r e q. ( 1 / P 3 ) J1835-0112 20211009 2DFS: W 0.3 0.6 Norm. Power 100 0 100 Freq. (1/P2) 0 1 Norm. P. 0.1 0.2 0.3 0.4 F r e q. ( 1 / P 3 ) J1835-0112 20211009 [PITH_FULL_IMAGE:figures/full_fig_p105_278.png] view at source ↗
Figure 279
Figure 279. Figure 279: Fluctuation analysis of PSR J1835-0112 from the FAST ob￾servation on 20211009, with LRFS and 2DFS for the on-pulse region of a mean pulse profile. 0 8 16 50 100 150 200 250 300 350 400 Pulse No. I/ bin J1835-0149g 20220407 0 10 Longitude ( ) 0 1 I/Ipeak 0 10 E/ E 0 8 16 300 350 400 450 500 550 600 650 Pulse No. I/ bin J1835-0149g 20220407 0 10 Longitude ( ) 0 1 I/Ipeak 0 10 E/ E [PITH_FULL_IMAGE:figures… view at source ↗
Figure 282
Figure 282. Figure 282: Single pulse sequence of PSR J1835-1106 from the FAST observation on 20250201, and a zoomed-in view of pulses No. 1-300. LRFS 0.4 0.8 Norm. Power 0 20 Longitude ( ) 0 1 Norm. I 0.1 0.2 0.3 0.4 0.5 F r e q. ( 1 / P 3 ) J1835-1106 20250201 2DFS: W 0.4 0.8 Norm. Power 250 0 250 Freq. (1/P2) 0 1 Norm. P. 0.1 0.2 0.3 0.4 0.5 F r e q. ( 1 / P 3 ) J1835-1106 20250201 [PITH_FULL_IMAGE:figures/full_fig_p106_282.png] view at source ↗
Figure 281
Figure 281. Figure 281: Fluctuation analysis of PSR J1835-0149g for the observation on 20220407, with LRFS (top-left), and 2DFS for the on-pulse region (top￾right), leading part (bottom-left) and trailing part (bottom-right) of a mean pulse profile. phenomenon. After the removal of RFI, the nulling fraction of this observation is determined to be 49% from the on-pulse integrated energy histogram ( [PITH_FULL_IMAGE:figures/full… view at source ↗
Figure 283
Figure 283. Figure 283: Fluctuation analysis of PSR J1835-1106 from the FAST ob￾servation on 20250201, with LRFS and 2DFS for the on-pulse region of a mean pulse profile [PITH_FULL_IMAGE:figures/full_fig_p106_283.png] view at source ↗
Figure 284
Figure 284. Figure 284: Single pulse sequence of PSR J1837+0033 from the FAST observation on 20240115, and a zoomed-in view of pulses No. 100-400. LRFS 0.4 0.6 0.8 Norm. Power 0 25 Longitude ( ) 0 1 Norm. I 0.1 0.2 0.3 0.4 F r e q. ( 1 / P 3 ) J1837+0033 20240115 2DFS: W 0.4 0.8 Norm. Power 50 0 50 Freq. (1/P2) 0 1 Norm. P. 0.1 0.2 0.3 0.4 F r e q. ( 1 / P 3 ) J1837+0033 20240115 [PITH_FULL_IMAGE:figures/full_fig_p107_284.png] view at source ↗
Figure 286
Figure 286. Figure 286: Single pulse sequences of PSR J1837+0053 from the FAST observation on 20191009. 0 10 20 30 E/ E 0 25 50 75 100 125 Number J1837+0053 20191009 0 2 4 6 8 10 12 I/<I> [PITH_FULL_IMAGE:figures/full_fig_p107_286.png] view at source ↗
Figure 285
Figure 285. Figure 285: Fluctuation analysis of PSR J1837+0033 from the FAST ob￾servation on 20240115, with LRFS and 2DFS for the on-pulse region of a mean pulse profile. fluctuation spectra are shown in [PITH_FULL_IMAGE:figures/full_fig_p107_285.png] view at source ↗
Figure 289
Figure 289. Figure 289: On-pulse energy histogram of single pulses of PSR J1837+1221 from the FAST observation on 20210701. LRFS 0.3 0.6 Norm. Power 0 10 Longitude ( ) 0 1 Norm. I L T 0.1 0.2 0.3 0.4 F r e q. ( 1 / P 3 ) J1837+1221 20210701 2DFS: L 0.3 0.6 Norm. Power 250 0 250 Freq. (1/P2) 0 1 Norm. P. 0.1 0.2 0.3 0.4 F r e q. ( 1 / P 3 ) J1837+1221 20210701 [PITH_FULL_IMAGE:figures/full_fig_p108_289.png] view at source ↗
Figure 290
Figure 290. Figure 290: Fluctuation analysis of PSR J1837+1221 from the FAST ob￾servation on 20210701, with LRFS and 2DFS for the on-pulse region of a mean pulse profile. negative and positive drift features with constant P2 that are widely distributed over 1/P3 from 0 to 0.5. The centroids of these two features in 1/P2 are at −51 ± 1 (P2 = −7.1 ± 0.1 degrees) and 1/P2 = 53 ± 1 (P2 = 6.9 ± 0.1 degrees), re￾spectively. These ind… view at source ↗
Figure 288
Figure 288. Figure 288: Single pulse sequence of PSR J1837+1221 from the FAST observation on 20210701. 4.105. J1835-1106 PSR J1835-1106 was discovered in the Parkes Southern Pulsar Survey Manchester et al. (1996). A P2-only feature was reported by Song et al. (2023) with P2 = 5.4 +0.3 −0.7 de￾grees. This pulsar was observed by FAST on 20250201 for 6 min￾utes, deriving a rotation period P = 0.1659 s and a disper￾sion measure DM … view at source ↗
Figure 291
Figure 291. Figure 291: Single pulse sequence of PSR J1837-0653 from the FAST observation on 20231014, and a zoomed-in view of pulses No. 500-800. 0 50 100 150 200 250 E/ E 0 100 200 300 Number (× 0.4) J1837-0653 20231014 0 1 2 3 4 5 I/<I> 0 10 0 200 (× 0.4) [PITH_FULL_IMAGE:figures/full_fig_p109_291.png] view at source ↗
Figure 292
Figure 292. Figure 292: On-pulse energy histogram of single pulses of PSR J1837- 0653 from the FAST observation on 20231014. The inset provides a view of the xaxis region from -10 to 18. 400 are displayed in [PITH_FULL_IMAGE:figures/full_fig_p109_292.png] view at source ↗
Figure 294
Figure 294. Figure 294: On-pulse energy histogram of single pulses of PSR J1838+0044g from the FAST observation on 20200203. LRFS 0.3 0.6 Norm. Power 20 0 Longitude ( ) 0 1 Norm. I L T 0.1 0.2 0.3 0.4 F r e q. ( 1 / P 3 ) J1838+0044g 20200203 2DFS: W 0.4 0.8 Norm. Power 250 0 250 Freq. (1/P2) 0 1 Norm. P. 0.1 0.2 0.3 0.4 F r e q. ( 1 / P 3 ) J1838+0044g 20200203 2DFS: L 0.3 0.6 Norm. Power 250 0 250 Freq. (1/P2) 0 1 Norm. P. 0.… view at source ↗
Figure 296
Figure 296. Figure 296: Single pulse sequence of PSR J1838-0014g from the FAST observation on 20220828, and a zoomed-in view of pulses No. 1160-2300. 4.109. J1837-0653 PSR J1837-0653 was discovered during a survey con￾ducted at Jodrell Bank with the MKIA telescope (Clifton & Lyne 1986). This pulsar was observed by FAST on 20231014 for 96 minutes, with a rotation period P = 1.9060 s and a disper￾sion measure DM = 313.3 cm−3 pc d… view at source ↗
Figure 295
Figure 295. Figure 295: Fluctuation analysis of PSR J1838+0044g for the observation on 20200203, with LRFS (top-left), and 2DFS for the on-pulse region (top￾right), leading part (bottom-left) and trailing part (bottom-right) of a mean pulse profile. persion measure DM = 101.0 cm−3 pc from this obser￾vation. The time-phase graph in [PITH_FULL_IMAGE:figures/full_fig_p110_295.png] view at source ↗
Figure 298
Figure 298. Figure 298: Single pulse sequence of PSR J1838-01 from the FAST ob￾servation on 20211018, and a zoomed-in view of pulses No. 4400-4700. LRFS 0.3 0.6 0.9 Norm. Power 5 0 5 Longitude ( ) 0 1 Norm. I 0.1 0.2 0.3 0.4 F r e q. ( 1 / P 3 ) J1838-01 20211018 2DFS: W 0.4 0.8 Norm. Power 200 0 200 Freq. (1/P2) 0 1 Norm. P. 0.1 0.2 0.3 0.4 F r e q. ( 1 / P 3 ) J1838-01 20211018 [PITH_FULL_IMAGE:figures/full_fig_p111_298.png] view at source ↗
Figure 297
Figure 297. Figure 297: Fluctuation analysis of PSR J1838-0014g from the FAST observation on 20220828, with LRFS (top-left), and 2DFS for the on-pulse region (top-right), leading part (bottom-left) and trailing part (bottom-right) of a mean pulse profile. ( [PITH_FULL_IMAGE:figures/full_fig_p111_297.png] view at source ↗
Figure 299
Figure 299. Figure 299: Fluctuation analysis of PSR J1838-01 for the observation on 20211018, with LRFS and 2DFS for the on-pulse region of a mean pulse profile [PITH_FULL_IMAGE:figures/full_fig_p111_299.png] view at source ↗
Figure 300
Figure 300. Figure 300: Single pulse sequence of PSR J1839-0627 from the FAST observation on 20251015, and a zoomed-in view of pulses No. 100-300. the nulling behavior with a nulling fraction of 20±3%. In addition, fluctuation spectra ( [PITH_FULL_IMAGE:figures/full_fig_p112_300.png] view at source ↗
Figure 301
Figure 301. Figure 301: Fluctuation analysis of PSR J1839-0627 from the FAST ob￾servation on 20251015, with LRFS (top-left), and 2DFS for the leading part (top-right), central part (bottom-left) and trailing part (bottom-right) of the mean pulse profile. PSR J1838−01 was discovered from the Parkes Multi￾beam Pulsar Survey Data (Knispel et al. 2013). This pulsar was observed by FAST on 20211018 for 15 minutes, yielding a rotatio… view at source ↗
Figure 304
Figure 304. Figure 304: Fluctuation analysis of PSR J1839-1238 for the observation on 20250422, with LRFS and 2DFS for the on-pulse region of a mean pulse profile. 0 6 12 20 40 60 80 100 120 140 160 Pulse No. I/ bin J1840+0151g 20250620 10 0 10 Longitude ( ) 0 1 I/Ipeak 0 20 E/ E [PITH_FULL_IMAGE:figures/full_fig_p113_304.png] view at source ↗
Figure 302
Figure 302. Figure 302: Single pulse sequences of PSR J1839-1238 from the FAST observation on 20250422. 0 20 40 60 80 100 120 E/ E 0 10 20 30 40 Number (× 0.3) J1839-1238 20250422 0.0 0.5 1.0 1.5 2.0 2.5 3.0 I/<I> [PITH_FULL_IMAGE:figures/full_fig_p113_302.png] view at source ↗
Figure 303
Figure 303. Figure 303: On-pulse energy histogram of single pulses of PSR J1839- 1238 from the FAST observation on 20250422. PSR J1839-0627 was discovered in the Parkes Multibeam Pulsar Survey (Morris et al. 2002). This pulsar was observed by FAST on 20251015 for 15 minutes, driving a rotation period P = 0.4850 s and a dis￾persion measure DM = 92.2 cm−3 pc. The single pulse sequence and a zoomed-in view of pulses No. 100-300 ar… view at source ↗
Figure 305
Figure 305. Figure 305: Single pulse sequence of PSR J1840+0151g from the FAST observation on 20250620 [PITH_FULL_IMAGE:figures/full_fig_p113_305.png] view at source ↗
Figure 308
Figure 308. Figure 308: On-pulse energy histogram of single pulses of PSR J1840- 0141g from the FAST observation on 20220118. 6 4 2 0 2 4 6 Longitude interval ( °) 0.0 0.4 0.8 Norm. corre. coeffi. J1840-0141g 20220118 [PITH_FULL_IMAGE:figures/full_fig_p114_308.png] view at source ↗
Figure 306
Figure 306. Figure 306: Fluctuation analysis of PSR J1840+0151g for the observation on 20250620, with LRFS and 2DFS for the on-pulse region of a mean pulse profile. 0 8 16 10 20 30 40 50 60 70 80 Pulse No. I/ bin J1840-0141g 20220118 5 0 5 Longitude ( ) 0 1 I/Ipeak 0 25 E/ E 0 8 16 70 80 90 100 110 120 130 140 Pulse No. I/ bin J1840-0141g 20220118 5 0 5 Longitude ( ) 0 1 I/Ipeak 0 25 E/ E [PITH_FULL_IMAGE:figures/full_fig_p114… view at source ↗
Figure 307
Figure 307. Figure 307: Single pulse sequences of PSR J1840-0141g from the FAST observation on 20220118. 0 10 20 30 E/ E 0 10 20 30 40 50 Number J1840-0141g 20220118 0 2 4 6 I/<I> [PITH_FULL_IMAGE:figures/full_fig_p114_307.png] view at source ↗
Figure 310
Figure 310. Figure 310: Single pulse sequence of PSR J1840-0626 from the FAST ob￾servation on 20251015. In the right subpanel, the on-pulse energy variation is smoothed over every 3 periods. 0 30 60 Number I = 0 J1840-0626 20251015 0 5 10 15 E/ E 2 0 2 4 6 8 I/<I> [PITH_FULL_IMAGE:figures/full_fig_p115_310.png] view at source ↗
Figure 311
Figure 311. Figure 311: On-pulse energy histogram of single pulses of PSR J1840- 0626 from the FAST observation on 20251015, with energy values smoothed over 3 periods. of 20250620, a rotation period P = 1.7504 s and a disper￾sion measure DM = 69.4 cm−3 pc were determined. The single pulse sequence in [PITH_FULL_IMAGE:figures/full_fig_p115_311.png] view at source ↗
Figure 314
Figure 314. Figure 314: Single pulse sequence of PSR J1841+0912 from the FAST observation on 20230206, and a zoomed-in view of pulses No. 440-920. LRFS 0.3 0.6 Norm. Power 10 0 10 Longitude ( ) 0 1 Norm. I 0.1 0.2 0.3 0.4 F r e q. ( 1 / P 3 ) J1841+0912 20230206 2DFS: W 0.4 0.8 Norm. Power 100 0 100 Freq. (1/P2) 0 1 Norm. P. 0.1 0.2 0.3 0.4 F r e q. ( 1 / P 3 ) J1841+0912 20230206 [PITH_FULL_IMAGE:figures/full_fig_p116_314.png] view at source ↗
Figure 313
Figure 313. Figure 313: Fluctuation analysis of PSR J1840-0809 for the observation on 20250201, with LRFS (top-left), and 2DFS for the on-pulse region (top￾right), leading part (bottom-left) and trailing part (bottom-right) of a mean pulse profile. PSR J1840-0809 was discovered in the Parkes multibeam pulsar survey (Hobbs et al. 2004). This pulsar exhibits sub￾pulse drifting behavior (Song et al. 2023). For the leading componen… view at source ↗
Figure 315
Figure 315. Figure 315: Fluctuation analysis of PSR J1841+0912, with LRFS and 2DFS for the on-pulse region of a mean pulse profile [PITH_FULL_IMAGE:figures/full_fig_p116_315.png] view at source ↗
Figure 316
Figure 316. Figure 316: On-pulse energy histograms of single pulses of PSR J1841+0912 from the FAST observation on 20230206. 0 15 100 200 300 400 Pulse No. I/ bin J1841-0157 20210901 20 0 20 Longitude ( ) 0 1 I/Ipeak 0 25 E/ E [PITH_FULL_IMAGE:figures/full_fig_p117_316.png] view at source ↗
Figure 319
Figure 319. Figure 319: Mean polarization profiles (the top panel) for the two emission modes of PSR J1841-0157 from the FAST observation on 20210901, as well as the averaged PA curves (the bottom panel). 4.119. J1841+0912 PSR J1841+0912 was discovered by Manchester et al. (1978) using observations at the Molonglo Radio Observa￾tory and the Australian National Radio Astronomy Obser￾vatory, Parkes. From previous studies, the nul… view at source ↗
Figure 317
Figure 317. Figure 317: Single pulse sequence of PSR J1841-0157 from the FAST observation on 20210901. drifting properties are estimated from the fluctuation spectra displayed in [PITH_FULL_IMAGE:figures/full_fig_p117_317.png] view at source ↗
Figure 322
Figure 322. Figure 322: Single pulse sequence of PSR J1841-0345 from the FAST observation on 20250304, and a zoomed-in view of pulses No. 200-600. LRFS 0.3 0.6 0.9 Norm. Power 25 0 25 Longitude ( ) 0 1 Norm. I 0.1 0.2 0.3 0.4 F r e q. ( 1 / P 3 ) J1841-0345 20250304 2DFS: W 0.4 0.8 Norm. Power 50 0 50 Freq. (1/P2) 0 1 Norm. P. 0.1 0.2 0.3 0.4 F r e q. ( 1 / P 3 ) J1841-0345 20250304 [PITH_FULL_IMAGE:figures/full_fig_p118_322.png] view at source ↗
Figure 321
Figure 321. Figure 321: On-pulse energy histogram of single pulses of PSR J1841- 0310 from the FAST observation on 20231026. PSR J1841-0157 was discovered in the Parkes multibeam pulsar survey (Hobbs et al. 2004). The pulsar was observed by FAST on 20210901 for 5 min￾utes, deriving a rotation period P = 0.6634 s and a disper￾sion measure DM = 474.7 cm−3 pc from this observation. The single pulse sequence is displayed in [PITH_… view at source ↗
Figure 323
Figure 323. Figure 323: Fluctuation analysis of PSR J1841-0345 for the observation on 20250304, with LRFS and 2DFS for the on-pulse region of a mean pulse profile [PITH_FULL_IMAGE:figures/full_fig_p118_323.png] view at source ↗
Figure 324
Figure 324. Figure 324: Single pulse sequence of PSR J1842+0131g from the FAST observation on 20220720, and a zoomed-in view of pulses No. 210-390. LRFS 0.3 0.6 Norm. Power 0 10 Longitude ( ) 0 1 Norm. I 0.1 0.2 0.3 0.4 F r e q. ( 1 / P 3 ) J1842+0131g 20220720 2DFS: W 0.4 0.8 Norm. Power 250 0 250 Freq. (1/P2) 0 1 Norm. P. 0.1 0.2 0.3 0.4 F r e q. ( 1 / P 3 ) J1842+0131g 20220720 [PITH_FULL_IMAGE:figures/full_fig_p119_324.png] view at source ↗
Figure 325
Figure 325. Figure 325: Fluctuation analysis of PSR J1842+0131g for the observation on 20220720, with LRFS and 2DFS for the on-pulse region of a mean pulse profile. ing component seems not to be obvious in the average pulse profile in the weak mode ( [PITH_FULL_IMAGE:figures/full_fig_p119_325.png] view at source ↗
Figure 326
Figure 326. Figure 326: The left sub-panel displays single-pulse sequences of PSR J1842-0153 from the FAST observation on 20230328. The central sub-panel shows the variation of starting longitude of single pulses (grey line) and the smoothed line (blue line), with orange splitting dashed line from [PITH_FULL_IMAGE:figures/full_fig_p120_326.png] view at source ↗
Figure 330
Figure 330. Figure 330: On-pulse energy histogram of PSR J1842-0153 from the FAST observation on 20230328. 0 20 40 Counts Ne=22(20) 0 30 60 90 Periods for emission (P0) 2 5 7 P erio d s f or n ulls (P 0) NE EN 0 100 Counts Nn=2(1) [PITH_FULL_IMAGE:figures/full_fig_p121_330.png] view at source ↗
Figure 327
Figure 327. Figure 327: Fluctuation analysis of PSR J1842-0153 from the FAST ob￾servation on 20230328, with LRFS and 2DFS for the on-pulse region of a mean pulse profile. 8 6 4 2 0 2 Longitude ( ) 0 100 200 300 Number Logisplit=-3.74 J1842-0153 20230328 [PITH_FULL_IMAGE:figures/full_fig_p121_327.png] view at source ↗
Figure 331
Figure 331. Figure 331: Distribution of period numbers for continuous nulling PN against period numbers for adjacent pulses PE of PSR J1842-0153 observed by FAST on 20201218, as well as the duration histograms for the emission and null shown in the top and right panels, respectively. 8 6 4 2 0 2 Left limit longitude ( ) 0 200 400 600 Number J1842-0153 20230328 Emission Null [PITH_FULL_IMAGE:figures/full_fig_p121_331.png] view at source ↗
Figure 329
Figure 329. Figure 329: Duration periods of emission in the earlier longitude re￾gion (green) and later longitude region (purple), that are distinguished from [PITH_FULL_IMAGE:figures/full_fig_p121_329.png] view at source ↗
Figure 333
Figure 333. Figure 333: Single pulse sequences of PSR J1842-0800 from the FAST observation on 20251015. 0 10 20 30 E/ E 0 50 100 150 200 Number J1842-0800 20251015 1 0 1 2 3 4 5 6 I/<I> [PITH_FULL_IMAGE:figures/full_fig_p122_333.png] view at source ↗
Figure 334
Figure 334. Figure 334: On-pulse integral energy histogram of single pulses of PSR J1842-0800 from the FAST observation on 20251015. This pulsar also has nulling behavior. The nulling frac￾tion is estimated to be 6.1% from the intensity histogram in [PITH_FULL_IMAGE:figures/full_fig_p122_334.png] view at source ↗
Figure 337
Figure 337. Figure 337: Cross correlation of PSR J1843+0526g from the FAST obser￾vation on 20230218. 0 5 10 20 40 60 80 100 120 140 Pulse No. I/ bin J1843+2024 20210116 5 0 5 Longitude ( ) 0 1 I/Ipeak 0 10 E/ E [PITH_FULL_IMAGE:figures/full_fig_p123_337.png] view at source ↗
Figure 339
Figure 339. Figure 339: Fluctuation analysis of PSR J1843+2024 from the FAST ob￾servation on 20210116, with LRFS (top-left), and 2DFS for the on-pulse region (top-right), leading part (bottom-left) and trailing part (bottom-right) of a mean pulse profile. pulsar is found to exhibit nulling and subpulse drifting be￾haviors. In particular, the emission phase regions of single pulses vary instead of remaining stable. The nulling f… view at source ↗
Figure 342
Figure 342. Figure 342: Fluctuation spectra of PSR J1843-0050 from the FAST ob￾servation on 20211009, with LRFS and 2DFS for the on-pulse region of a mean pulse profile. 0 5 10 50 100 150 200 250 300 350 400 Pulse No. I/ bin J1843-0127g 20220202 10 0 10 Longitude ( ) 0 1 I/Ipeak 0 10 E/ E [PITH_FULL_IMAGE:figures/full_fig_p124_342.png] view at source ↗
Figure 340
Figure 340. Figure 340: Single pulse sequences of PSR J1843-0050 from the FAST observation on 20211009. 0 10 20 30 E/ E 0 50 100 150 Number (× 0.4) J1843-0050 20211009 0.5 0.0 0.5 1.0 1.5 2.0 2.5 3.0 I/<I> [PITH_FULL_IMAGE:figures/full_fig_p124_340.png] view at source ↗
Figure 341
Figure 341. Figure 341: On-pulse integral energy histogram of single pulses of PSR J1843-0050 from the FAST observation on 20211009. PSR J1843+2024 was discovered by Zepka et al. (1996). For two components of the pulsar, Song et al. (2023) reported drifting parameters with values of P3 = 10.4 ± 0.5 periods, P2 = 2.3 +1 −0.2 degrees and P3 = 10.5 ± 0.3 periods, P2 = 3 +2 −1 degrees, respectively. This pulsar was observed by FAST… view at source ↗
Figure 343
Figure 343. Figure 343: Single pulse sequence of PSR J1843-0127g from the FAST observation on 20220202 [PITH_FULL_IMAGE:figures/full_fig_p124_343.png] view at source ↗
Figure 344
Figure 344. Figure 344: On-pulse energy histogram of single pulses of PSR J1843- 0127g from the FAST observation on 20220202. 0 4 8 0 500 1000 1500 2000 2500 3000 Pulse No. I/ bin J1843-0137 20230508 20 0 20 Longitude ( ) 0 1 I/Ipeak 0 10 E/ E 0 4 8 1100 1200 1300 1400 Pulse No. I/ bin J1843-0137 20230508 20 0 20 Longitude ( ) 0 1 I/Ipeak 0 10 E/ E [PITH_FULL_IMAGE:figures/full_fig_p125_344.png] view at source ↗
Figure 345
Figure 345. Figure 345: Single pulse sequence of PSR J1843-0137 from the FAST observation on 20230508, and a zoomed-in view of pulses No. 1000-1500. 4.128. J1843-0050 PSR J1843-0050 was discovered in the Parkes Multibeam Pulsar Survey (Morris et al. 2002). This pulsar was observed by FAST on 20211009 and 20241224, each for 15 minutes. From the observation on 20211009, a rotation period and a dispersion measure are P = 0.7827 s … view at source ↗
Figure 348
Figure 348. Figure 348: On-pulse energy histogram of single pulses of PSR J1843- 0521 from the FAST observation on 20250821. measure DM = 512.3 cm−3 pc. Single pulse sequences of this data shown in [PITH_FULL_IMAGE:figures/full_fig_p126_348.png] view at source ↗
Figure 351
Figure 351. Figure 351: Fluctuation analysis of PSR J1843-0757 for the observation on 20251015, with LRFS and 2DFS for the trailing phase region of a mean pulse profile. PSR J1843-0127g was discovered in the FAST GPPS sur￾vey (Han et al. 2021, 2025). This pulsar was observed by FAST on 20220202 for 15 minutes, deriving a rotation period P = 2.1648 s and a dis￾persion measure DM = 449.0 cm−3 pc. The single pulse sequence in Figu… view at source ↗
Figure 349
Figure 349. Figure 349: Single pulse sequences of PSR J1843-0757 from the FAST observation on 20251015. 4.129. J1843-0127g 0 10 20 30 40 50 E/ E 0 50 100 150 Number J1843-0757 20251015 0 2 4 6 8 10 I/<I> [PITH_FULL_IMAGE:figures/full_fig_p126_349.png] view at source ↗
Figure 352
Figure 352. Figure 352: , and 2DFS of the leading and trailing parts in the profiles are displayed in [PITH_FULL_IMAGE:figures/full_fig_p127_352.png] view at source ↗
Figure 353
Figure 353. Figure 353: Fluctuation analysis of PSR J1844+00 from the observation on 20211008 and 20211222, with LRFS and 2DFS for the on-pulse region of a mean pulse profile. 0.120 ± 0.004 (P3 = 8.3 ± 0.3 periods). However, the ∼2- period feature is not obvious in the 2DFS of the leading com￾ponent from the observation on 20211222. The modulation features of the observation on 20210713 are consistent with those on 20211008. Th… view at source ↗
Figure 354
Figure 354. Figure 354: Single pulse sequences of PSR J1844+0315g from the FAST observation on 20230609 [PITH_FULL_IMAGE:figures/full_fig_p128_354.png] view at source ↗
Figure 355
Figure 355. Figure 355: Mean profiles of weak and bright emission modes of PSR J1844+0315g from the FAST observation on 20230609, normalized by their respective peaks. 0 10 20 20 40 60 80 100 Pulse No. I/ bin J1844-0433 20210219 10 0 10 Longitude ( ) 0 1 I/Ipeak 0 50 E/ E [PITH_FULL_IMAGE:figures/full_fig_p129_355.png] view at source ↗
Figure 358
Figure 358. Figure 358: Fluctuation analysis of PSR J1844-0433 for the observation on 20210219, with LRFS and 2DFS for the leading phase region of a mean pulse profile. 4.135. J1844-0433 PSR J1844-0433 was discovered by the MKIA telescope (Clifton et al. 1987). Weltevrede et al. (2006) reported the negative drift behavior at 21 cm with P3 = 8.5 ± 0.1 periods and P2 = −13+11 5 degrees. Song et al. (2023) presented the drift peri… view at source ↗
Figure 356
Figure 356. Figure 356: Single pulse sequence of PSR J1844-0433 from the FAST observation on 20210219. are shown in [PITH_FULL_IMAGE:figures/full_fig_p129_356.png] view at source ↗
Figure 361
Figure 361. Figure 361: Fluctuation analysis of PSR J1845+0623 for the observation on 20210619, with LRFS and 2DFS for the leading phase region of a mean pulse profile. 0.0 2.5 5.0 50 100 150 200 250 300 350 400 Pulse No. I/ bin J1845-0229Ag 20220907 50 0 50 Longitude ( ) 0 1 I/Ipeak 0 25 E/ E [PITH_FULL_IMAGE:figures/full_fig_p130_361.png] view at source ↗
Figure 359
Figure 359. Figure 359: Single pulse sequences of PSR J1845+0623 from the FAST observation on 20210619. 0 20 40 60 E/ E 0 5 10 15 20 Number (× 0.2) J1845+0623 20210619 0.0 0.5 1.0 1.5 2.0 I/<I> [PITH_FULL_IMAGE:figures/full_fig_p130_359.png] view at source ↗
Figure 360
Figure 360. Figure 360: On-pulse energy histogram of single pulses of PSR J1845+0623 from the FAST observation on 20210619. 4.136. J1845+0623 PSR J1845+0623 was discovered in the Parkes Multibeam Pulsar Survey (Lorimer et al. 2006). Song et al. (2023) re￾ported this pulsar with drifting behavior of P3 = 2.35(8) periods and P2 = 23+24 −17 degrees. This pulsar was observed by FAST for 5 minutes, with a rotation period P = 1.4216 … view at source ↗
Figure 362
Figure 362. Figure 362: Single pulse sequence of PSR J1845-0229Ag from the FAST observation on 20220907. 2DFS of the leading component ( [PITH_FULL_IMAGE:figures/full_fig_p130_362.png] view at source ↗
Figure 365
Figure 365. Figure 365: On-pulse energy histogram of single pulses of PSR J1845- 0316g from the FAST observation on 20250616. 0 20 40 0 500 1000 1500 2000 2500 3000 3500 Pulse No. I/ bin J1845-0743 20250321 25 0 25 Longitude ( ) 0 1 I/Ipeak 0 250 E/ E 0 20 40 3025 3050 3075 3100 3125 3150 3175 Pulse No. I/ bin J1845-0743 20250321 25 0 25 Longitude ( ) 0 1 I/Ipeak 0 250 E/ E [PITH_FULL_IMAGE:figures/full_fig_p131_365.png] view at source ↗
Figure 363
Figure 363. Figure 363: Fluctuation analysis of PSR J1845-0229Ag from the observa￾tion on 20220907, with LRFS and 2DFS for the on-pulse region of a mean pulse profile. 0 3 100 200 300 400 500 600 700 800 Pulse No. I/ bin J1845-0316g 20250616 50 0 50 Longitude ( ) 0 1 I/Ipeak 0 10 E/ E 0 3 600 650 700 750 Pulse No. I/ bin J1845-0316g 20250616 50 0 50 Longitude ( ) 0 1 I/Ipeak 0 10 E/ E [PITH_FULL_IMAGE:figures/full_fig_p131_363.png] view at source ↗
Figure 366
Figure 366. Figure 366: Single pulse sequence of PSR J1845-0743 from the FAST observation on 20240321, and a zoomed-in view of pulses No. 3000-3200. itive drift feature with the centroid frequencies of 1/P3 = 0.413 ± 0.002 and 1/P2 = 113 ± 12, which correspond to P3 = 2.42 ± 0.01 periods and P2 = 3.2 ± 0.4 degrees. Fur￾ther observations are needed for the causes of the intensity decrease and the low-frequency modulation in LRFS… view at source ↗
Figure 364
Figure 364. Figure 364: Single pulse sequence of PSR J1845-0316g from the FAST observation on 20250616, and a zoomed-in view of pulses No. 550-800. 4 2 0 2 4 6 8 E/ E 0 50 100 150 200 Number J1845-0316g 20250616 10 5 0 5 10 15 I/<I> [PITH_FULL_IMAGE:figures/full_fig_p131_364.png] view at source ↗
Figure 369
Figure 369. Figure 369: On-pulse energy histogram of single pulses of PSR J1846+0657g from the FAST observation on 20240905. sion measure DM = 848.0 cm−3 pc. The single pulse se￾quence in [PITH_FULL_IMAGE:figures/full_fig_p132_369.png] view at source ↗
Figure 367
Figure 367. Figure 367: Fluctuation analysis of PSR J1845-0743 from the observation on 20240321, with LRFS and 2DFS for the on-pulse region of a mean pulse profile. 0 10 20 25 50 75 100 125 150 175 Pulse No. I/ bin J1846+0657g 20240905 5 0 5 Longitude ( ) 0 1 I/Ipeak 0 25 E/ E 0 10 20 225 250 275 300 325 350 375 400 Pulse No. I/ bin J1846+0657g 20240905 5 0 5 Longitude ( ) 0 1 I/Ipeak 0 25 E/ E [PITH_FULL_IMAGE:figures/full_fi… view at source ↗
Figure 370
Figure 370. Figure 370: Single pulse sequence of PSR J1846-0211g from the FAST observation on 20220902. 4.138. J1845-0316g PSR J1845-0316g was discovered in the FAST GPPS sur￾vey (Han et al. 2021, 2025) [PITH_FULL_IMAGE:figures/full_fig_p132_370.png] view at source ↗
Figure 371
Figure 371. Figure 371: Fluctuation analysis of PSR J1846-0211g from the observa￾tion on 20220902, with LRFS and 2DFS for the on-pulse region of a mean pulse profile. This pulsar was observed by FAST on 20250616 and 20250829, both for 15 minutes. From the data of 20250616, a rotation period of P = 1.0822 s and a dispersion measure of DM = 913.0 cm−3 pc were derived. The single pulse sequence and a zoomed-in view of pulses No. 5… view at source ↗
Figure 372
Figure 372. Figure 372: Single pulse sequences of PSR J1846-07492 from the FAST observation on 20250321. LRFS 0.25 0.50 Norm. Power 20 0 20 Longitude ( ) 0 1 Norm. I 0.1 0.2 0.3 0.4 0.5 F r e q. ( 1 / P 3 ) J1846-07492 20250321 2DFS: W 0.3 0.6 Norm. Power 200 0 200 Freq. (1/P2) 0 1 Norm. P. 0.1 0.2 0.3 0.4 0.5 F r e q. ( 1 / P 3 ) J1846-07492 20250321 [PITH_FULL_IMAGE:figures/full_fig_p133_372.png] view at source ↗
Figure 373
Figure 373. Figure 373: Fluctuation analysis of PSR J1846-07492 from the FAST observation on 20250321, with LRFS and 2DFS for the on-pulse region of the mean pulse profile [PITH_FULL_IMAGE:figures/full_fig_p133_373.png] view at source ↗
Figure 374
Figure 374. Figure 374: Single pulse sequences of PSR J1847+0614g from the FAST observation on 20210220. LRFS 0.3 0.6 Norm. Power 10 0 10 Longitude ( ) 0 1 Norm. I 0.1 0.2 0.3 0.4 F r e q. ( 1 / P 3 ) J1847+0614g 20210220 2DFS: W 0.4 0.8 Norm. Power 250 0 250 Freq. (1/P2) 0 1 Norm. P. 0.1 0.2 0.3 0.4 F r e q. ( 1 / P 3 ) J1847+0614g 20210220 [PITH_FULL_IMAGE:figures/full_fig_p134_374.png] view at source ↗
Figure 376
Figure 376. Figure 376: Single pulse sequence of PSR J1847-0048g from the FAST observation on 20211113, and a zoomed-in view of pulses No. 300-600. 4.142. J1846-07492 PSR J1846-07492 was discovered in data from the Parkes Multi-beam Pulsar Survey (Keith et al. 2009). Song et al. (2023) reported two drift features: one with P3 = 2.7 ± 0.4 periods and P2 = −98+89 −35 degrees, and the other with P3 = 21 ± 9 periods and P2 = −83+48… view at source ↗
Figure 375
Figure 375. Figure 375: Fluctuation analysis of PSR J1847+0614g from the FAST observation on 20210220, with LRFS and 2DFS for the on-pulse region of a mean pulse profile. PSR J1846-0211g was discovered in the FAST GPPS sur￾vey (Han et al. 2021, 2025). This pulsar was observed by FAST on 20220902 for 15 minutes, yielding a rotation period P = 0.7882 s and a dispersion measure DM = 848.7 cm−3 pc. The single pulse sequence and flu… view at source ↗
Figure 377
Figure 377. Figure 377: Fluctuation analysis of PSR J1847-0048g for the observation on 20211113, with LRFS and 2DFS for the on-pulse region of a mean pulse profile. 1/P3 = 0.38 ± 0.01 and 1/P2 = −41 ± 2, corresponding to P3 = 2.7 ± 0.1 periods and P2 = −8.8 ± 0.4 degrees. The low-frequency modulation feature has the centroid at 1/P3 = 0.029 ± 0.002, yielding P3 = 34 ± 2 periods. 4.143. J1847+0614g PSR J1847+0614g was discovered… view at source ↗
Figure 378
Figure 378. Figure 378: Single pulse sequences of PSR J1847-0402 from the FAST observation on 20221227. 4.145. J1847-0402 PSR J1847-0402 was discovered by Davies et al. (1970) using the Mark I radio telescope at Jodrell Bank. Weltevrede et al. (2006) reported the drifting behavior at 21 cm with P3 = 12 ± 1 periods and P2 = 80+70 −45 degrees. At 1280 MHz, Song et al. (2023) presented two modulation features for two components: a… view at source ↗
Figure 380
Figure 380. Figure 380: Single pulse sequences of PSR J1848+0127g from the FAST observation on 20230306. 0 150 300 Number I = 0 J1848+0127 20230306 10 0 10 20 30 E/ E 10 0 10 20 30 I/<I> [PITH_FULL_IMAGE:figures/full_fig_p136_380.png] view at source ↗
Figure 379
Figure 379. Figure 379: Fluctuation analysis of PSR J1847-0402 from the FAST ob￾servation on 20221227, with LRFS (top-left), and 2DFS for the on-pulse region (top-right), leading part (bottom-left) and trailing part (bottom-right) of a mean pulse profile. 4.146. J1848+0127g PSR J1848+0127g was discovered in the FAST GPPS sur￾vey (Han et al. 2021, 2025). This pulsar was observed by FAST on 20230306 for 17 minutes, deriving a rot… view at source ↗
Figure 382
Figure 382. Figure 382: Mean polarization profiles (the top panel) for weak and bright emission modes of PSR J1848+0127g observed on 20230306, as well as the averaged PA curves (the bottom panel). 0 15 30 0 500 1000 1500 2000 2500 3000 3500 Pulse No. I/ bin J1848+1245g 20210714 25 0 Longitude ( ) 0 1 I/Ipeak 0 25 E/ E 0 15 30 50 100 150 200 250 300 350 Pulse No. I/ bin J1848+1245g 20210714 25 0 Longitude ( ) 0 1 I/Ipeak 0 25 E/… view at source ↗
Figure 383
Figure 383. Figure 383: Single pulse sequence of PSR J1848+1245g from the FAST observation on 20210714, and a zoomed-in view of pulses No. 1-400. 8.8 ± 0.1 ◦ ), and the temporally low-frequency modulation feature of 1/P3 = 0.059 ± 0.001 (P3 = 17.0 ± 0.2 periods). 4.148. J1848-0123 PSR J1848-0123 was reported with the drifting phe￾nomenon by Hankins & Wolszczan (1987) at 1414 MHz and LRFS 0.3 0.6 Norm. Power 25 0 Longitude ( ) 0… view at source ↗
Figure 387
Figure 387. Figure 387: Single pulse sequence of PSR J1849+0127 from the FAST observation on 20231022, and a zoomed-in view of pulses No. 800-1200. LRFS 0.3 0.6 0.9 Norm. Power 0 25 Longitude ( ) 0 1 Norm. I 0.1 0.2 0.3 0.4 F r e q. ( 1 / P 3 ) J1849+0127 20231022 2DFS: W 0.3 0.6 Norm. Power 100 0 100 Freq. (1/P2) 0 1 Norm. P. 0.1 0.2 0.3 0.4 F r e q. ( 1 / P 3 ) J1849+0127 20231022 [PITH_FULL_IMAGE:figures/full_fig_p138_387.png] view at source ↗
Figure 386
Figure 386. Figure 386: Fluctuation analysis of PSR J1848-0123 for the observation on 20210816, with LRFS (top-left), and 2DFS for the leading part (top￾right), central part (bottom-left) and trailing part (bottom-right) of a mean pulse profile. Weltevrede et al. (2006) at 21 cm. In addition, Basu et al. (2016) reported amplitude modulation at 618 MHz. This pulsar was observed by FAST on 20210816 for 5 min￾utes, deriving a rota… view at source ↗
Figure 388
Figure 388. Figure 388: Fluctuation analysis of PSR J1849+0127 from the FAST ob￾servation on 20231022, with LRFS and 2DFS for the on-pulse region of a mean pulse profile [PITH_FULL_IMAGE:figures/full_fig_p138_388.png] view at source ↗
Figure 391
Figure 391. Figure 391: Mean polarization profiles (the top panel) for weak and bright emission modes of PSR J1849+0225g observed on 20230309, as well as the averaged PA curves (the bottom panel). 0 6 12 100 200 300 400 500 600 700 Pulse No. I/ bin J1849+0340g 20230309 0 20 Longitude ( ) 0 1 I/Ipeak 0 10 E/ E 0 6 12 800 900 1000 1100 1200 1300 1400 Pulse No. I/ bin J1849+0340g 20230309 0 20 Longitude ( ) 0 1 I/Ipeak 0 10 E/ E … view at source ↗
Figure 389
Figure 389. Figure 389: Single pulse sequences of PSR J1849+0225g from the FAST observation on 20230309. 0 150 300 Number I = 0 J1849+0225g 20230309 0 10 20 30 40 E/ E 2.5 0.0 2.5 5.0 7.5 10.0 12.5 15.0 I/<I> [PITH_FULL_IMAGE:figures/full_fig_p139_389.png] view at source ↗
Figure 390
Figure 390. Figure 390: On-pulse energy histogram of single pulses of PSR J1849+0225g from the FAST observation on 20230309. observations are required for the property of phase modula￾tion. 4.149. J1849+0127 PSR J1849+0127 was discovered in the Parkes Multibeam Pulsar Survey (Morris et al. 2002). This pulsar was observed by FAST on 20231022 for 30 minutes, with a rotation period P = 0.5422 s and a disper￾sion measure DM = 203.0… view at source ↗
Figure 393
Figure 393. Figure 393: On-pulse energy histogram of single pulses of PSR J1849+0340g from the FAST observation on 20230309. LRFS 0.3 0.6 Norm. Power 0 20 Longitude ( ) 0 1 Norm. I 0.1 0.2 0.3 0.4 F r e q. ( 1 / P 3 ) J1849+0340g 20230309 2DFS: W 0.3 0.6 Norm. Power 200 0 200 Freq. (1/P2) 0 1 Norm. P. 0.1 0.2 0.3 0.4 F r e q. ( 1 / P 3 ) J1849+0340g 20230309 [PITH_FULL_IMAGE:figures/full_fig_p140_393.png] view at source ↗
Figure 395
Figure 395. Figure 395: Single pulse sequences of PSR J1850+0026 from the FAST observation on 20200119. This pulsar was observed by FAST on 20230309 for 41 minutes, deriving a rotation period P = 1.6666 s and a dispersion measure DM = 350.6 cm−3 pc. Single pulse sequences of this observation are shown in [PITH_FULL_IMAGE:figures/full_fig_p140_395.png] view at source ↗
Figure 397
Figure 397. Figure 397: Single pulse sequences of PSR J1850+0824g from the FAST observation on 20240905. LRFS 0.3 0.6 Norm. Power 10 0 10 Longitude ( ) 0 1 Norm. I 0.1 0.2 0.3 0.4 F r e q. ( 1 / P 3 ) J1850+0824g 20240905 2DFS: W 0.4 0.8 Norm. Power 250 0 250 Freq. (1/P2) 0 1 Norm. P. 0.1 0.2 0.3 0.4 F r e q. ( 1 / P 3 ) J1850+0824g 20240905 [PITH_FULL_IMAGE:figures/full_fig_p141_397.png] view at source ↗
Figure 396
Figure 396. Figure 396: Fluctuation analysis of PSR J1850+0026 from the FAST ob￾servation on 20200119, with LRFS (top-left), and 2DFS for the on-pulse region (top-right), leading part (bottom-left) and trailing part (bottom-right) of a mean pulse profile. corresponding to drifting parameters of P3 = 12.4 ± 0.2 pe￾riods and P2 = −57 ± 7 ◦ . In 2DFS of the trailing compo￾nent, two negatively drifting features are related to diffe… view at source ↗
Figure 398
Figure 398. Figure 398: Fluctuation analysis of PSR J1850+0824g from the FAST observation on 20240905, with LRFS and 2DFS for the on-pulse region of a mean pulse profile [PITH_FULL_IMAGE:figures/full_fig_p141_398.png] view at source ↗
Figure 399
Figure 399. Figure 399: Single pulse sequence of PSR J1850-0006 from the FAST observation on 20200821. 0 5 10 15 20 E/ E 0 20 40 60 80 100 Number J1850-0006 20200821 0 2 4 6 I/<I> [PITH_FULL_IMAGE:figures/full_fig_p142_399.png] view at source ↗
Figure 402
Figure 402. Figure 402: On-pulse energy histogram of single pulses of PSR J1851+0241 from the FAST observation on 20200529. 4.154. J1850-0006 PSR J1850-0006 was discovered by Keith et al. (2009) us￾ing data of the Parkes Multi-beam Pulsar Survey. The pulsar was observed by FAST on 20200821 for 15 minutes, with a rotation period P = 2.1917 s and a disper￾sion measure DM = 653.0 cm−3 pc from this observation. The single pulse seq… view at source ↗
Figure 403
Figure 403. Figure 403: Cross correlation of PSR J1851+0241 from the FAST obser￾vation on 20200529. 0 4 8 20 40 60 80 100 120 Pulse No. I/ bin J1851+0501g 20220505 20 0 Longitude ( ) 0 1 I/Ipeak 0 10 E/ E [PITH_FULL_IMAGE:figures/full_fig_p143_403.png] view at source ↗
Figure 405
Figure 405. Figure 405: Fluctuation analysis of PSR J1851+0501g for the observation on 20220505, with LRFS (top-left), and 2DFS for the on-pulse region (top￾right), leading part (bottom-left) and trailing part (bottom-right) of a mean pulse profile. drifting parameters are estimated to be D = 0.9±0.7 degrees per period and P2 = 1.7 ± 0.2 ◦ . 4.156. J1851+0501g PSR J1851+0501g was discovered in the FAST GPPS sur￾vey (Han et al. … view at source ↗
Figure 406
Figure 406. Figure 406: Single pulse sequences of PSR J1851+1259 from the FAST observation on 20210606. 0 50 100 150 200 E/ E 0 10 20 30 40 Number (× 0.6) J1851+1259 20210606 0 1 2 3 4 5 I/<I> [PITH_FULL_IMAGE:figures/full_fig_p144_406.png] view at source ↗
Figure 407
Figure 407. Figure 407: On-pulse energy histogram of single pulses of PSR J1851+1259 from the FAST observation on 20210111. periods), and 1/P2 = 52 ± 9 and 46 ± 6 (P2 = 7 ± 1 ◦ and 8±1 ◦ ) for the leading and trailing components, respectively. 4.157. J1851+1259 PSR was discovered by the 92-m telescope at Green Bank (Stokes et al. 1985). This pulsar has been reported to have the nulling phenomenon in previous studies. The nullin… view at source ↗
Figure 409
Figure 409. Figure 409: Fluctuation analysis of PSR J1851-0029 for the observation on 20230508, with LRFS and 2DFS for the on-pulse region of a mean pulse profile [PITH_FULL_IMAGE:figures/full_fig_p144_409.png] view at source ↗
Figure 411
Figure 411. Figure 411: On-pulse energy histograms of single pulses of PSR J1851- 0053 from the FAST observation on 20210822 and 20210903. sion measure DM = 340.8 cm−3 pc. Single pulse sequences of this observation, shown in [PITH_FULL_IMAGE:figures/full_fig_p145_411.png] view at source ↗
Figure 410
Figure 410. Figure 410: Single pulse sequences of PSR J1851-0053 from the FAST observation on 20210903. 0 25 50 75 100 125 150 E/ E 0 20 40 60 80 Number J1851-0053 20210822 0 1 2 3 4 I/<I> 0 10 20 30 40 50 60 E/ E 0 50 100 150 Number J1851-0053 20210903 0 1 2 3 4 5 6 I/<I> [PITH_FULL_IMAGE:figures/full_fig_p145_410.png] view at source ↗
Figure 413
Figure 413. Figure 413: Single pulse sequences of PSR J1851-0114 from the FAST observations on 20210923 and 20211005. 5 0 5 10 15 20 25 30 E/ E 0 25 50 75 100 125 Number J1851-0114 20210923 1 0 1 2 3 4 I/<I> 5 0 5 10 15 20 E/ E 0 50 100 150 Number J1851-0114 20211005 2 0 2 4 6 I/<I> [PITH_FULL_IMAGE:figures/full_fig_p146_413.png] view at source ↗
Figure 412
Figure 412. Figure 412: Fluctuation analysis of PSR J1851-0053 from the FAST ob￾servation on 20210822 and 20210903, with LRFS and 2DFS for the on-pulse region of a mean pulse profile. 1.4092 s and a dispersion measure DM = 24.5 cm−3 pc. Single pulse sequences of two observations on 20210822 and 20210903 are shown in [PITH_FULL_IMAGE:figures/full_fig_p146_412.png] view at source ↗
Figure 414
Figure 414. Figure 414: On-pulse energy histograms of single pulses of PSR J1851- 0114 from the FAST observations on 20210923 and 20211005 [PITH_FULL_IMAGE:figures/full_fig_p146_414.png] view at source ↗
Figure 417
Figure 417. Figure 417: Single pulse sequence of PSR J1852-0033g from the FAST observation on 20230508, and a zoomed-in view of pulses No. 1-350. LRFS 0.25 0.50 0.75 Norm. Power 0 10 Longitude ( ) 0 1 Norm. I 0.1 0.2 0.3 0.4 F r e q. ( 1 / P 3 ) J1852-0033g 20230508 2DFS: W 0.4 0.8 Norm. Power 250 0 250 Freq. (1/P2) 0 1 Norm. P. 0.1 0.2 0.3 0.4 F r e q. ( 1 / P 3 ) J1852-0033g 20230508 [PITH_FULL_IMAGE:figures/full_fig_p147_417.png] view at source ↗
Figure 416
Figure 416. Figure 416: On-pulse energy histogram of single pulses of PSR J1852+0421g from the FAST observation on 20220202. 1/P2 = 84±2 (P2 = 4.3±0.1 ◦ ) on 20210903. Single-pulse features are consistent across observations. Longer observa￾tions are necessary for detailed drifting analysis. 4.160. J1851-0114 PSR J1851-0114 was discovered by Lorimer et al. (2006) in the Parkes Multibeam Pulsar Survey. This pulsar was observed b… view at source ↗
Figure 418
Figure 418. Figure 418: Fluctuation analysis of PSR J1852-0033g from the FAST observation on 20230508, with LRFS and 2DFS for the on-pulse region of a mean pulse profile [PITH_FULL_IMAGE:figures/full_fig_p147_418.png] view at source ↗
Figure 421
Figure 421. Figure 421: Fluctuation analysis of PSR J1852-0947 from the FAST ob￾servation on 20251019, with LRFS and 2DFS for the on-pulse region of a mean pulse profile. 0 10 20 50 100 150 200 Pulse No. I/ bin J1853+0029 20200920 20 0 Longitude ( ) 0 1 I/Ipeak 0 25 E/ E 0 10 20 250 300 350 400 450 Pulse No. I/ bin J1853+0029 20200920 20 0 Longitude ( ) 0 1 I/Ipeak 0 10 E/ E [PITH_FULL_IMAGE:figures/full_fig_p148_421.png] view at source ↗
Figure 420
Figure 420. Figure 420: On-pulse energy histogram of single pulses of PSR J1852- 0947 from the FAST observation on 20251019. DM = 432.8 cm−3 pc. Single pulses sequences of these two observations are displayed in [PITH_FULL_IMAGE:figures/full_fig_p148_420.png] view at source ↗
Figure 422
Figure 422. Figure 422: Single pulse sequences of PSR J1853+0029 from the FAST observation on 20200920. In the right subpanel, the energy variation of the trailing profile part is smoothed over every 7 periods [PITH_FULL_IMAGE:figures/full_fig_p148_422.png] view at source ↗
Figure 423
Figure 423. Figure 423: On-pulse energy histogram of single pulses of PSR J1853+0029 from the FAST observation on 20200920. 0 40 80 Number I = 0 J1853+0029 20200920 0 5 10 15 20 25 E/ E 0.0 0.5 1.0 1.5 2.0 2.5 3.0 I/<I> [PITH_FULL_IMAGE:figures/full_fig_p149_423.png] view at source ↗
Figure 424
Figure 424. Figure 424: Energy histogram of single pulses of PSR J1853+0029 from the FAST observation on 20200920. The energy values are integrated over the trailing part of the pulse profile and smoothed over 7 periods. 20 10 0 10 Longitude ( ) 0.0 0.4 0.8 I/Ip e a k J1853+0029 20200920 Aver. Prof. Trailing-weak Trailing-strong [PITH_FULL_IMAGE:figures/full_fig_p149_424.png] view at source ↗
Figure 425
Figure 425. Figure 425: Mean profiles for the trailing-weak and trailing-strong emis￾sion modes of PSR J1853+0029 from the FAST observation on 20200920, which are normalized by their respective peaks [PITH_FULL_IMAGE:figures/full_fig_p149_425.png] view at source ↗
Figure 428
Figure 428. Figure 428: Cross correlation of PSR J1853+0853 from the FAST obser￾vation on 20210306. This pulsar was observed by FAST on 20230528 for 1.7 hours and 20251019 for 15 minutes. From the observation with a longer duration, the rotation period and a dispersion measure are derived to be P = 3.0195 s and a dispersion measure DM = 236.5 cm−3 pc. Single pulse sequences of the observation on 20251019 are shown in [PITH_FUL… view at source ↗
Figure 429
Figure 429. Figure 429: Single pulse sequences of PSR J1854-0230g from the FAST observation on 20230527. 100 50 0 50 100 Longitude ( ) 0.0 0.5 1.0 1.5 Normalized I J1854-0230g 20230527 Aver. Prof. Bright Weak [PITH_FULL_IMAGE:figures/full_fig_p150_429.png] view at source ↗
Figure 430
Figure 430. Figure 430: Mean profiles of the weak (blue dotted) and bright (red dashed) emission modes for PSR J1854-0230g from the FAST observation on 20230527. Profiles of modes are normalized by the peak of the mean profile (black solid) of all periods. 20211018, a rotation period P = 3.9148 s and a dispersion measure DM = 233.9 cm−3 pc were derived. Single pulse sequences of the observation on 20210306 are displayed in [PI… view at source ↗
Figure 432
Figure 432. Figure 432: Single pulse sequence of PSR J1854+0319 from the FAST observation on 20200509. are 1/P3 = 0.173 ± 0.003 and 1/P2 = −8.1 ± 0.3, corre￾sponding to the periodicities of P3 = 5.8 ± 0.1 periods and P2 = −45 ± 2 ◦ . 2DFS of the trailing component exhibit a drift feature with the centroid of 1/P3 = 0.318 ± 0.003 and 1/P2 = −5.9 ± 0.3, yielding P3 = 3.15 ± 0.03 periods and P2 = −61 ± 3 ◦ . 4.167. J1854+0319 PSR … view at source ↗
Figure 431
Figure 431. Figure 431: Fluctuation analysis of the bright emission mode of PSR J1854-0230g for the observation on 20230527, with LRFS and 2DFS for the on-pulse region of a mean pulse profile. 4.166. J1854-0230g PSR J1854-0230g was discovered in the FAST GPPS sur￾vey (Han et al. 2021, 2025). The pulsar was observed by FAST on 20230527 for 14 minutes, yielding a rotation period P = 0.6874 s and a dis￾persion measure DM = 548.6 c… view at source ↗
Figure 433
Figure 433. Figure 433: Fluctuation analysis of slow drifting mode (left panels) and fast drifting mode (right panels) of PSR J1854+0319 from the FAST obser￾vation on 20200509, with LRFS (top), and 2DFS for the leading part of a mean pulse profile (bottom). – to be continued. 1/P2 = −16 ± 3 (P2 = −23 ± 4 ◦ ) for the leading part in the mean pulse profile, and 1/P3 = 0.131 ± 0.002 (P3 = 7.7 ± 0.1 periods) and 1/P2 = −23 ± 2 (P2 … view at source ↗
Figure 434
Figure 434. Figure 434: Single pulse sequences of PSR J1855-0115g from the FAST observation on 20230309 [PITH_FULL_IMAGE:figures/full_fig_p152_434.png] view at source ↗
Figure 435
Figure 435. Figure 435: On-pulse energy histogram of single pulses of PSR J1855- 0115g from the FAST observation on 20230309. 0 10 20 25 50 75 100 125 150 175 Pulse No. I/ bin J1855+0422 20201204 20 0 20 Longitude ( ) 0 1 I/Ipeak 0 25 E/ E [PITH_FULL_IMAGE:figures/full_fig_p153_435.png] view at source ↗
Figure 438
Figure 438. Figure 438: Single pulse sequence of PSR J1856-0134g from the FAST observation on 20230508, and a zoomed-in view of pulses No. 100-400. sion measure DM = 456.8 cm−3 pc. The single pulse se￾quence in [PITH_FULL_IMAGE:figures/full_fig_p153_438.png] view at source ↗
Figure 439
Figure 439. Figure 439: On-pulse energy histogram of single pulses of PSR J1856- 0134g from the FAST observation on 20230508. 20 10 0 10 20 Longitude ( ) 0.0 0.4 0.8 I/Ip e a k J1856-0134g 20230508 Aver. Prof. Weak Bright [PITH_FULL_IMAGE:figures/full_fig_p154_439.png] view at source ↗
Figure 440
Figure 440. Figure 440: Mean profiles for the weak and bright emission modes of PSR J1856-0134g from the FAST observation on 20230508, which are normal￾ized by their respective peaks. 0 100 200 300 Counts N=1(0) 0 1 2 3 4 5 6 Periods for bright mode PB (P) 0 20 40 60 P erio d s f or w e a k m o d e P W (P) WN NW 0 100 Counts N=12(11) [PITH_FULL_IMAGE:figures/full_fig_p154_440.png] view at source ↗
Figure 442
Figure 442. Figure 442: Single pulse sequence of PSR J1856-0526 from the FAST ob￾servation on 20250304, and a zoomed-in view of pulses No. 100-700. The right subplot shows the energy variation integrated over the central phase interval of the mean pulse profile, smoothed with a 17-period moving av￾erage. The magenta dash-dot line represents the boundary between the two emission modes [PITH_FULL_IMAGE:figures/full_fig_p154_442.png] view at source ↗
Figure 443
Figure 443. Figure 443: Energy histogram of single pulses from PSR J1856-0526, ob￾tained from the FAST observation on 20250304. For every single pulse, the energy is integrated over the central phase interval of the mean pulse profile, and the energy sequence is smoothed with a 17-period moving average. The central-weak and central-strong modes, distinguished by their relative inte￾grated energy in this interval, are shown in r… view at source ↗
Figure 444
Figure 444. Figure 444: Mean polarization profiles (the top panel) for the central￾weak (red) and central-strong modes (green), as well as the averaged PA curves (the bottom panel) of PSR J1856-0526 from the FAST observation on 20250304. quences of this observation are shown in [PITH_FULL_IMAGE:figures/full_fig_p155_444.png] view at source ↗
Figure 446
Figure 446. Figure 446: Single pulse sequence of PSR J1857+0210 from the FAST observation on 20220925, and a zoomed-in view of pulses No. 400-600. LRFS 0.3 0.6 0.9 Norm. Power 0 25 Longitude ( ) 0 1 Norm. I 0.1 0.2 0.3 0.4 0.5 F r e q. ( 1 / P 3 ) J1857+0210 20220925 2DFS: W 0.4 0.8 Norm. Power 50 0 50 Freq. (1/P2) 0 1 Norm. P. 0.1 0.2 0.3 0.4 0.5 F r e q. ( 1 / P 3 ) J1857+0210 20220925 [PITH_FULL_IMAGE:figures/full_fig_p156_… view at source ↗
Figure 448
Figure 448. Figure 448: Zoomed-in segments of 400 pulses each for main pulse (left) and interpulse (right) of PSR J1857+0943, from the FAST observa￾tion on 20210425 (top) and 20221001 (bottom). The data from 20210425 and 20221001 were folded with 64 and 512 bins per pulse period, respec￾tively [PITH_FULL_IMAGE:figures/full_fig_p156_448.png] view at source ↗
Figure 450
Figure 450. Figure 450: Single pulse sequence of PSR J1857-0120 from the FAST observation on 20220429. LRFS 0.3 0.6 Norm. Power 10 0 10 Longitude ( ) 0 1 Norm. I 0.1 0.2 0.3 0.4 F r e q. ( 1 / P 3 ) J1857-0120g 20220429 2DFS: W 0.3 0.6 Norm. Power 250 0 250 Freq. (1/P2) 0 1 Norm. P. 0.1 0.2 0.3 0.4 F r e q. ( 1 / P 3 ) J1857-0120g 20220429 [PITH_FULL_IMAGE:figures/full_fig_p157_450.png] view at source ↗
Figure 449
Figure 449. Figure 449: LRFS of PSR J1857+0943 for the main pulse (left panels) and interpulse (right panels), from FAST observations on 20210425 (top) and 20221001 (bottom). in red and green, respectively. A comparison of the mean po￾larization profiles and averaged PA curves for the two emis￾sion modes is shown in [PITH_FULL_IMAGE:figures/full_fig_p157_449.png] view at source ↗
Figure 451
Figure 451. Figure 451: Fluctuation analysis of PSR J1857-0120 for the observation on 20220429, with LRFS and 2DFS for the on-pulse region of a mean pulse profile [PITH_FULL_IMAGE:figures/full_fig_p157_451.png] view at source ↗
Figure 452
Figure 452. Figure 452: Single pulse sequences of PSR J1858+0026g from the FAST observation on 20250129 [PITH_FULL_IMAGE:figures/full_fig_p158_452.png] view at source ↗
Figure 453
Figure 453. Figure 453: On-pulse energy histogram of single pulses of PSR J1858+0026g from the FAST observation on 20250129. LRFS 0.3 0.6 Norm. Power 5 0 5 Longitude ( ) 0 1 Norm. I 0.1 0.2 0.3 0.4 0.5 F r e q. ( 1 / P 3 ) J1858+0026g 20200426 2DFS: W 0.2 0.4 Norm. Power 250 0 250 Freq. (1/P2) 0 1 Norm. P. 0.1 0.2 0.3 0.4 0.5 F r e q. ( 1 / P 3 ) J1858+0026g 20200426 [PITH_FULL_IMAGE:figures/full_fig_p159_453.png] view at source ↗
Figure 455
Figure 455. Figure 455: Single pulse sequences of PSR J1858+0241 from the FAST observation on 20220529. 0 10 20 30 E/ E 0 20 40 60 80 Number J1858+0241 20200806 1 0 1 2 3 4 5 6 I/<I> 5 0 5 10 15 20 E/ E 0 20 40 60 Number J1858+0241 20220529 1 0 1 2 3 4 I/<I> [PITH_FULL_IMAGE:figures/full_fig_p159_455.png] view at source ↗
Figure 456
Figure 456. Figure 456: On-pulse energy histograms of single pulses of PSR J1858+0241 from the FAST observations on 20200806 and 20220529 [PITH_FULL_IMAGE:figures/full_fig_p159_456.png] view at source ↗
Figure 459
Figure 459. Figure 459: Single pulse sequence of PSR J1858+0609g from the FAST observation on 20260103, and a zoomed in view of pulses No. 1000-1400. LRFS 0.25 0.50 0.75 Norm. Power 25 0 25 Longitude ( ) 0 1 Norm. I 0.1 0.2 0.3 0.4 0.5 F r e q. ( 1 / P 3 ) J1858+0609g 20260103 2DFS: W 0.3 0.6 Norm. Power 50 0 50 Freq. (1/P2) 0 1 Norm. P. 0.1 0.2 0.3 0.4 0.5 F r e q. ( 1 / P 3 ) J1858+0609g 20260103 [PITH_FULL_IMAGE:figures/ful… view at source ↗
Figure 458
Figure 458. Figure 458: Fluctuation analysis of PSR J1858+0319 from the FAST ob￾servation on 20201026, with LRFS and 2DFS for the trailing part of a mean pulse profile. 0 3 0 200 400 600 800 1000 1200 1400 Pulse No. I/ bin J1858+0609g 20260103 25 0 25 Longitude ( ) 0 1 I/Ipeak 5 0 5 E/ E 0 3 1050 1100 1150 1200 1250 1300 1350 Pulse No. I/ bin J1858+0609g 20260103 25 0 25 Longitude ( ) 0 1 I/Ipeak 5 0 5 E/ E [PITH_FULL_IMAGE:fi… view at source ↗
Figure 461
Figure 461. Figure 461: Single pulse sequence of PSR J1859+00 from the FAST ob￾servation on 20230308, and a zoomed-in view of pulses No. 150-250. LRFS 0.3 0.6 0.9 Norm. Power 50 0 50 Longitude ( ) 0 1 Norm. I 0.1 0.2 0.3 0.4 F r e q. ( 1 / P 3 ) J1859+00 20230308 2DFS: W 0.4 0.8 Norm. Power 50 0 50 Freq. (1/P2) 0 1 Norm. P. 0.1 0.2 0.3 0.4 F r e q. ( 1 / P 3 ) J1859+00 20230308 [PITH_FULL_IMAGE:figures/full_fig_p161_461.png] view at source ↗
Figure 462
Figure 462. Figure 462: Fluctuation analysis of PSR J1859+00 for the observation on 20230308, with LRFS and 2DFS for the on-pulse region of a mean pulse profile. of the observation on 20200426 indicate the negative drift feature of 1/P3 = 0.146 ± 0.003 (P3 = 6.9 ± 0.1 periods) and 1/P2 = −94 ± 14 (P2 = −3.8 ± 0.6 ◦ ), there is no ob￾vious drift feature in 2DFS of the observation on 20250129, which may be caused by the unsystema… view at source ↗
Figure 464
Figure 464. Figure 464: On-pulse energy histogram of single pulses of PSR J1900+0227 from the FAST observation on 20201223, with energy values smoothed over 9 periods. 20 10 0 10 20 Longitude ( ) 0.0 0.4 0.8 I/Ip e a k J1900+0227 20201223 Aver. Prof. Weak Bright [PITH_FULL_IMAGE:figures/full_fig_p162_464.png] view at source ↗
Figure 465
Figure 465. Figure 465: Mean profiles for the weak and bright emission modes of PSR J1900+0227 from the FAST observation on 20201223, which are normalized by their respective peaks. features in 2DFS. One feature has a low temporal frequency without phase modulation, while the other two features are phase modulated in opposite directions. The centroid fre￾quency of the low-frequency modulation feature in 2DFS is 1/P3 = 0.160 ± 0… view at source ↗
Figure 463
Figure 463. Figure 463: Single pulse sequence of PSR J1900+0227 from the FAST observation on 20201223, and a zoomed-in view of pulses No.3000-3500. In the right subpanel, the on-pulse energy variation is smoothed over every 9 periods. 0 150 300 Number I = 0 J1900+0227 20201223 0 10 20 30 E/ E 0 1 2 3 I/<I> [PITH_FULL_IMAGE:figures/full_fig_p162_463.png] view at source ↗
Figure 466
Figure 466. Figure 466: Single pulse sequence of PSR J1900-0134 from the FAST observation on 20211022. 0 10 20 30 E/ E 0 10 20 30 Number (× 0.5) J1900-0134 20211022 0 1 2 3 I/<I> [PITH_FULL_IMAGE:figures/full_fig_p163_466.png] view at source ↗
Figure 467
Figure 467. Figure 467: On-pulse energy histogram of single pulses of PSR J1900- 0134 from the FAST observation on 20211022. sure DM = 202.7 cm−3 pc were derived. The single pulse sequence and a zoomed-in view of pulses No. 3000-3500 in [PITH_FULL_IMAGE:figures/full_fig_p163_467.png] view at source ↗
Figure 468
Figure 468. Figure 468: Single pulse sequence of PSR J1900-0329g from the FAST observation on 20251028, and a zoomed-in view of pulses No.300-700. In the right subpanel, the on-pulse energy variation is smoothed over every 3 periods, with a dashed line for the threshold to distinguish the weak and bright emission modes [PITH_FULL_IMAGE:figures/full_fig_p163_468.png] view at source ↗
Figure 469
Figure 469. Figure 469: On-pulse energy histogram of single pulses of PSR J1900- 0329g from the FAST observation on 20251028, with energy values smoothed over 3 periods. 20 10 0 10 20 Longitude ( ) 0.0 0.4 0.8 I/Ip e a k J1900-0329g 20251028 Aver. Prof. Weak Bright [PITH_FULL_IMAGE:figures/full_fig_p164_469.png] view at source ↗
Figure 470
Figure 470. Figure 470: Mean profiles for the weak and bright emission modes of PSR J1900-0329g from the FAST observation on 20251028, which are normal￾ized by their respective peaks. PSR J1900-0134 is the first pulsar discovered by FAST (Qian et al. 2019). This pulsar was also observed by FAST on 20211022 for 5 minutes, with a rotation period P = 1.8324 s and a disper￾sion measure DM = 178.9 cm−3 pc. The single pulse se￾quence… view at source ↗
Figure 472
Figure 472. Figure 472: Fluctuation analysis of PSR J1901+0124 for the observation on 20201218, with LRFS and 2DFS for the on-pulse region of a mean pulse profile [PITH_FULL_IMAGE:figures/full_fig_p164_472.png] view at source ↗
Figure 473
Figure 473. Figure 473: The single pulse sequence of PSR J1901+0156 from the FAST observation on 20221220, and a zoomed-in view of pulses No.1000-1500. mode shows only a single peak in the leading profile part. For the bright emission mode, the energy is enhanced for both the leading and trailing profile parts compared to the weak mode. 4.183. J1901+0124 PSR J1901+0124 was discovered in the Parkes multibeam pulsar survey (Hobbs… view at source ↗
Figure 474
Figure 474. Figure 474: Fluctuation analysis of PSR J1901+0156 for the observation on 20221220, with LRFS (top-left), and 2DFS for the leading part (top￾right), central part (bottom-left) and trailing part (bottom-right) of a mean pulse profile. ods and P2 = −52+13 −29 degrees for the first, and P3 = 15 ± 2 periods and P2 = −56+36 −22 degrees for the second. This pulsar was observed by FAST on 20191226 for 5 minutes and 2022122… view at source ↗
Figure 475
Figure 475. Figure 475: Single pulse sequence of PSR J1901+0254 from the FAST observation on 20200514. 0 10 20 30 40 E/ E 0 25 50 75 100 Number J1901+0254 20200514 0 2 4 6 8 I/<I> [PITH_FULL_IMAGE:figures/full_fig_p166_475.png] view at source ↗
Figure 476
Figure 476. Figure 476: On-pulse energy histogram of single pulses of PSR J1901+0254 from the FAST observation on 20200514. 13.2 ± 0.1 periods. The central and trailing profile parts are more likely to exhibit the negative drift feature. The centroids are characterized by 1/P3 = 0.073±0.001 (P3 = 13.6±0.1 periods) and 1/P2 = −10 ± 3 (P2 = −36 ± 11 degree) for the central part, and 1/P3 = 0.073±0.001 (P3 = 13.8±0.2 periods) and … view at source ↗
Figure 479
Figure 479. Figure 479: Fluctuation analysis of PSR J1901+0511 for the observation on 20220102, with LRFS and 2DFS for the trailing part of a mean pulse profile. 0 4 8 0 100 200 300 400 500 600 Pulse No. I/ bin J1901-0104g 20220420 10 0 10 Longitude ( ) 0 1 I/Ipeak 0 10 E/ E 0 4 8 700 800 900 1000 1100 1200 Pulse No. I/ bin J1901-0104g 20220420 10 0 10 Longitude ( ) 0 1 I/Ipeak 0 10 E/ E [PITH_FULL_IMAGE:figures/full_fig_p167_… view at source ↗
Figure 480
Figure 480. Figure 480: Single pulse sequences of PSR J1901-0104g from the FAST observation on 20220420. LRFS 0.3 0.6 Norm. Power 10 0 10 Longitude ( ) 0 1 Norm. I 0.1 0.2 0.3 0.4 F r e q. ( 1 / P 3 ) J1901-0104g 20220420 2DFS: W 0.4 0.8 Norm. Power 250 0 250 Freq. (1/P2) 0 1 Norm. P. 0.1 0.2 0.3 0.4 F r e q. ( 1 / P 3 ) J1901-0104g 20220420 [PITH_FULL_IMAGE:figures/full_fig_p167_480.png] view at source ↗
Figure 482
Figure 482. Figure 482: Single pulse sequences of PSR J1902+0248 from the FAST observation on 20221018. 0 10 20 30 E/ E 0 10 20 30 40 50 Number (× 0.4) J1902+0248 20210119 0 1 2 3 4 5 I/<I> 0 10 20 30 E/ E 0 10 20 30 Number (× 0.4) J1902+0248 20221018 0 1 2 3 4 I/<I> [PITH_FULL_IMAGE:figures/full_fig_p168_482.png] view at source ↗
Figure 484
Figure 484. Figure 484: Fluctuation analysis of PSR J1902+0248 for FAST observa￾tions on 20210119 and 20221018, with LRFS and 2DFS for the on-pulse region of mean pulse profiles. and 25±2% from the on-pulse integral energy histograms ( [PITH_FULL_IMAGE:figures/full_fig_p168_484.png] view at source ↗
Figure 483
Figure 483. Figure 483: On-pulse energy histograms of single pulses of PSR J1902+0248 from FAST observations on 20210119 and 20221018. LRFS 0.4 0.8 Norm. Power 20 0 Longitude ( ) 0 1 Norm. I L T 0.1 0.2 0.3 0.4 F r e q. ( 1 / P 3 ) J1902+0248 20210119 2DFS: T 0.4 0.8 Norm. Power 250 0 250 Freq. (1/P2) 0 1 Norm. P. 0.1 0.2 0.3 0.4 F r e q. ( 1 / P 3 ) J1902+0248 20210119 LRFS 0.4 0.8 Norm. Power 20 0 Longitude ( ) 0 1 Norm. I L … view at source ↗
Figure 487
Figure 487. Figure 487: Single pulse sequence of PSR J1902+1022g from the FAST observation on 20220905, as well as a zoomed-in view of pulses No.900- 1400. 0 80 160 Number I = 0 J1902+1022g 20220905 2.5 0.0 2.5 5.0 7.5 10.0 12.5 E/ E 2 0 2 4 6 I/<I> [PITH_FULL_IMAGE:figures/full_fig_p169_487.png] view at source ↗
Figure 488
Figure 488. Figure 488: Histogram of smoothed on-pulse energies for single pulses of PSR J1902+1022g from the FAST observation on 20220905. This pulsar was observed by FAST on 20220410 for 15 minutes, and a rotation period of P = 0.4878 s and a dis￾persion measure of DM = 105.5 cm−3 pc were determined. Single pulse sequences in [PITH_FULL_IMAGE:figures/full_fig_p169_488.png] view at source ↗
Figure 486
Figure 486. Figure 486: Fluctuation analysis of PSR J1902+0723 for the observation on 20220410, with LRFS and 2DFS for the on-pulse region of a mean pulse profile. 0 6 0 200 400 600 800 1000 1200 1400 1600 Pulse No. I/ bin J1902+1022g 20220905 0 10 Longitude ( ) 0 1 I/Ipeak 0 10 E/ E 0 6 1000 1100 1200 1300 Pulse No. I/ bin J1902+1022g 20220905 0 10 Longitude ( ) 0 1 I/Ipeak 0 10 E/ E [PITH_FULL_IMAGE:figures/full_fig_p169_486.png] view at source ↗
Figure 489
Figure 489. Figure 489: Single pulse sequence of PSR J1902+1141 from the FAST observation on 20230825, as well as a zoomed-in view of pulses No.1000- 1400. LRFS 0.2 0.4 0.6 Norm. Power 10 0 10 Longitude ( ) 0 1 Norm. I 0.1 0.2 0.3 0.4 F r e q. ( 1 / P 3 ) J1902+1141 20230825 2DFS: W 0.3 0.6 Norm. Power 100 0 100 Freq. (1/P2) 0 1 Norm. P. 0.1 0.2 0.3 0.4 F r e q. ( 1 / P 3 ) J1902+1141 20230825 [PITH_FULL_IMAGE:figures/full_fig… view at source ↗
Figure 490
Figure 490. Figure 490: Fluctuation analysis of PSR J1902+1141 for the observation on 20230825, with LRFS and 2DFS for the on-pulse region of a mean pulse profile [PITH_FULL_IMAGE:figures/full_fig_p170_490.png] view at source ↗
Figure 491
Figure 491. Figure 491: Single pulse sequences of PSR J1903+0135 from the FAST observation on 20200813. LRFS 0.4 0.8 Norm. Power 10 0 10 Longitude ( ) 0 1 Norm. I 0.1 0.2 0.3 0.4 F r e q. ( 1 / P 3 ) J1903+0135 20200813 2DFS: W 0.4 0.8 Norm. Power 200 0 200 Freq. (1/P2) 0 1 Norm. P. 0.1 0.2 0.3 0.4 F r e q. ( 1 / P 3 ) J1903+0135 20200813 [PITH_FULL_IMAGE:figures/full_fig_p171_491.png] view at source ↗
Figure 494
Figure 494. Figure 494: On-pulse energy histogram of single pulses of PSR J1903+0415 from the FAST observation on 20200223. PSR J1903+0415 was discovered by Lazarus et al. (2015) in the Arecibo Pulsar-ALFA (PALFA) survey at 1.4 GHz. The nulling behavior was reported by Parent et al. (2022). This pulsar was observed by FAST on 20200223 for 5 minutes, deriving a rotation period P = 1.1515 s and a dispersion measure DM = 482.5 cm−… view at source ↗
Figure 492
Figure 492. Figure 492: Fluctuation analysis of PSR J1903+0135 from the FAST ob￾servation on 20200813, with LRFS and 2DFS for the on-pulse region of a mean pulse profile. 0 4 50 100 150 200 250 Pulse No. I/ bin J1903+0415 20200223 10 0 10 Longitude ( ) 0 1 I/Ipeak 0 10 E/ E [PITH_FULL_IMAGE:figures/full_fig_p171_492.png] view at source ↗
Figure 495
Figure 495. Figure 495: Fluctuation analysis of PSR J1903+0415 from the FAST ob￾servation on 20200223, with LRFS and 2DFS for the on-pulse region of a mean pulse profile. 0 15 30 0 500 1000 1500 2000 2500 Pulse No. I/ bin J1903+0925 20211226 100 0 100 Longitude ( ) 0 1 I/Ipeak 0 5 E/ E 0 15 30 125 150 175 200 225 250 275 Pulse No. I/ bin J1903+0925 20211226 100 0 100 Longitude ( ) 0 1 I/Ipeak 0 5 E/ E [PITH_FULL_IMAGE:figures/… view at source ↗
Figure 497
Figure 497. Figure 497: Fluctuation analysis of PSR J1903+0925 for the observation on 20211226, with LRFS (top-left), and 2DFS for the on-pulse region (top￾right), leading part (bottom-left) and trailing part (bottom-right) of a mean pulse profile. ture with the centroid frequencies of 1/P3 = 0.258 ± 0.002 (P3 = 3.87 ± 0.03 periods) and 1/P2 = −52 ± 1 (P2 = −6.9 ± 0.2 ◦ ), as well as a low-frequency modulation from nulls with P… view at source ↗
Figure 496
Figure 496. Figure 496: Single pulse sequence of PSR J1903+0925 from the FAST observation on 20211226, and a zoomed-in view of pulses No.100-300. LRFS 0.25 0.50 0.75 Norm. Power 100 0 100 Longitude ( ) 0 1 Norm. I L T 0.1 0.2 0.3 0.4 0.5 F r e q. ( 1 / P 3 ) J1903+0925 20211226 2DFS: W 0.0 0.5 Norm. Power 25 0 25 Freq. (1/P2) 0 1 Norm. P. 0.1 0.2 0.3 0.4 0.5 F r e q. ( 1 / P 3 ) J1903+0925 20211226 2DFS: L 0.0 0.5 Norm. Power 2… view at source ↗
Figure 498
Figure 498. Figure 498: Single pulse sequence of PSR J1903+1728g from the FAST observation on 20240516. shown in [PITH_FULL_IMAGE:figures/full_fig_p173_498.png] view at source ↗
Figure 499
Figure 499. Figure 499: Fluctuation analysis of PSR J1903+1728g for the observation on 20240516, with LRFS (top-left), and 2DFS for the on-pulse region (top￾right), leading part (bottom-left) and trailing part (bottom-right) of a mean pulse profile. 4.196. J1903+2225 PSR J1903+2225 was discovered by Nice et al. (1995) us￾ing the Arecibo telescope. Subpulse drifting of the pulsar was reported by Song et al. (2023). The pulsar wa… view at source ↗
Figure 500
Figure 500. Figure 500: Single pulse sequence of PSR J1903+2225 from the FAST observation on 20210716. LRFS 0.3 0.6 Norm. Power 10 0 10 Longitude ( ) 0 1 Norm. I 0.1 0.2 0.3 0.4 F r e q. ( 1 / P 3 ) J1903+2225 20210716 2DFS: W 0.3 0.6 Norm. Power 200 0 200 Freq. (1/P2) 0 1 Norm. P. 0.1 0.2 0.3 0.4 F r e q. ( 1 / P 3 ) J1903+2225 20210716 [PITH_FULL_IMAGE:figures/full_fig_p174_500.png] view at source ↗
Figure 503
Figure 503. Figure 503: On-pulse energy histogram of single pulses of PSR J1904+1011 from the FAST observation on 20230525. 1/P2 = −50 ± 1, which correspond to drifting periodicities of P3 = 11.2 ± 0.2 periods and P2 = −7.2 ± 0.2 ◦ . 4.197. J1904+1011 PSR J1904+1011 was discovered by Hulse & Taylor (1975) using the Arecibo telescope. The pulsar was reported to have nulling (Lorimer et al. 2002), subpulse drifting (Song et al. 2… view at source ↗
Figure 501
Figure 501. Figure 501: Fluctuation analysis of PSR J1903+2225 for the observation on 20210716, with LRFS and 2DFS for the on-pulse region of a mean pulse profile. 0 20 40 50 100 150 200 Pulse No. I/ bin J1904+1011 20230525 25 0 25 Longitude ( ) 0 1 I/Ipeak 0 100 E/ E 0 20 40 350 400 450 500 550 Pulse No. I/ bin J1904+1011 20230525 25 0 25 Longitude ( ) 0 1 I/Ipeak 0 100 E/ E [PITH_FULL_IMAGE:figures/full_fig_p174_501.png] view at source ↗
Figure 504
Figure 504. Figure 504: Fluctuation analysis of PSR J1904+1011 from the FAST ob￾servation on 20230525, with LRFS (top-left), and 2DFS for the on-pulse region (top-right), leading part (bottom-left), and trailing part (bottom-right) of a mean pulse profile. DM = 137.0 cm−3 pc were determined. The single pulse sequences in [PITH_FULL_IMAGE:figures/full_fig_p175_504.png] view at source ↗
Figure 505
Figure 505. Figure 505: Single pulse sequences of PSR J1905+0616 from the FAST observation on 20221025. In the right subpanel, the energy variation is inte￾grated over the leading phase interval from -3.9◦ to 1.4◦ in longitude of the mean pulse profile, smoothed with a 7-period moving average [PITH_FULL_IMAGE:figures/full_fig_p175_505.png] view at source ↗
Figure 506
Figure 506. Figure 506: Energy histogram of single pulses of PSR J1905+0616 from the FAST observation on 20221025. For every single pulse, the energy is integrated over the leading phase interval of the mean pulse profile, and the energy sequence is smoothed with a 7-period moving average. The leading￾weak and leading-strong modes, distinguished by their relative energy inte￾grated in this phase interval, are shown in red and g… view at source ↗
Figure 508
Figure 508. Figure 508: Fluctuation analysis of PSR J1905+0616 for the observation on 20221025, with LRFS and 2DFS for the on-pulse region of a mean pulse profile. 0 4 50 100 150 200 250 Pulse No. I/ bin J1905+0656 20200205 10 0 10 Longitude ( ) 0 1 I/Ipeak 0 10 E/ E 0 4 300 350 400 450 500 550 Pulse No. I/ bin J1905+0656 20200205 10 0 10 Longitude ( ) 0 1 I/Ipeak 0 10 E/ E [PITH_FULL_IMAGE:figures/full_fig_p176_508.png] view at source ↗
Figure 507
Figure 507. Figure 507: Mean polarization profiles (the top panel) for the leading￾weak and leading-strong emission modes of PSR J1905+0616 from the FAST observation on 20221025, as well as the averaged PA curves (the bot￾tom panel). Profiles in the top panel are normalized by the respective peaks. and 1/P2 = −12 ± 1, yielding P3 = 13.6 ± 0.2 periods and P2 = −30 ± 3 ◦ . Sometimes the drift band corresponding to the trailing co… view at source ↗
Figure 509
Figure 509. Figure 509: Single pulse sequences of PSR J1905+0656 from the FAST observation on 20200205 [PITH_FULL_IMAGE:figures/full_fig_p176_509.png] view at source ↗
Figure 512
Figure 512. Figure 512: Fluctuation analysis of PSR J1905+0758 for the observation on 20220625, with LRFS and 2DFS for the on-pulse region of a mean pulse profile. sequences in [PITH_FULL_IMAGE:figures/full_fig_p177_512.png] view at source ↗
Figure 511
Figure 511. Figure 511: Single pulse sequences of PSR J1905+0758 from the FAST observation on 20220625. LRFS 0.3 0.6 0.9 Norm. Power 0 10 Longitude ( ) 0 1 Norm. I 0.1 0.2 0.3 0.4 F r e q. ( 1 / P 3 ) J1905+0758 20220625 2DFS: W 0.4 0.8 Norm. Power 250 0 250 Freq. (1/P2) 0 1 Norm. P. 0.1 0.2 0.3 0.4 F r e q. ( 1 / P 3 ) J1905+0758 20220625 [PITH_FULL_IMAGE:figures/full_fig_p177_511.png] view at source ↗
Figure 515
Figure 515. Figure 515: Fluctuation analysis of PSR J1905+0935g for the observation on 20220529, with LRFS and 2DFS for the leading part of a mean pulse profile. 0 15 20 40 60 80 100 120 140 160 Pulse No. I/ bin J1905+1034 20200104 10 0 Longitude ( ) 0 1 I/Ipeak 0 25 E/ E [PITH_FULL_IMAGE:figures/full_fig_p178_515.png] view at source ↗
Figure 513
Figure 513. Figure 513: Single pulse sequences of PSR J1905+0935g from the FAST observation on 20220529. 0 5 10 15 E/ E 0 20 40 60 80 Number (× 0.6) J1905+0935g 20220529 0.5 0.0 0.5 1.0 1.5 2.0 I/<I> [PITH_FULL_IMAGE:figures/full_fig_p178_513.png] view at source ↗
Figure 514
Figure 514. Figure 514: On-pulse energy histogram of single pulses of PSR J1905+0935g from the FAST observation on 20220529. P2 = 4.2 ± 0.2 degrees. The drifting properties obtained from the observation on 20231001 are consistent with those from 20200205. 4.200. J1905+0758 PSR J1905+0758 was discovered in the FAST GPPS sur￾vey (Han et al. 2021, 2025). This pulsar was observed by FAST on 20220625 for 15 minutes, deriving a rotat… view at source ↗
Figure 516
Figure 516. Figure 516: Single pulse sequence of PSR J1905+1034 from the FAST observation on 20200104 [PITH_FULL_IMAGE:figures/full_fig_p178_516.png] view at source ↗
Figure 517
Figure 517. Figure 517: On-pulse energy histogram of single pulses of PSR J1905+1034 from the FAST observation on 20200104. 0 6 12 50 100 150 200 250 Pulse No. I/ bin J1906+0414 20210507 0 20 Longitude ( ) 0 1 I/Ipeak 0 25 E/ E [PITH_FULL_IMAGE:figures/full_fig_p179_517.png] view at source ↗
Figure 519
Figure 519. Figure 519: Fluctuation analysis of PSR J1906+0414 for the observation on 20210507, with LRFS and 2DFS for the leading part of a mean pulse profile. 0 6 12 50 100 150 200 Pulse No. I/ bin J1906+1211g 20220905 20 0 Longitude ( ) 0 1 I/Ipeak 0 20 E/ E [PITH_FULL_IMAGE:figures/full_fig_p179_519.png] view at source ↗
Figure 518
Figure 518. Figure 518: Single pulse sequence of PSR J1906+0414 from the FAST observation on 20210507. leading and trailing profile parts. From the fluctuation spec￾tra in [PITH_FULL_IMAGE:figures/full_fig_p179_518.png] view at source ↗
Figure 520
Figure 520. Figure 520: Single pulse sequence of PSR J1906+1211g from the FAST observation on 20220905 [PITH_FULL_IMAGE:figures/full_fig_p179_520.png] view at source ↗
Figure 521
Figure 521. Figure 521: On-pulse energy histogram of single pulses of PSR J1906+1211g from the FAST observation on 20220905. 0 5 10 50 100 150 200 250 300 Pulse No. I/ bin J1906+1854 20210802 0 50 Longitude ( ) 0 1 I/Ipeak 0 10 E/ E [PITH_FULL_IMAGE:figures/full_fig_p180_521.png] view at source ↗
Figure 523
Figure 523. Figure 523: Fluctuation analysis of PSR J1906+1854 for the observation on 20211123, with LRFS (top-left), and 2DFS for the on-pulse region (top￾right), leading part (bottom-left) and central part (bottom-right) of a mean pulse profile. and 1/P2 = −83 ± 3, corresponding to periodicities of P3 = 2.054 ± 0.002 periods and P2 = −4.3 ± 0.2 ◦ . 4.202. J1905+1034 PSR was discovered in the PALFA Survey, and previously repor… view at source ↗
Figure 525
Figure 525. Figure 525: Fluctuation analysis of PSR J1907+0709g for the observation on 20201107, with LRFS and 2DFS for the on-pulse region of a mean pulse profile. 0 15 30 50 100 150 200 250 300 350 Pulse No. I/ bin J1908+0457 20210507 20 0 Longitude ( ) 0 1 I/Ipeak 0 50 E/ E [PITH_FULL_IMAGE:figures/full_fig_p181_525.png] view at source ↗
Figure 524
Figure 524. Figure 524: Single pulse sequence of PSR J1907+0709g from the FAST observation on 20201107, as well as a zoomed-in view of pulses No.100- 400. 4.204. J1906+1211g PSR J1906+1211g was discovered in the FAST GPPS sur￾vey (Han et al. 2021, 2025). This pulsar was observed by FAST on 20220905 for 15 minutes. The single pulse sequence in [PITH_FULL_IMAGE:figures/full_fig_p181_524.png] view at source ↗
Figure 526
Figure 526. Figure 526: Single pulse sequence of PSR J1908+0457 from the FAST observation on 20210507 [PITH_FULL_IMAGE:figures/full_fig_p181_526.png] view at source ↗
Figure 527
Figure 527. Figure 527: On-pulse energy histogram of single pulses of PSR J1908+0457 from the FAST observation on 20210507. PSR J1906+1854 was discovered by Nice et al. (1995) us￾ing the Arecibo telescope. The subpulse drifting behavior was reported by Song et al. (2023). This pulsar was observed by FAST on 20210802 for 5 min￾utes. The single pulse sequence displayed in [PITH_FULL_IMAGE:figures/full_fig_p182_527.png] view at source ↗
Figure 528
Figure 528. Figure 528: Single pulse sequence of PSR J1908+0916 from the FAST observation on 20191226. 4.208. J1908+0916 PSR J1908+0916 was discovered by Hulse & Taylor (1975) using the Arecibo telescope. The subpulse drifting of the pulsar was reported by Song et al. (2023) to be P3=24(5) periods and P2=17+66 −4 degrees. The pulsar was observed by FAST on 20191226 for 5 minutes, deriving a rotation period P = 0.8303 s and a di… view at source ↗
Figure 530
Figure 530. Figure 530: Single pulse sequence of PSR J1909+0310g from the FAST observation on 20250522, and a zoomed-in view of pulses No. 330-500. 20250209, a rotation period P = 0.5116 s and a dispersion measure DM = 255.1 cm−3 pc were determined. Single pulse sequences of the observation on 20250209 in [PITH_FULL_IMAGE:figures/full_fig_p183_530.png] view at source ↗
Figure 529
Figure 529. Figure 529: Fluctuation analysis of PSR J1908+0916 for the observation on 20191226, with LRFS (top-left), and 2DFS for the on-pulse region (top￾right), leading part (bottom-left) and trailing part (bottom-right) of a mean pulse profile. in [PITH_FULL_IMAGE:figures/full_fig_p183_529.png] view at source ↗
Figure 531
Figure 531. Figure 531: Fluctuation analysis of PSR J1909+0310g for the observation on 20250522, with LRFS (top-left), and 2DFS for the on-pulse region (top￾right), leading part (bottom-left) and trailing part (bottom-right) of a mean pulse profile. between weak and bright emission states. Emission modes of single pulses, labeled in red and blue, are distinguished from the on-pulse energy histogram ( [PITH_FULL_IMAGE:figures/f… view at source ↗
Figure 532
Figure 532. Figure 532: Single pulse sequence of PSR J1909+0423g from the FAST observation on 20250209, and the zoomed-in view of pulses No.1101-2750 [PITH_FULL_IMAGE:figures/full_fig_p184_532.png] view at source ↗
Figure 533
Figure 533. Figure 533: On-pulse energy histogram of single pulses of PSR J1909+0423g from the FAST observation on 20250209. 40 20 0 20 40 Longitude ( ) 0.0 0.5 1.0 1.5 Normalized I J1909+0423g 20250209 Aver. Prof. Weak Bright [PITH_FULL_IMAGE:figures/full_fig_p185_533.png] view at source ↗
Figure 534
Figure 534. Figure 534: Mean profiles for the weak (red dashed) and bright (green dotted) emission modes of PSR J1909+0423g from the FAST observation on 20250209, which are normalized by the peak of the mean profile (black solid) of all periods. LRFS 0.25 0.50 Norm. Power 50 0 50 Longitude ( ) 0 1 Norm. I 0.1 0.2 0.3 0.4 F r e q. ( 1 / P 3 ) J1909+0423g 20250209 2DFS: W 0.3 0.6 Norm. Power 50 0 50 Freq. (1/P2) 0 1 Norm. P. 0.1 … view at source ↗
Figure 537
Figure 537. Figure 537: On-pulse energy histogram of single pulses of PSR J1909+0912 from the FAST observation on 20231215. (Weltevrede et al. 2007; Basu et al. 2016), and for two com￾ponents Song et al. (2023) presented a positive drift feature (P3 = 12.2 ± 0.5 periods and P2 = 65+15 −50 degrees) and a P3-only feature (P3 = 16 ± 2 periods). This pulsar was reported by FAST on 20200824 for 15 minutes, deriving a rotation period… view at source ↗
Figure 535
Figure 535. Figure 535: Fluctuation analysis of PSR J1909+0423g for the observation on 20250209, with LRFS and 2DFS for the on-pulse region of a mean pulse profile. 0 8 0 1000 2000 3000 4000 5000 Pulse No. I/ bin J1909+0912 20231215 25 0 25 Longitude ( ) 0 1 I/Ipeak 0 50 E/ E 0 8 2400 2500 2600 2700 2800 2900 3000 3100 3200 Pulse No. I/ bin J1909+0912 20231215 25 0 25 Longitude ( ) 0 1 I/Ipeak 0 50 E/ E [PITH_FULL_IMAGE:figure… view at source ↗
Figure 538
Figure 538. Figure 538: Mean polarization profiles (the top panel) for the weak (red) and bright (green) emission modes of PSR J1909+0912 from the FAST observation on 20231215, as well as the averaged PA curves (the bottom panel). 0 15 30 0 500 1000 1500 2000 2500 3000 Pulse No. I/ bin J1909+1102 20200824 10 0 10 Longitude ( ) 0 1 I/Ipeak 0 100 E/ E 0 15 30 225 250 275 300 325 350 375 Pulse No. I/ bin J1909+1102 20200824 10 0 1… view at source ↗
Figure 540
Figure 540. Figure 540: Fluctuation analysis of PSR J1909+1102 for the observation on 20200824, with LRFS (top-left), and 2DFS for the on-pulse region (top￾right), leading part (bottom-left) and trailing part (bottom-right) of a mean pulse profile. by 1/P3 = 0.0586 ± 0.0004 and 1/P2 = 2 ± 1, yielding P3 = 17.1 ± 0.1 periods and P2 = 148 ± 74 degrees. 4.213. J1909+1337g PSR J1909+1337g was discovered in the FAST GPPS sur￾vey (Ha… view at source ↗
Figure 539
Figure 539. Figure 539: Single pulse sequence of PSR J1909+1102 from the FAST observation on 20200824, and a zoomed-in view of pulses No. 200-400. positive drift direction. In 2DFS of the leading profile part, the centroid of the drift feature is at 1/P3 = 0.070 ± 0.001 and 1/P2 = 7 ± 3, corresponding to periodicities of P3 = 14.2±0.2 periods and P2 = 54±23 degrees. For the trailing part, the centroid of the drift feature in 2D… view at source ↗
Figure 543
Figure 543. Figure 543: Single pulse sequence of PSR J1909+1859 from the FAST observation on 20210802. 0.0 0.6 N orm aliz e d I J1909+1859 20210802 I L V 10 0 10 20 Longitude ( ) 60 0 60 120 PA (°) Bright Weak [PITH_FULL_IMAGE:figures/full_fig_p187_543.png] view at source ↗
Figure 542
Figure 542. Figure 542: On-pulse energy histogram of single pulses of PSR J1909+1337g from the FAST observation on 20221105. togram, the nulling fraction of this observation is estimated to be 39.3±2.2%. 4.214. J1909+1859 PSR J1909+1859 was discovered by Nice et al. (1995) us￾ing the Arecibo telescope. This pulsar was observed by FAST on 20210802 for 5 min￾utes, deriving a rotation period P = 0.5425 s and a disper￾sion measure … view at source ↗
Figure 547
Figure 547. Figure 547: Fluctuation analysis of PSR J1910+0714 for the observation on 20210806, with LRFS and 2DFS for the leading part of a mean pulse profile. 0 6 12 200 400 600 800 Pulse No. I/ bin J1910+1117g 20230214 0 20 Longitude ( ) 0 1 I/Ipeak 0 10 E/ E 0 6 12 1000 1200 1400 1600 1800 Pulse No. I/ bin J1910+1117g 20230214 0 20 Longitude ( ) 0 1 I/Ipeak 0 10 E/ E [PITH_FULL_IMAGE:figures/full_fig_p188_547.png] view at source ↗
Figure 545
Figure 545. Figure 545: Single pulse sequence of PSR J1910+0714 from the FAST observation on 20210806. 0 20 40 60 80 100 120 E/ E 0 5 10 15 Number (× 0.35) J1910+0714 20210806 0.0 0.5 1.0 1.5 2.0 2.5 I/<I> [PITH_FULL_IMAGE:figures/full_fig_p188_545.png] view at source ↗
Figure 546
Figure 546. Figure 546: On-pulse energy histogram of single pulses of PSR J1910+0714 from the FAST observation on 20210806. PSR J1910+0714 was discovered using the 305 m radio telescope at Arecibo (Nice et al. 1995). Drifting behavior was reported by Song et al. (2023). The FAST observed this pulsar on 20210806 for 5 minutes, deriving a rotation period P = 2.7122 s and a dispersion measure DM = 124.5 cm−3 pc. The single pulse s… view at source ↗
Figure 548
Figure 548. Figure 548: Single pulse sequences of PSR J1910+1117g from the FAST observation on 20230214 [PITH_FULL_IMAGE:figures/full_fig_p188_548.png] view at source ↗
Figure 549
Figure 549. Figure 549: On-pulse energy histogram of single pulses of PSR J1910+1117g from the FAST observation on 20230214, with energy val￾ues averaged for every 4 periods. 0 15 30 20 40 60 80 100 120 140 160 Pulse No. I/ bin J1910+1231 20190319 10 0 10 Longitude ( ) 0 1 I/Ipeak 0 100 E/ E [PITH_FULL_IMAGE:figures/full_fig_p189_549.png] view at source ↗
Figure 552
Figure 552. Figure 552: Single pulse sequences of PSR J1910-0219g from the FAST observation on 20250619. This pulsar was observed by FAST on 20230214 for 44 minutes, deriving a rotation period P = 1.3213 s and a dispersion measure DM = 296.7 cm−3 pc. Single pulse sequences in [PITH_FULL_IMAGE:figures/full_fig_p189_552.png] view at source ↗
Figure 553
Figure 553. Figure 553: On-pulse energy histogram of single pulses of PSR J1910- 0219g from the FAST observation on 20250619. LRFS 0.25 0.50 0.75 Norm. Power 10 0 10 Longitude ( ) 0 1 Norm. I 0.1 0.2 0.3 0.4 0.5 F r e q. ( 1 / P 3 ) J1910-0219g 20250619 2DFS: W 0.2 0.4 Norm. Power 250 0 250 Freq. (1/P2) 0 1 Norm. P. 0.1 0.2 0.3 0.4 0.5 F r e q. ( 1 / P 3 ) J1910-0219g 20250619 [PITH_FULL_IMAGE:figures/full_fig_p190_553.png] view at source ↗
Figure 555
Figure 555. Figure 555: Single pulse sequences of PSR J1910-0309 from the FAST observation on 20250317. Fluctuation spectra in [PITH_FULL_IMAGE:figures/full_fig_p190_555.png] view at source ↗
Figure 557
Figure 557. Figure 557: Single pulse sequence of PSR J1911+1440g from the FAST observation on 20240125, and a zoomed-in view of pulses No.1001-1299. 5 0 5 10 15 20 E/ E 0 50 100 150 200 Number J1911+1440g 20240125 5 0 5 10 15 20 25 I/<I> [PITH_FULL_IMAGE:figures/full_fig_p191_557.png] view at source ↗
Figure 556
Figure 556. Figure 556: Fluctuation analysis of PSR J1910-0309 for the observation on 20250317, with LRFS (top-left), and 2DFS for the leading (top-right), central (bottom-left) and trailing (bottom-right) parts of a mean pulse profile. This pulsar was observed by FAST on 20240125 and 20250326, each for a duration of 15 minutes. From the data of 20240125, a rotation period P = 0.5825 s and a disper￾sion measure DM = 86.9 cm−3 p… view at source ↗
Figure 559
Figure 559. Figure 559: Distribution of period numbers for continuous nulling PN against period numbers for adjacent pulses PE of PSR J1911+1440g ob￾served by FAST on 20240125, as well as the duration histograms for the emission and null shown in the top and right panels, respectively. 0 20 40 60 80 Nulling degree ( °) 0 10 20 30 40 Number NE: =80(12) EN: =79(14) 0 10 20 30 40 50 Nulling scale (P) 0 5 10 15 Number NE: s=14(10) … view at source ↗
Figure 561
Figure 561. Figure 561: Single pulse sequences of PSR J1912+2525 from the FAST observation on 20210822. LRFS 0.4 0.8 Norm. Power 5 0 5 Longitude ( ) 0 1 Norm. I 0.1 0.2 0.3 0.4 F r e q. ( 1 / P 3 ) J1912+2525 20210822 2DFS: W 0.4 0.8 Norm. Power 250 0 250 Freq. (1/P2) 0 1 Norm. P. 0.1 0.2 0.3 0.4 F r e q. ( 1 / P 3 ) J1912+2525 20210822 [PITH_FULL_IMAGE:figures/full_fig_p192_561.png] view at source ↗
Figure 560
Figure 560. Figure 560: Histograms of the nulling degree and nulling scale for PSR J1911+1440g observed by FAST on 20240125. 1/P3 = 0.418 ± 0.004 and 1/P2 = 52 ± 3, corresponding to P3 = 2.39±0.02 periods and P2 = 7.0±0.4 ◦ . There is also a lower-frequency negative drift feature, with the centroid fre￾quencies of 1/P3 = 0.106 ± 0.003 and 1/P2 = −72 ± 4, yielding P3 = 9.4±0.2 periods and P2 = −5.0±0.3, which seem to be superimp… view at source ↗
Figure 562
Figure 562. Figure 562: Fluctuation analysis of PSR J1912+2525 for the observation on 20210822, with LRFS and 2DFS for the on-pulse region of a mean pulse profile [PITH_FULL_IMAGE:figures/full_fig_p192_562.png] view at source ↗
Figure 563
Figure 563. Figure 563: Single pulse sequences of PSR J1913+0006g from the FAST observation on 20250813. LRFS 0.3 0.6 0.9 Norm. Power 25 0 Longitude ( ) 0 1 Norm. I T 0.1 0.2 0.3 0.4 0.5 F r e q. ( 1 / P 3 ) J1913+0006g 20250813 2DFS: T 0.4 0.8 Norm. Power 200 0 200 Freq. (1/P2) 0 1 Norm. P. 0.1 0.2 0.3 0.4 0.5 F r e q. ( 1 / P 3 ) J1913+0006g 20250813 [PITH_FULL_IMAGE:figures/full_fig_p193_563.png] view at source ↗
Figure 566
Figure 566. Figure 566: On-pulse energy histogram of single pulses of PSR J1913+0657 from the FAST observation on 20210422. This pulsar was observed by FAST on 20250709 and 20250813 for 5 and 15 minutes, respectively. From the longer observation, a rotation period P = 1.6325 s and a dis￾persion measure DM = 128.7 cm−3 pc were derived. Single pulse sequences in [PITH_FULL_IMAGE:figures/full_fig_p193_566.png] view at source ↗
Figure 564
Figure 564. Figure 564: Fluctuation analysis of PSR J1913+0006g for the FAST ob￾servation on 20250813, with LRFS and 2DFS for the trailing profile part of a mean pulse profile. 0 8 16 50 100 150 200 Pulse No. I/ bin J1913+0657 20210422 10 0 10 Longitude ( ) 0 1 I/Ipeak 0 20 E/ E [PITH_FULL_IMAGE:figures/full_fig_p193_564.png] view at source ↗
Figure 569
Figure 569. Figure 569: Single pulse sequence of PSR J1913+0936 from the FAST observation on 20200223. 5 0 5 10 15 20 25 E/ E 0 25 50 75 100 125 Number J1913+0936 20200223 1 0 1 2 3 4 I/<I> [PITH_FULL_IMAGE:figures/full_fig_p194_569.png] view at source ↗
Figure 570
Figure 570. Figure 570: On-pulse energy histogram of single pulses of PSR J1913+0936 from the FAST observation on 20200223. degrees. Further observations are required in order to analyze the intensity decrease. 4.223. J1913+0657 PSR J1913+0657 was discovered in the PALFA survey us￾ing the Arecibo Telescope (Lyne et al. 2017). The pulsar was observed by FAST on 20210422 for 5 min￾utes. The single pulse sequence in [PITH_FULL_IM… view at source ↗
Figure 568
Figure 568. Figure 568: Fluctuation analysis of PSR J1913+0804g for the FAST ob￾servation on 20220504, with LRFS and 2DFS for the on-pulse region of a mean pulse profile. 0 8 16 50 100 150 200 Pulse No. I/ bin J1913+0936 20200223 10 0 10 Longitude ( ) 0 1 I/Ipeak 0 25 E/ E [PITH_FULL_IMAGE:figures/full_fig_p194_568.png] view at source ↗
Figure 573
Figure 573. Figure 573: Single pulse sequence of PSR J1913+11025 from the FAST observation on 20250823. 2.5 0.0 2.5 5.0 7.5 10.0 12.5 E/ E 0 50 100 150 200 Number J1913+11025 20250823 1 0 1 2 3 I/<I> [PITH_FULL_IMAGE:figures/full_fig_p195_573.png] view at source ↗
Figure 574
Figure 574. Figure 574: On-pulse energy histogram of single pulses of PSR J1913+11025 from the FAST observation on 20250823, with energy val￾ues smoothed over every 4 periods. 4.224. J1913+0804g PSR J1913+0804g was discovered in the FAST GPPS sur￾vey (Han et al. 2021, 2025). This pulsar was observed by FAST on 20220313 and 20220504, each for 15 minutes. From the observation on 20220504, a rotation period P = 0.4555 s and a disp… view at source ↗
Figure 572
Figure 572. Figure 572: Fluctuation analysis of PSR J1913+1011 for the observation on 20201206, with LRFS and 2DFS for the on-pulse region of a mean pulse profile. 0 4 200 400 600 800 Pulse No. I/ bin J1913+11025 20250823 0 50 Longitude ( ) 0 1 I/Ipeak 0 10 E/ E [PITH_FULL_IMAGE:figures/full_fig_p195_572.png] view at source ↗
Figure 577
Figure 577. Figure 577: Fluctuation analysis of PSR J1913+3732 for the observation on 20201128, with LRFS and 2DFS for the leading part of a mean pulse profile. energy histogram in [PITH_FULL_IMAGE:figures/full_fig_p196_577.png] view at source ↗
Figure 575
Figure 575. Figure 575: Single pulse sequences of PSR J1913+3732 from the FAST observation on 20201128. 0 25 50 75 100 125 150 E/ E 0 20 40 60 Number (× 0.2) J1913+3732 20201128 0.0 0.5 1.0 1.5 2.0 I/<I> [PITH_FULL_IMAGE:figures/full_fig_p196_575.png] view at source ↗
Figure 576
Figure 576. Figure 576: On-pulse energy histogram of single pulses of PSR J1913+3732 from the FAST observation on 20201128. feature with the centroid at 1/P3 = 0.056 ± 0.001, yielding a periodicity of P3 = 17.8 ± 0.4 periods. 4.225. J1913+0936 PSR J1913+0936 was discovered by Hulse & Taylor (1975) at 430 MHz using the Arecibo telescope. The pulsar was observed by FAST on 20200223 for 5 min￾utes, yielding a rotation period P = 1… view at source ↗
Figure 578
Figure 578. Figure 578: Single pulse sequence of PSR J1914+0219 from the FAST observation on 20240927, and zoomed-in view of pulses No. 1205-1415 [PITH_FULL_IMAGE:figures/full_fig_p196_578.png] view at source ↗
Figure 579
Figure 579. Figure 579: On-pulse energy histogram of single pulses of PSR J1914+0219 from the FAST observation on 20240927. LRFS 0.3 0.6 Norm. Power 0 20 Longitude ( ) 0 1 Norm. I L T 0.1 0.2 0.3 0.4 F r e q. ( 1 / P 3 ) J1914+0219 20240927 2DFS: L 0.3 0.6 Norm. Power 200 0 200 Freq. (1/P2) 0 1 Norm. P. 0.1 0.2 0.3 0.4 F r e q. ( 1 / P 3 ) J1914+0219 20240927 [PITH_FULL_IMAGE:figures/full_fig_p197_579.png] view at source ↗
Figure 580
Figure 580. Figure 580: Fluctuation analysis of PSR J1914+0219 for the observation on 20240927, with LRFS and 2DFS for the leading part of a mean pulse profile. 4.226. J1913+1011 PSR J1913+1011 was discovered in the Parkes Multibeam Pulsar Survey Morris et al. (2002). This pulsar was observed by FAST on 20201206 for 5 min￾utes, deriving a rotation period P = 0.0359 s and a dis￾persion measure DM = 178.6 cm−3 pc. Single pulse se… view at source ↗
Figure 582
Figure 582. Figure 582: Fluctuation analysis of PSR J1914+0838 for the observation on 20220511, with LRFS and 2DFS for the on-pulse region of a mean pulse profile. feature in 2DFS is characterized by the centroid frequencies of 1/P3 = 0.441 ± 0.001 and 1/P2 = −12 ± 4, correspond￾ing to drifting parameters of P3 = 2.266±0.003 periods and P2 = −30 ± 11 degrees. 4.229. J1914+0219 PSR J1914+0219 was discovered by Lorimer et al. (20… view at source ↗
Figure 583
Figure 583. Figure 583: Single pulse sequence of PSR J1914+1122 from the FAST observation on 20220513, and a zoomed-in view of pulses No.400-600. LRFS 0.25 0.50 0.75 Norm. Power 0 10 Longitude ( ) 0 1 Norm. I T 0.1 0.2 0.3 0.4 0.5 F r e q. ( 1 / P 3 ) J1914+1122 20220513 2DFS: T 0.4 0.8 Norm. Power 250 0 250 Freq. (1/P2) 0 1 Norm. P. 0.1 0.2 0.3 0.4 0.5 F r e q. ( 1 / P 3 ) J1914+1122 20220513 [PITH_FULL_IMAGE:figures/full_fig… view at source ↗
Figure 584
Figure 584. Figure 584: Fluctuation analysis of PSR J1914+1122 for the observation on 20220513, with LRFS and 2DFS for the trailing part of a mean pulse profile [PITH_FULL_IMAGE:figures/full_fig_p198_584.png] view at source ↗
Figure 585
Figure 585. Figure 585: Single pulse sequence of PSR J1915+0227 from the FAST observation on 20250813, and a zoomed-in view of pulses No. 1000-1300. LRFS 0.3 0.6 0.9 Norm. Power 25 0 25 Longitude ( ) 0 1 Norm. I L T 0.1 0.2 0.3 0.4 F r e q. ( 1 / P 3 ) J1915+0227 20250813 2DFS: L 0.4 0.8 Norm. Power 100 0 100 Freq. (1/P2) 0 1 Norm. P. 0.1 0.2 0.3 0.4 F r e q. ( 1 / P 3 ) J1915+0227 20250813 [PITH_FULL_IMAGE:figures/full_fig_p1… view at source ↗
Figure 587
Figure 587. Figure 587: Single pulse sequences of PSR J1915+0738 from the FAST observation on 20211010. 4.232. J1915+0227 PSR J1915+0227 was discovered in the Parkes Multibeam Pulsar Survey (Lorimer et al. 2006). Song et al. (2023) re￾ported the parameters of the negative drifting behavior as P3 = 9 ± 2 periods and P2 = 163+114 −70 degrees [PITH_FULL_IMAGE:figures/full_fig_p199_587.png] view at source ↗
Figure 588
Figure 588. Figure 588: Fluctuation analysis of PSR J1915+0738 for the observation on 20211010, with LRFS and 2DFS for the on-pulse region of a mean pulse profile. This pulsar was observed by FAST on 20201229 for 5 minutes and on 20250813 for 15 minutes. From the longer data, a rotation period P = 0.3173 s and a dispersion mea￾sure DM = 192.1 cm−3 pc were derived. The single pulse sequence and a zoomed-in view of pulses No. 100… view at source ↗
Figure 589
Figure 589. Figure 589: Single pulse sequences of PSR J1915+1009 from the FAST observation on 20200306. 4.234. J1915+1009 PSR J1915+1009 was discovered by the Arecibo telescope (Hulse & Taylor 1975). Negative drift feature with P3 = 4.2 ± 0.4 periods and P2 = −18+7 −9 degrees was reported by Song et al. (2023). This pulsar was observed by FAST on 20200306 and 20211118 for 5 minutes. From the data of 20200306, a rota￾tion period… view at source ↗
Figure 590
Figure 590. Figure 590: Fluctuation analysis of PSR J1915+1009 for the observation on 20200306, with LRFS and 2DFS for the on-pulse region of a mean pulse profile. sar was first reported by Wang et al. (2007) with a nulling fraction of 47% at 1518MHz. This pulsar was observed by FAST on 20200301 for 5 minutes, 20201230 for 20 minutes, 20210420 for 28 min￾utes, and 20220202 for 15 minutes. From data of 20210420, a rotation perio… view at source ↗
Figure 591
Figure 591. Figure 591: Single pulse sequences of PSR J1916+1023 from FAST ob￾servations on 20200301, 20201230 and 20220202 [PITH_FULL_IMAGE:figures/full_fig_p201_591.png] view at source ↗
Figure 592
Figure 592. Figure 592: On-pulse energy histogram of single pulses of PSR J1916+1023 from the FAST observation on 20210420. 0 5 10 Counts Ne=5(6) 0 6 12 18 Periods for emission PE (P) 0 30 60 90 P erio d s f or n ulls P N (P) NE EN 0 10 Counts Nn=24(29) [PITH_FULL_IMAGE:figures/full_fig_p202_592.png] view at source ↗
Figure 593
Figure 593. Figure 593: Distribution of period numbers for continuous nulling PN against period numbers for adjacent pulses PE of PSR J1916+1023 ob￾served by FAST on 20210420, as well as the duration histograms for the emission and null shown in the top and right panels, respectively. 4.235.2. Drifting and mode changing There are three drifting modes from the FAST observa￾tions, labeled by bars with different colors in [PITH_F… view at source ↗
Figure 596
Figure 596. Figure 596: A segment of single pulses of intensity I and PA from the FAST observation on 20210420 of PSR J1916+1023 [PITH_FULL_IMAGE:figures/full_fig_p202_596.png] view at source ↗
Figure 597
Figure 597. Figure 597: Single pulse sequence of PSR J1916+1030 from the FAST observation on 20220202, and a zoomed-in view of pulses No. 1050-1410. 4.236. J1916+1030 PSR J1916+1030 was first published by Taylor et al. (1993). The subpulse drifting was reported by Song et al. (2023), with P3 = 16 ± 1 periods and P2=33+75 −10 degrees. This pulsar was observed by FAST on 20220202 for 15 minutes, deriving a rotation period P = 0.6… view at source ↗
Figure 599
Figure 599. Figure 599: Single pulse sequences of PSR J1916+3224 from the FAST observation on 20210212. 0 10 20 30 E/ E 0 20 40 60 Number (× 0.5) J1916+3224 20210212 0 1 2 3 I/<I> [PITH_FULL_IMAGE:figures/full_fig_p204_599.png] view at source ↗
Figure 602
Figure 602. Figure 602: On-pulse energy histogram of single pulses of PSR J1917+0834 from the FAST observation on 20201123. have strong emission, and the single-pulse intensity could be up to 7 times than the average of this FAST observation. 4.239. J1918+26 PSR J1918+26 was discovered by the radio telescope Large Phased Array (LPA) (Tyulbashev et al. 2024). This pulsar was observed by FAST on 20240420 for 2 min￾utes, deriving … view at source ↗
Figure 605
Figure 605. Figure 605: Single pulse sequence of PSR J1919+0021 from the FAST observation on 20210702. The red and green bars represent normal or abnor￾mal modes. In the right subpanel, the on-pulse energy variation smoothed over every 3 periods is plotted against period, with a dashed line for the threshold to distinguish the normal and abnormal emission modes. 0 25 50 Number I = 0 J1919+0021 20210702 0 50 100 150 200 E/ E 0 1… view at source ↗
Figure 606
Figure 606. Figure 606: On-pulse energy histogram of single pulses of PSR J1919+0021 from the FAST observation on 20210111, with energy values smoothed over 3 periods. The red and green bars indicate the normal and abnormal modes. centroid of the main drift feature in 2DFS is characterized by frequencies of 1/P3 = 0.17 ± 0.01 and 1/P2 = −24 ± 2, corresponding to periodicities of P3 = 5.9 ± 0.2 periods and P2 = −15 ± 1 degrees. … view at source ↗
Figure 607
Figure 607. Figure 607: Mean polarization profiles (the top panel) for the normal (red) and abnormal (green) emission modes of PSR J1919+0021 observed on 20210702, as well as the averaged PA curves (the bottom panel). Profiles in the top panel are normalized by their respective peaks. PSR J1919+0021 was discovered by the Mark 1A radio telescope at Jodrell Bank (Davies et al. 1973). Rankin (1986) reported the pulsar with the mod… view at source ↗
Figure 608
Figure 608. Figure 608: Single pulse sequences of PSR J1919+0134 from FAST ob￾servations on 20220310 and 20230328. – to be continued [PITH_FULL_IMAGE:figures/full_fig_p206_608.png] view at source ↗
Figure 609
Figure 609. Figure 609: On-pulse energy histograms of single pulses of PSR J1916+1023 from FAST observations on 20220310 and 2023032. ing modes. It’s the first time revealing nulling and the drift rate changingfrom the highly sensitive FAST observations. Based on the on-pulse integral energy histograms in [PITH_FULL_IMAGE:figures/full_fig_p207_609.png] view at source ↗
Figure 608
Figure 608. Figure 608: Continued. 0 20 40 60 80 100 120 E/ E 0 10 20 30 40 50 Number (× 0.15) J1919+0134 20220310 0.0 0.5 1.0 1.5 2.0 2.5 3.0 I/<I> 0 20 40 60 80 100 E/ E 0 10 20 30 40 Number (× 0.15) J1919+0134 20230328 0.0 0.5 1.0 1.5 2.0 2.5 3.0 I/<I> [PITH_FULL_IMAGE:figures/full_fig_p207_608.png] view at source ↗
Figure 611
Figure 611. Figure 611: Single pulse sequences of PSR J1919+0727g from the FAST observation on 20230818. LRFS 0.25 0.50 0.75 Norm. Power 10 0 10 Longitude ( ) 0 1 Norm. I 0.1 0.2 0.3 0.4 F r e q. ( 1 / P 3 ) J1919+0727g 20230818 2DFS: W 0.4 0.8 Norm. Power 250 0 250 Freq. (1/P2) 0 1 Norm. P. 0.1 0.2 0.3 0.4 F r e q. ( 1 / P 3 ) J1919+0727g 20230818 [PITH_FULL_IMAGE:figures/full_fig_p208_611.png] view at source ↗
Figure 612
Figure 612. Figure 612: Fluctuation analysis of PSR J1919+0727g for the observation on 20230818, with LRFS and 2DFS for the on-pulse region of a mean pulse profile [PITH_FULL_IMAGE:figures/full_fig_p208_612.png] view at source ↗
Figure 615
Figure 615. Figure 615: Mean polarization profiles (the top panel) for the weak and bright emission modes of PSR J1919+1527g observed on 20230214. Pro￾files in the top panel are normalized by their respective peaks. sity variation is temporally low-frequency modulated, with a centroid frequency of f3 = 0.059 ± 0.003 (P3 = 17.0 ± 0.8 periods). 4.243. J1919+1527g PSR J1919+1527g was discovered in the FAST GPPS sur￾vey (Han et al.… view at source ↗
Figure 613
Figure 613. Figure 613: Single pulse sequences of PSR J1919+1527g from the FAST observation on 20230214. The red and green bars represent weak or bright emission modes. In the right subpanel, the on-pulse energy varia￾tion smoothed over every 5 periods is plotted against period, with a dashed line for the threshold to distinguish the weak and bright emission modes. 0 100 200 Number I = 0 J1919+1527 20230214 2 0 2 4 6 E/ E 5 0 5… view at source ↗
Figure 614
Figure 614. Figure 614: On-pulse energy histogram of single pulses of PSR J1919+1527g from the FAST observation on 20230214, with energy val￾ues smoothed over 5 periods. The red and green bars indicate the weak and bright emission modes. This pulsar was observed by FAST on 20230818 for 15 minutes, and a rotation period P = 0.8669 s and a disper￾sion measure DM = 183.1 cm−3 pc were derived. Single pulse sequences in [PITH_FULL_… view at source ↗
Figure 616
Figure 616. Figure 616: Single pulse sequences of PSR J1919+2621 from the FAST observation on 20210801. LRFS 0.25 0.50 Norm. Power 10 0 Longitude ( ) 0 1 Norm. I 0.1 0.2 0.3 0.4 F r e q. ( 1 / P 3 ) J1919+2621 20210801 2DFS: W 0.3 0.6 Norm. Power 250 0 250 Freq. (1/P2) 0 1 Norm. P. 0.1 0.2 0.3 0.4 F r e q. ( 1 / P 3 ) J1919+2621 20210801 [PITH_FULL_IMAGE:figures/full_fig_p210_616.png] view at source ↗
Figure 617
Figure 617. Figure 617: Fluctuation analysis of PSR J1919+2621 for the observation on 20210801, with LRFS and 2DFS for the on-pulse region of a mean pulse profile. 0 15 0 1000 2000 3000 4000 5000 Pulse No. I/ bin J1921+0851g 20230510 10 0 10 Longitude ( ) 0 1 I/Ipeak 0 50 E/ E 0 15 2350 2400 2450 2500 2550 2600 Pulse No. I/ bin J1921+0851g 20230510 10 0 10 Longitude ( ) 0 1 I/Ipeak 0 50 E/ E [PITH_FULL_IMAGE:figures/full_fig_p… view at source ↗
Figure 621
Figure 621. Figure 621: Distribution of period numbers for continuous nulling PN against period numbers for adjacent pulses PE of PSR J1921+0851g ob￾served by FAST on 20230510, as well as the duration histograms for the emission and null shown in the top and right panels, respectively. 0 20 40 60 80 Nulling degree ( °) 0 5 10 15 20 Number NE: =79(17) EN: =79(16) 0 50 100 150 200 250 300 350 Nulling scale (P) 0.0 2.5 5.0 7.5 10.… view at source ↗
Figure 619
Figure 619. Figure 619: Continued. 0 20 40 60 80 E/ E 0 200 400 600 8001000 Number J1921+0851g 20230510 0 10 20 30 40 I/<I> [PITH_FULL_IMAGE:figures/full_fig_p211_619.png] view at source ↗
Figure 620
Figure 620. Figure 620: On-pulse energy histogram of PSR J1921+0851g from the FAST observations on 20230510. period. For emission segments that continued for more than 4 periods, drifting parameters D and P2 are estimated from the correlation method and plotted in [PITH_FULL_IMAGE:figures/full_fig_p211_620.png] view at source ↗
Figure 625
Figure 625. Figure 625: On-pulse energy histogram of single pulses of PSR J1921+1340g from the FAST observation on 20230214. 0 15 30 25 50 75 100 125 150 175 200 Pulse No. I/ bin J1921+2003 20210208 0 20 Longitude ( ) 0 1 I/Ipeak 0 50 E/ E 0 15 30 225 250 275 300 325 350 375 400 Pulse No. I/ bin J1921+2003 20210208 0 20 Longitude ( ) 0 1 I/Ipeak 0 50 E/ E [PITH_FULL_IMAGE:figures/full_fig_p212_625.png] view at source ↗
Figure 626
Figure 626. Figure 626: Single pulse sequences of PSR J1921+2003 from the FAST observation on 20200514. in [PITH_FULL_IMAGE:figures/full_fig_p212_626.png] view at source ↗
Figure 628
Figure 628. Figure 628: Single pulse sequence of PSR J1921+2153 from the FAST observation on 20200419. 0 50 100 150 200 E/ E 0 10 20 30 40 Number (× 0.18) J1921+2153 20200419 0.0 0.5 1.0 1.5 I / <I> [PITH_FULL_IMAGE:figures/full_fig_p213_628.png] view at source ↗
Figure 627
Figure 627. Figure 627: Fluctuation analysis of PSR J1921+2003 for the observation on 20200514, with LRFS (top-left), and 2DFS for the on-pulse region (top￾right), leading part (bottom-left) and trailing part (bottom-right) of a mean pulse profile. PSR J1921+2153 was discovered by Hewish et al. (1968) at 81.5 MHz at the Mullard Radio Astronomy Observa￾tory. The pulsar has been reported with a nulling fraction of ≤ 0.25% by Ritc… view at source ↗
Figure 631
Figure 631. Figure 631: Single pulse sequence of PSR J1921+34 from the FAST ob￾servation on 20240727. 5 0 5 10 15 E/ E 0 10 20 30 40 50 Number J1921+34 20240727 1 0 1 2 3 4 I/<I> [PITH_FULL_IMAGE:figures/full_fig_p214_631.png] view at source ↗
Figure 630
Figure 630. Figure 630: Fluctuation analysis of PSR J1921+2153 for the observation on 20200419, with LRFS (top-left), and 2DFS for the leading part (top￾right), central part (bottom-left) and trailing part (bottom-right) of a mean pulse profile. 1/P3 = 0.253 ± 0.002 and 1/P2 = −49 ± 6, which cor￾respond to P3 = 3.95 ± 0.03 periods and P2 = −7 ± 1 ◦ . 4.249. J1921+34 PSR J1921+34 was discovered by Tyul’bashev et al. (2022) with … view at source ↗
Figure 633
Figure 633. Figure 633: Single pulse sequences of PSR J1922+1512g from the FAST observation on 20220511. 5 0 5 10 15 E/ E 0 20 40 60 80 100 Number J1922+1512g 20220511 2 0 2 4 6 8 I/<I> [PITH_FULL_IMAGE:figures/full_fig_p215_633.png] view at source ↗
Figure 634
Figure 634. Figure 634: On-pulse energy histogram of single pulses of PSR J1922+1512g from the FAST observation on 20220511. is estimated to be 37±2% from the on-pulse integral energy histogram in [PITH_FULL_IMAGE:figures/full_fig_p215_634.png] view at source ↗
Figure 637
Figure 637. Figure 637: Single pulse sequence of PSR J1922+2018 from the FAST observation on 20210208. PSR J1922+2110 was discovered by the Mark 1A radio telescope at Jodrell Bank (Davies et al. 1973). Weltevrede et al. (2007) reported three sharp features with 0.19, 0.24, and 0.28 cycle per period (cpp) in LRFS and 2DFS at 92cm, and they found the 0.24 cpp feature is in the first half of the data and the other two in the last … view at source ↗
Figure 636
Figure 636. Figure 636: Fluctuation analysis of PSR J1922+1733 for the observation on 20200514, with LRFS (top-left), and 2DFS for the on-pulse region (top￾right), leading part (bottom-left) and trailing part (bottom-right) of a mean pulse profile. a temporal modulation, while the latter has a positive drift￾ing behavior. LRFS and 2DFS of the leading part (-5◦ to 1◦ ) and trailing part (9◦ to 19◦ ) in the profile shown in [PIT… view at source ↗
Figure 639
Figure 639. Figure 639: Single pulse sequence of PSR J1922+2110 from the FAST observation on 20210706. The green and red bars represent normal or abnor￾mal modes. In the right subpanel, the on-pulse energy variation smoothed over every 5 periods is plotted against period, with a dashed line for the threshold to distinguish the two emission modes. 0 25 50 Number I = 0 J1922+2110 20210706 0 20 40 60 80 100 E/ E 0.0 0.5 1.0 1.5 2.… view at source ↗
Figure 638
Figure 638. Figure 638: Fluctuation analysis of PSR J1922+2018 for the observation on 20210208, with LRFS (top-left), and 2DFS for the on-pulse region (top￾right), leading part (bottom-left) and trailing part (bottom-right) of a mean pulse profile. displays a positive drift feature with centroid frequencies of 1/P3 = 0.360 ± 0.005 and 1/P2 = 9 ± 3, corresponding to periodicities of P3 = 2.78±0.04 periods and P2 = 42±12◦ . 4.254… view at source ↗
Figure 641
Figure 641. Figure 641: Mean polarization profiles (the top panel) for the normal (green) and abnormal (red) emission modes of PSR J1922+2110 observed on 20210706, as well as the averaged PA curves (the bottom panel). Profiles in the top panel are normalized by their respective peaks. Normal: LRFS 0.25 0.50 Norm. Power 10 0 10 Longitude ( ) 0 1 Norm. I L C T 0.1 0.2 0.3 0.4 F r e q. ( 1 / P 3 ) J1922+2110 20210706 Normal: 2DFS:… view at source ↗
Figure 643
Figure 643. Figure 643: Single pulse sequence of PSR J1923+1706 from the FAST observation on 20190321. 5 0 5 10 15 20 25 30 E/ E 0 50 100 150 200 Number J1923+1706 20190321 0.5 0.0 0.5 1.0 1.5 2.0 2.5 I/<I> [PITH_FULL_IMAGE:figures/full_fig_p218_643.png] view at source ↗
Figure 642
Figure 642. Figure 642: Fluctuation analysis of the normal emission mode of PSR J1922+2110 for the observation on 20210706, with LRFS and 2DFS for the trailing part of a mean pulse profile. corresponding to periodicities of P3 = 12 ± 1 periods and P2 = −13±1 ◦ . 2DFS of the central and trailing profile parts exhibit a temporal modulation feature, with the centroid fre￾quencies of 1/P3 = 0.05 ± 0.01 (P3 = 20 ± 2 periods) and 0.0… view at source ↗
Figure 646
Figure 646. Figure 646: Single pulse sequence of PSR J1924+1923g from the FAST observation on 20250214, and a zoomed-in view of pulses No. 101-300. The red and green bars represent weak or bright emission modes. In the right subpanel, the on-pulse energy variation is plotted against period, with a dashed line for the threshold to distinguish the two emission modes. 0 200 400 Number I = 0 J1924+1923g 20250214 10 0 10 20 E/ E 4 2… view at source ↗
Figure 645
Figure 645. Figure 645: Fluctuation analysis of PSR J1923+1706 for the observation on 20190321, with LRFS (top-left), and 2DFS for the leading part (top￾right), central part (bottom-left) and trailing part (bottom-right) of a mean pulse profile. 4.256. J1924+2037g PSR J1924+2037g was discovered in the FAST GPPS sur￾vey with a very nulling behavior (Han et al. 2021, 2025). This pulsar was observed by FAST on 20230717 for 96 minu… view at source ↗
Figure 648
Figure 648. Figure 648: Distribution of period numbers for the weak emission mode PW against period numbers for adjacent bright mode PB of PSR J1924+1923g observed by FAST on 20250214, as well as the duration his￾tograms for the bright and weak emission modes shown in the top and right panels, respectively. 10 5 0 5 10 Longitude ( ) 0.0 1.5 3.0 Normalized I J1924+1923g 20250214 Aver. Prof. Weak Bright [PITH_FULL_IMAGE:figures/… view at source ↗
Figure 650
Figure 650. Figure 650: Single pulse sequences of PSR J1924+2037g from the FAST observation on 20230717. 5 0 5 10 15 20 E/ E 0 200 400 600 800 Number J1924+2037g 20230717 10 0 10 20 30 40 50 60 I/<I> [PITH_FULL_IMAGE:figures/full_fig_p220_650.png] view at source ↗
Figure 649
Figure 649. Figure 649: Mean profiles for the weak (red dashed) and bright (green dotted) emission modes of PSR J1924+1923g observed on 20250214, which are normalized by the peak of the mean pulse profile of all periods. This pulsar was observed by FAST on 20191226 for 5 min￾utes, deriving a rotation period P = 0.2378 s and a dis￾persion measure DM = 226.6 cm−3 pc. The single pulse sequence and a zoomed-in view of pulses No. 10… view at source ↗
Figure 652
Figure 652. Figure 652: Distribution of period numbers for continuous nulling PN against period numbers for adjacent pulses PE of PSR J1924+2037g ob￾served by FAST on 20230717, as well as the duration histograms for the emission and null shown in the top and right panels, respectively. 0 20 40 60 80 Nulling degree ( °) 0 5 10 15 20 Number NE: =78(20) EN: =78(20) 0 200 400 600 800 Nulling scale (P) 0 5 10 15 20 Number NE: s=116(… view at source ↗
Figure 654
Figure 654. Figure 654: Single pulse sequence of PSR J1924+2040 from the FAST observation on 20191226, and a zoomed-in view of pulses No. 1000-1200. LRFS 0.3 0.6 0.9 Norm. Power 25 0 25 Longitude ( ) 0 1 Norm. I 0.1 0.2 0.3 0.4 F r e q. ( 1 / P 3 ) J1924+2040 20191226 2DFS: W 0.3 0.6 Norm. Power 100 0 100 Freq. (1/P2) 0 1 Norm. P. 0.1 0.2 0.3 0.4 F r e q. ( 1 / P 3 ) J1924+2040 20191226 [PITH_FULL_IMAGE:figures/full_fig_p221_6… view at source ↗
Figure 653
Figure 653. Figure 653: Histograms of the nulling degree and nulling scale for PSR J1924+2037g observed by FAST on 20230717. 1/P3 = 0.106 ± 0.002 and 1/P2 = −12 ± 4, corresponding to periodicities of P3 = 9.4±0.2 periods and P2 = −30±10 degrees. The drift feature in 2DFS of the trailing profile part is characterized by frequencies of 1/P3 = 0.099±0.002 and 1/P2 = −31 ± 4, yielding P3 = 10.1 ± 0.2 periods and P2 = −12 ± 2 degree… view at source ↗
Figure 655
Figure 655. Figure 655: Fluctuation analysis of PSR J1924+2040 for the observation on 20191226, with LRFS and 2DFS for the on-pulse phase region of the mean pulse profile [PITH_FULL_IMAGE:figures/full_fig_p221_655.png] view at source ↗
Figure 656
Figure 656. Figure 656: Single pulse sequence of PSR J1925+19 from the FAST ob￾servation on 20221002. 0 10 20 30 40 E/ E 0 20 40 60 Number J1925+19 20221002 0.0 0.5 1.0 1.5 2.0 2.5 3.0 I/<I> [PITH_FULL_IMAGE:figures/full_fig_p222_656.png] view at source ↗
Figure 658
Figure 658. Figure 658: Fluctuation analysis of PSR J1925+19 for the observation on 20221002, with LRFS (top-left), and 2DFS for the on-pulse phase region (top-right), leading part (bottom-left), and trailing part (bottom-right) of a mean pulse profile. 2DFS, the main drift feature is positive with the centroid of 1/P3 = 0.388 ± 0.005 (P3 = 2.58 ± 0.03 periods) and 1/P2 = 59 ± 3 (P2 = 6.1 ± 0.3 ◦ ), which has a wider tem￾poral … view at source ↗
Figure 661
Figure 661. Figure 661: Fluctuation analysis of PSR J1926+0431 from the FAST ob￾servation on 20210702, with LRFS and 2DFS for the on-pulse region of a mean pulse profile. 0 8 16 200 400 600 800 Pulse No. I/ bin J1926+0737_MP 20201226 10 0 10 Longitude ( ) 0 1 I/Ipeak 0 25 E/ E 0 8 16 200 400 600 800 Pulse No. I/ bin J1926+0737_IP 20201226 15 10 Longitude ( ) 0 1 I/Ipeak 0 5 E/ E [PITH_FULL_IMAGE:figures/full_fig_p223_661.png] view at source ↗
Figure 659
Figure 659. Figure 659: Single pulse sequences of PSR J1926+0431 from the FAST observation on 20210702. 0 20 40 60 80 100 E/ E 0 20 40 60 Number (× 0.3) J1926+0431 20210702 0.0 0.5 1.0 1.5 2.0 2.5 I/<I> [PITH_FULL_IMAGE:figures/full_fig_p223_659.png] view at source ↗
Figure 660
Figure 660. Figure 660: On-pulse energy histogram of single pulses of PSR J1926+0431 from the FAST observation on 20210702. PSR J1926+0737 was discovered from a re-analysis of the Parkes multi-beam pulsar survey using artificial neural net￾works (Eatough et al. 2010). This pulsar was observed by FAST on 20201226 for 5 min￾utes, deriving a rotation period P = 0.3181 s and a dis￾persion measure DM = 159.0 cm−3 pc. Single pulse se… view at source ↗
Figure 665
Figure 665. Figure 665: Mean profiles of the weak (red dashed) and bright (green dotted) emission modes of PSR J1926+0737 for main pulse (upper) and in￾terpulse (lower) observed on 20201226. Profiles are normalized by the peak of the mean profile of all periods. 0 20 40 50 100 150 200 250 300 Pulse No. I/ bin J1926+1434 20210317 0 50 Longitude ( ) 0 1 I/Ipeak 0 100 E/ E 0 20 40 350 400 450 500 550 600 650 Pulse No. I/ bin J1926… view at source ↗
Figure 664
Figure 664. Figure 664: Correlation of occurrence of weak and bright emission states between main pulse and interpulse of PSR J1926+0737 from the FAST ob￾servation on 20201226. the on-pulse energy histogram shown in [PITH_FULL_IMAGE:figures/full_fig_p224_664.png] view at source ↗
Figure 666
Figure 666. Figure 666: Single pulse sequences of PSR J1926+1434 from the FAST observation on 20210317 [PITH_FULL_IMAGE:figures/full_fig_p224_666.png] view at source ↗
Figure 667
Figure 667. Figure 667: On-pulse energy histogram of single pulses of PSR J1926+1434 from the FAST observation on 20210317. tween the two modes is in intensity, with averaged profiles of the two emission modes displayed in [PITH_FULL_IMAGE:figures/full_fig_p225_667.png] view at source ↗
Figure 668
Figure 668. Figure 668: Fluctuation analysis of PSR J1926+1434 for the observation on 20210317, with LRFS (top-left), and 2DFS for the on-pulse phase region (top-right), leading part (bottom-left) and trailing part (bottom-right) of a mean pulse profile. (P3 = 6.6 ± 0.1 periods) and 1/P2 = −24 ± 4 (P2 = −15 ± 2 ◦ ) for the trailing profile part. In addition to the subpulse drifting, 2DFS of the leading component also has a low-… view at source ↗
Figure 669
Figure 669. Figure 669: Single pulse sequences of PSR J1926+1631g from the FAST observation on 20211226. sure DM = 451.4 cm−3 pc were derived. Single pulse se￾quence and a zoomed-in view of pulses No. 1-100 of the ob￾servation on 20231228 are shown in [PITH_FULL_IMAGE:figures/full_fig_p226_669.png] view at source ↗
Figure 670
Figure 670. Figure 670: Fluctuation analysis of PSR J1926+1631g for the observation on 20211226, with LRFS (top-left), and 2DFS for the on-pulse phase region (top-right), leading part (bottom-left) and trailing part (bottom-right) of a mean pulse profile. PSR J1927+0911 was discovered in the Parkes 20-cm multibeam pulsar survey of the Galactic plane (Lorimer et al. 2006). The negative subpulse drifting was reported by Song et a… view at source ↗
Figure 673
Figure 673. Figure 673: Single pulse sequence of PSR J1927+08 from the FAST observation on 20210706. The green and red bars represent bright or weak emission modes. In the right subpanel, the on-pulse energy variation smoothed over every 3 periods is plotted against period. 0 50 100 Number J1927+08 20240917 5 10 15 20 E/ E 0.5 1.0 1.5 2.0 I/<I> [PITH_FULL_IMAGE:figures/full_fig_p227_673.png] view at source ↗
Figure 674
Figure 674. Figure 674: On-pulse energy histogram of single pulses of PSR J1927+08 from the FAST observation on 20240917, with energy values smoothed over 3 periods. The red and green bars indicate the weak and bright emission modes [PITH_FULL_IMAGE:figures/full_fig_p227_674.png] view at source ↗
Figure 672
Figure 672. Figure 672: Fluctuation analysis of PSR J1926+1928 for the observation on 20231228, with LRFS and 2DFS for the on-pulse phase region of the mean pulse profile. 0 8 16 100 200 300 400 500 Pulse No. I/ bin J1927+08 20240917 10 0 10 Longitude ( ) 0 1 I/Ipeak 10 20 E/ E 0 8 16 600 700 800 900 1000 1100 Pulse No. I/ bin J1927+08 20240917 10 0 10 Longitude ( ) 0 1 I/Ipeak 10 20 E/ E [PITH_FULL_IMAGE:figures/full_fig_p227… view at source ↗
Figure 675
Figure 675. Figure 675: Mean polarization profiles (the top panel) for the bright (green) and weak (red) emission modes of PSR J1927+08 observed on 20240917, as well as the averaged PA curves (the bottom panel). Profiles in the top panel are normalized by their respective peaks. 0 5 10 100 200 300 400 500 Pulse No. I/ bin J1927+0911 20201220 0 10 Longitude ( ) 0 1 I/Ipeak 0 10 E/ E 0 5 10 600 700 800 900 1000 Pulse No. I/ bin J… view at source ↗
Figure 676
Figure 676. Figure 676: Single pulse sequences of PSR J1927+0911 from the FAST observation on 20201220. This pulsar was observed by FAST on 20210608 for 5 min￾utes, deriving a rotation period P = 1.4309 s and a disper￾sion measure DM = 185.7 cm−3 pc. Single pulse sequences are shown in [PITH_FULL_IMAGE:figures/full_fig_p228_676.png] view at source ↗
Figure 679
Figure 679. Figure 679: On-pulse energy histogram of single pulses of PSR J1927+2234 from the FAST observation on 20210608. LRFS 0.4 0.8 Norm. Power 20 0 Longitude ( ) 0 1 Norm. I L C T 0.1 0.2 0.3 0.4 F r e q. ( 1 / P 3 ) J1927+2234 20210608 2DFS: W 0.4 0.8 Norm. Power 200 0 200 Freq. (1/P2) 0 1 Norm. P. 0.1 0.2 0.3 0.4 F r e q. ( 1 / P 3 ) J1927+2234 20210608 2DFS: L 0.4 0.8 Norm. Power 200 0 200 Freq. (1/P2) 0 1 Norm. P. 0.1… view at source ↗
Figure 681
Figure 681. Figure 681: Single pulse sequence of PSR J1928-0108 from the FAST observation on 20211216. 0 10 20 30 40 E/ E 0 10 20 30 Number (× 0.6) J1928-0108 20211216 0 1 2 3 4 5 I/<I> [PITH_FULL_IMAGE:figures/full_fig_p229_681.png] view at source ↗
Figure 682
Figure 682. Figure 682: On-pulse energy histogram of single pulses of PSR J1928- 0108 from the FAST observation on 20211216. energy histogram ( [PITH_FULL_IMAGE:figures/full_fig_p229_682.png] view at source ↗
Figure 680
Figure 680. Figure 680: Fluctuation analysis of PSR J1927+2234 for the observation on 20210608, with LRFS (top-left), and 2DFS for the on-pulse phase region (top-right), leading part (bottom-left) and trailing part (bottom-right) of a mean pulse profile. 0 15 30 20 40 60 80 100 120 Pulse No. I/ bin J1928-0108 20211216 10 0 Longitude ( ) 0 1 I/Ipeak 0 25 E/ E [PITH_FULL_IMAGE:figures/full_fig_p229_680.png] view at source ↗
Figure 683
Figure 683. Figure 683: Single pulse sequence of PSR J1928+0840g from the FAST observation on 20251019, and a zoomed-in view of pulses No. 150-340. 5 0 5 10 15 20 E/ E 0 25 50 75 100 125 Number J1928+0840g 20251019 1 0 1 2 3 4 5 I/<I> [PITH_FULL_IMAGE:figures/full_fig_p230_683.png] view at source ↗
Figure 686
Figure 686. Figure 686: On-pulse energy histogram of single pulses of PSR J1928+1923 from the FAST observation on 20200804. Additionally, there are also bright subpulses sometimes ap￾pearing in the phase range of the central component. 4.268. J1928+0840g PSR J1928+0840g was discovered in the FAST GPPS sur￾vey (Han et al. 2021, 2025). This pulsar was observed by FAST on 20250810 for 5 min￾utes and 20251019 for 15 minutes. From t… view at source ↗
Figure 688
Figure 688. Figure 688: Fluctuation analysis of PSR J1929+00 for the observation on 20210710, with LRFS and 2DFS for the on-pulse region of a mean pulse profile. 0 5 0 500 1000 1500 2000 2500 Pulse No. I/ bin J1929+1905 20201121 0 100 Longitude ( ) 0 1 I/Ipeak 0 100 E/ E 0 5 150 200 250 300 350 400 450 Pulse No. I/ bin J1929+1905 20201121 0 100 Longitude ( ) 0 1 I/Ipeak 0 100 E/ E [PITH_FULL_IMAGE:figures/full_fig_p231_688.png] view at source ↗
Figure 687
Figure 687. Figure 687: Single pulse sequences of PSR J1929+00 from the FAST observation on 20210710. 4.269. J1928+1923 PSR J1928+1923 was discovered in a deep Parkes multi￾beam survey (Lorimer et al. 2013). This pulsar was observed by FAST on 20200804 for 5 minutes, deriving a rotation period P = 0.8173 s and a dispersion measure DM = 482.0 cm−3 pc. The single pulse sequence in [PITH_FULL_IMAGE:figures/full_fig_p231_687.png] view at source ↗
Figure 689
Figure 689. Figure 689: Single pulse sequence of PSR J1929+1905 from the FAST observation on 20201121, and three zoomed-in views of pulses No. 100- 500, 1200-1600 and 1800-2200. – to be continued [PITH_FULL_IMAGE:figures/full_fig_p231_689.png] view at source ↗
Figure 690
Figure 690. Figure 690: Continued. LRFS 0.3 0.6 Norm. Power 50 0 50 Longitude ( ) 0 1 Norm. I 0.1 0.2 0.3 0.4 F r e q. ( 1 / P 3 ) J1929+1905 20201121 2DFS: W 0.4 0.8 Norm. Power 10 0 10 Freq. (1/P2) 0 1 Norm. P. 0.1 0.2 0.3 0.4 F r e q. ( 1 / P 3 ) J1929+1905 20201121 [PITH_FULL_IMAGE:figures/full_fig_p232_690.png] view at source ↗
Figure 692
Figure 692. Figure 692: Single pulse sequences of PSR J1929+1955 from the FAST observation on 20190329 – to be continued [PITH_FULL_IMAGE:figures/full_fig_p232_692.png] view at source ↗
Figure 693
Figure 693. Figure 693: Fluctuation analysis of PSR J1929+1955 from FAST obser￾vations on 20211123 and 20220819, with LRFS and 2DFS for the on-pulse region of mean pulse profiles. periodicities of P3 = 2.27 ± 0.02 periods and P2 = −31 ± 7 degrees. 4.271. J1929+1905 PSR J1929+1905 was found in a deep Parkes multibeam survey (Lorimer et al. 2013). This pulsar was observed by FAST on 20201121 for 15 minutes, deriving a rotation pe… view at source ↗
Figure 692
Figure 692. Figure 692: Continued and ended. fluctuation spectra are shown in [PITH_FULL_IMAGE:figures/full_fig_p233_692.png] view at source ↗
Figure 696
Figure 696. Figure 696: Fluctuation analysis of PSR J1930+1722 for the observation on 20250414, with LRFS and 2DFS for the on-pulse region of a mean pulse profile. 0 8 16 20 40 60 80 100 120 140 Pulse No. I/ bin J1930+2836 20211205 0 10 Longitude ( ) 0 1 I/Ipeak 0 5 E/ E [PITH_FULL_IMAGE:figures/full_fig_p234_696.png] view at source ↗
Figure 694
Figure 694. Figure 694: Single pulse sequence of PSR J1930+1722 from the FAST observation on 20250414, and a zoomed-in view of pulses No. 100-300. 5 0 5 10 15 E/ E 0 100 200 300 400 Number J1930+1722 20250414 1 0 1 2 3 4 I/<I> [PITH_FULL_IMAGE:figures/full_fig_p234_694.png] view at source ↗
Figure 695
Figure 695. Figure 695: On-pulse energy histogram of single pulses of PSR J1930+1722 from the FAST observation on 20250414. responding to periodicities of P3 = 26.4 ± 0.1 periods and P2 = −311 ± 20◦ . 4.272. J1929+1955 PSR J1929+1955 was discovered by (Lorimer et al. 2013) using the Parkes telescope. Negative drifting of P3 = 13 ± 5 periods and P2 = −90+56 −122 degrees was reported by Song et al. (2023). This pulsar was observe… view at source ↗
Figure 697
Figure 697. Figure 697: Single pulse sequence of PSR J1930+2836 from the FAST observation on 20211205 [PITH_FULL_IMAGE:figures/full_fig_p234_697.png] view at source ↗
Figure 699
Figure 699. Figure 699: Single pulse sequences of PSR J1931+1439 from the FAST observation on 20240129. 5 0 5 10 15 20 E/ E 0 50 100 150 Number J1931+1439 20240129 0 2 4 6 I/<I> [PITH_FULL_IMAGE:figures/full_fig_p235_699.png] view at source ↗
Figure 698
Figure 698. Figure 698: Fluctuation analysis of PSR J1930+2836 for the observation on 20211205, with LRFS (top-left), and 2DFS for the on-pulse phase region (top-right), leading part (bottom-left) and trailing part (bottom-right) of a mean pulse profile. sion measure DM = 279.2 cm−3 pc were derived. Sin￾gle pulse sequences of these two observations in [PITH_FULL_IMAGE:figures/full_fig_p235_698.png] view at source ↗
Figure 702
Figure 702. Figure 702: Single pulse sequences of PSR J1931+30 from the FAST observation on 20210701. LRFS 0.25 0.50 Norm. Power 10 0 10 Longitude ( ) 0 1 Norm. I 0.1 0.2 0.3 0.4 F r e q. ( 1 / P 3 ) J1931+30 20210701 2DFS: W 0.25 0.50 Norm. Power 200 0 200 Freq. (1/P2) 0 1 Norm. P. 0.1 0.2 0.3 0.4 F r e q. ( 1 / P 3 ) J1931+30 20210701 [PITH_FULL_IMAGE:figures/full_fig_p236_702.png] view at source ↗
Figure 701
Figure 701. Figure 701: Fluctuation analysis of PSR J1931+1439 for the observation on 20240129, with LRFS (top-left), and 2DFS for the on-pulse phase region (top-right), leading part (bottom-left) and trailing part (bottom-right) of a mean pulse profile. are shown in [PITH_FULL_IMAGE:figures/full_fig_p236_701.png] view at source ↗
Figure 703
Figure 703. Figure 703: Fluctuation analysis of PSR J1931+30 for the observation on 20210701, with LRFS and 2DFS for the on-pulse region of a mean pulse profile [PITH_FULL_IMAGE:figures/full_fig_p236_703.png] view at source ↗
Figure 704
Figure 704. Figure 704: Single pulse sequences of PSR J1931-0144 from the FAST observation on 20221120. LRFS 0.4 0.8 Norm. Power 25 0 25 Longitude ( ) 0 1 Norm. I 0.1 0.2 0.3 0.4 0.5 F r e q. ( 1 / P 3 ) J1931-0144 20221120 2DFS: W 0.4 0.8 Norm. Power 100 0 100 Freq. (1/P2) 0 1 Norm. P. 0.1 0.2 0.3 0.4 0.5 F r e q. ( 1 / P 3 ) J1931-0144 20221120 [PITH_FULL_IMAGE:figures/full_fig_p237_704.png] view at source ↗
Figure 707
Figure 707. Figure 707: On-pulse energy histogram of single pulses of PSR J1932+1500 from the FAST observation on 20210606. PSR J1930+2836 was discovered by FAST in the Commensal Radio Astronomy FAST Survey (CRAFTS) (http://groups.bao.ac.cn/ism/CRAFTS/). This pulsar was observed by FAST on 20211205 for 3 min￾utes, yielding a rotation period P = 1.1792 s and a dis￾persion measure DM = 60.4 cm−3 pc. The single pulse sequence is d… view at source ↗
Figure 705
Figure 705. Figure 705: Fluctuation analysis of PSR J1931-0144 for the observation on 20221120, with LRFS and 2DFS for the on-pulse region of a mean pulse profile. 0 15 20 40 60 80 100 120 140 160 Pulse No. I/ bin J1932+1500 20210606 0 10 Longitude ( ) 0 1 I/Ipeak 0 50 E/ E [PITH_FULL_IMAGE:figures/full_fig_p237_705.png] view at source ↗
Figure 708
Figure 708. Figure 708: Single pulse sequences of PSR J1932+2220 from the FAST observation on 20230707. LRFS 0.25 0.50 Norm. Power 10 0 10 Longitude ( ) 0 1 Norm. I 0.1 0.2 0.3 0.4 0.5 F r e q. ( 1 / P 3 ) J1932+2220 20230707 2DFS: W 0.3 0.6 Norm. Power 250 0 250 Freq. (1/P2) 0 1 Norm. P. 0.1 0.2 0.3 0.4 0.5 F r e q. ( 1 / P 3 ) J1932+2220 20230707 [PITH_FULL_IMAGE:figures/full_fig_p238_708.png] view at source ↗
Figure 709
Figure 709. Figure 709: Fluctuation analysis of PSR J1932+2220 for the observation on 20230707, with LRFS and 2DFS for the on-pulse region of the mean pulse profile. 0 20 40 50 100 150 200 250 300 Pulse No. I/ bin J1933+1304 20201220 10 0 Longitude ( ) 0 1 I/Ipeak 0 50 E/ E [PITH_FULL_IMAGE:figures/full_fig_p238_709.png] view at source ↗
Figure 711
Figure 711. Figure 711: Fluctuation analysis of PSR J1933+1304 from the FAST ob￾servation on 20201220, with LRFS (top-left), and 2DFS for the on-pulse phase region (top-right), leading part (bottom-left) and trailing part (bottom￾right) of a mean pulse profile. 4.276. J1931+30 PSR J1931+30 was discovered by Camilo et al. (1996a) using the Arecibo radio telescope at 430 MHz. This pulsar was observed by FAST on 20210701 for 5 min… view at source ↗
Figure 714
Figure 714. Figure 714: Fluctuation analysis of PSR J1935+1159 for the observation on 20210618, with LRFS and 2DFS for the leading part of a mean pulse profile. this pulsar has nulling and modulation phenomena. Long nulls were shown by Brinkman et al. (2018). Song et al. (2023) reported drift feature of the leading component and P3-only feature of the trailing component. This pulsar was observed by FAST on 20210618 for 5 minute… view at source ↗
Figure 712
Figure 712. Figure 712: Single pulse sequence of PSR J1935+1159 from the FAST observation on 20210618. 0 10 20 30 40 50 E/ E 0 20 40 60 Number J1935+1159 20210618 2 0 2 4 6 8 10 12 I/<I> [PITH_FULL_IMAGE:figures/full_fig_p240_712.png] view at source ↗
Figure 713
Figure 713. Figure 713: Energy histogram of single pulses integrated in longitude range between -6.0◦ and 3.2◦ of PSR J1935+1159 from the FAST observa￾tion on 20210618. 4.281. J1935+1159 PSR J1935+1159 was discovered in the AreciboCaltech drift-scan survey (Chandler 2003). From previous studies, LRFS 0.4 0.8 Norm. Power 0 50 Longitude ( ) 0 1 Norm. I L T 0.1 0.2 0.3 0.4 0.5 F r e q. ( 1 / P 3 ) J1935+1159 20210618 2DFS: L 0.15 … view at source ↗
Figure 717
Figure 717. Figure 717: Distribution of period numbers for continuous normal emis￾sion PN against period numbers for adjacent weak emission PW of PSR J1935+1616 observed by FAST on 20211117, as well as the duration his￾tograms for the normal state and weak state shown in the top and right pan￾els, respectively. 0.0 0.6 N orm aliz e d I J1935+1616 20211117 I L V 15 10 5 0 5 10 15 Longitude ( ) 60 0 60 120 PA (°) Weak Normal [PI… view at source ↗
Figure 715
Figure 715. Figure 715: Two single pulse segments of pulses No. 1491-1840 and 3491-3840 of PSR J1935+1616 from the FAST observation on 20211117. The green and red bars represent normal or weak emission modes. In the right subpanel, the on-pulse energy variation is plotted against period, with dashed lines for thresholds to distinguish two states. 0 250 500 Number I = 0 J1935+1616 20211117 0 1000 2000 3000 4000 5000 E/ E 0.00 0.… view at source ↗
Figure 718
Figure 718. Figure 718: Mean polarization profiles (the top panel) for the weak (red) and normal (green) emission modes of PSR J1935+1616 observed on 20211117, as well as the averaged PA curves (the bottom panel). Profiles in the top panel are normalized by their respective peaks. of the central component of the observation on 20211117 ( [PITH_FULL_IMAGE:figures/full_fig_p241_718.png] view at source ↗
Figure 720
Figure 720. Figure 720: Single pulse sequence of PSR J1937+1358g from the FAST observation on 20210814. 2.5 0.0 2.5 5.0 7.5 10.0 E/ E 0 20 40 60 80 Number J1937+1358g 20210814 1 0 1 2 3 4 5 I/<I> [PITH_FULL_IMAGE:figures/full_fig_p242_720.png] view at source ↗
Figure 719
Figure 719. Figure 719: Fluctuation analysis of PSR J1935+1616 for the observation on 20211117, with LRFS (top-left), and 2DFS for the leading part (top￾right), central part (bottom-left) and trailing part (bottom-right) of a mean pulse profile. Averaged Polarization profiles as well as PA curves of the weak and normal emission modes are displayed in [PITH_FULL_IMAGE:figures/full_fig_p242_719.png] view at source ↗
Figure 723
Figure 723. Figure 723: Single pulse sequence of PSR J1937+1505 from the FAST observation on 20201226. 0 10 20 30 40 50 60 E/ E 0 10 20 30 Number (× 0.6) J1937+1505 20201226 0.0 0.5 1.0 1.5 2.0 2.5 3.0 I/<I> [PITH_FULL_IMAGE:figures/full_fig_p243_723.png] view at source ↗
Figure 724
Figure 724. Figure 724: On-pulse energy histogram of single pulses of PSR J1937+1505 for the observation on 20201226. 4.284. J1937+1505 PSR J1937+1505 was discovered by Hobbs et al. (2004) in the Parkes multibeam pulsar survey [PITH_FULL_IMAGE:figures/full_fig_p243_724.png] view at source ↗
Figure 725
Figure 725. Figure 725: Fluctuation analysis of PSR J1937+1505 from the FAST ob￾servation on 20201226, with LRFS and 2DFS for the leading part of a mean pulse profile. This pulsar was observed by FAST on 20201226 for 5 min￾utes, deriving a rotation period P = 2.8730 s and a disper￾sion measure DM = 228.1 cm−3 pc. The single pulse se￾quence is displayed in [PITH_FULL_IMAGE:figures/full_fig_p244_725.png] view at source ↗
Figure 726
Figure 726. Figure 726: Single pulse sequences of PSR J1937+2544 from the FAST observation on 20210623. LRFS 0.3 0.6 Norm. Power 25 0 25 Longitude ( ) 0 1 Norm. I L T 0.1 0.2 0.3 0.4 F r e q. ( 1 / P 3 ) J1937+2544 20210623 2DFS: T 0.4 0.8 Norm. Power 200 0 200 Freq. (1/P2) 0 1 Norm. P. 0.1 0.2 0.3 0.4 F r e q. ( 1 / P 3 ) J1937+2544 20210623 [PITH_FULL_IMAGE:figures/full_fig_p244_726.png] view at source ↗
Figure 727
Figure 727. Figure 727: Fluctuation analysis of PSR J1937+2544 for the observation on 20210623, with LRFS and 2DFS for the trailing part of a mean pulse profile [PITH_FULL_IMAGE:figures/full_fig_p244_727.png] view at source ↗
Figure 728
Figure 728. Figure 728: Single pulse sequence of PSR J1937+2950 from the FAST observation on 20210324. LRFS 0.2 0.4 Norm. Power 20 0 Longitude ( ) 0 1 Norm. I L T 0.1 0.2 0.3 0.4 0.5 F r e q. ( 1 / P 3 ) J1937+2950 20210324 2DFS: T 0.2 0.4 Norm. Power 250 0 250 Freq. (1/P2) 0 1 Norm. P. 0.1 0.2 0.3 0.4 0.5 F r e q. ( 1 / P 3 ) J1937+2950 20210324 [PITH_FULL_IMAGE:figures/full_fig_p245_728.png] view at source ↗
Figure 731
Figure 731. Figure 731: On-pulse energy histogram of PSR J1938+0650 from the FAST observation on 20210702. sequence in [PITH_FULL_IMAGE:figures/full_fig_p245_731.png] view at source ↗
Figure 729
Figure 729. Figure 729: Fluctuation analysis of PSR J1937+2950 for the observation on 20210324, with LRFS and 2DFS for the trailing part of a mean pulse profile. 0 50 100 50 100 150 200 250 Pulse No. I/ bin J1938+0650 20210702 5 0 5 Longitude ( ) 0 1 I/Ipeak 0 100 E/ E 0 50 100 80 90 100 110 120 130 Pulse No. I/ bin J1938+0650 20210702 5 0 5 Longitude ( ) 0 1 I/Ipeak 0 100 E/ E [PITH_FULL_IMAGE:figures/full_fig_p245_729.png] view at source ↗
Figure 732
Figure 732. Figure 732: Cross correlation of PSR J1938+0650 from the FAST obser￾vation on 20210702. 0 15 30 20 40 60 80 100 Pulse No. I/ bin J1938+14 20201226 10 0 10 Longitude ( ) 0 1 I/Ipeak 0 25 E/ E [PITH_FULL_IMAGE:figures/full_fig_p246_732.png] view at source ↗
Figure 735
Figure 735. Figure 735: Fluctuation analysis of PSR J1938+14 for the observation on 20201226, with LRFS and 2DFS for the on-pulse region of a mean pulse profile. 0 20 40 50 100 150 200 250 Pulse No. I/ bin J1938+14a 20210814 0 10 Longitude ( ) 0 1 I/Ipeak 0 25 E/ E 0 20 40 300 350 400 450 500 Pulse No. I/ bin J1938+14a 20210814 0 10 Longitude ( ) 0 1 I/Ipeak 0 25 E/ E [PITH_FULL_IMAGE:figures/full_fig_p246_735.png] view at source ↗
Figure 733
Figure 733. Figure 733: Single pulse sequence of PSR J1938+14 from the FAST ob￾servation on 20201226. 0 10 20 30 E/ E 0 5 10 15 Number (× 0.4) J1938+14 20201226 0.5 0.0 0.5 1.0 1.5 2.0 2.5 I/<I> [PITH_FULL_IMAGE:figures/full_fig_p246_733.png] view at source ↗
Figure 736
Figure 736. Figure 736: Single pulse sequences of PSR J1938+14a from the FAST observation on 20210814 [PITH_FULL_IMAGE:figures/full_fig_p246_736.png] view at source ↗
Figure 737
Figure 737. Figure 737: Energy histogram of single pulses of PSR J1938+14a from the FAST observation on 20210814. LRFS 0.4 0.8 Norm. Power 0 10 Longitude ( ) 0 1 Norm. I L T 0.1 0.2 0.3 0.4 0.5 F r e q. ( 1 / P 3 ) J1938+14a 20210814 2DFS: L 0.4 0.8 Norm. Power 250 0 250 Freq. (1/P2) 0 1 Norm. P. 0.1 0.2 0.3 0.4 0.5 F r e q. ( 1 / P 3 ) J1938+14a 20210814 [PITH_FULL_IMAGE:figures/full_fig_p247_737.png] view at source ↗
Figure 739
Figure 739. Figure 739: Single pulse sequences of PSR J1939+10 from the FAST observation on 20230215. PSR J1938+14 was discovered in the Arecibo 327 MHz Drift Pulsar Survey via a single-pulse search (Deneva et al. 2016). J1938+14 was observed by FAST on 20201226 for 5 min￾utes, deriving a rotation period P = 2.9028 s and a disper￾sion measure DM = 75.6 cm−3 pc. The single pulse se￾quence in [PITH_FULL_IMAGE:figures/full_fig_p2… view at source ↗
Figure 740
Figure 740. Figure 740: On-pulse energy histogram of single pulses of PSR J1939+10 from the FAST observation on 20230215. LRFS 0.25 0.50 Norm. Power 10 0 Longitude ( ) 0 1 Norm. I L T 0.1 0.2 0.3 0.4 F r e q. ( 1 / P 3 ) J1939+10 20230215 2DFS: W 0.4 0.8 Norm. Power 250 0 250 Freq. (1/P2) 0 1 Norm. P. 0.1 0.2 0.3 0.4 F r e q. ( 1 / P 3 ) J1939+10 20230215 2DFS: L 0.2 0.4 Norm. Power 250 0 250 Freq. (1/P2) 0 1 Norm. P. 0.1 0.2 0… view at source ↗
Figure 742
Figure 742. Figure 742: Single pulse sequences of PSR J1939+2352g from the FAST observation on 20240317. 4 2 0 2 4 6 8 E/ E 0 25 50 75 100 125 Number J1939+2352g 20240317 5.0 2.5 0.0 2.5 5.0 7.5 10.0 I/<I> [PITH_FULL_IMAGE:figures/full_fig_p248_742.png] view at source ↗
Figure 743
Figure 743. Figure 743: On-pulse energy histogram of single pulses of PSR J1939+2352g from the FAST observation on 20240317. feature with the centroid of 1/P3 = 0.424 ± 0.003, corre￾sponding to the periodicity of P3 = 2.36 ± 0.02 periods. 4.290. J1939+10 PSR J1939+10 was discovered by the Arecibo telescope (Camilo et al. 1996a), and reported to exhibit dwarf pulses during the nulling state from the sensitive FAST observations (… view at source ↗
Figure 741
Figure 741. Figure 741: Fluctuation analysis of PSR J1939+10 for the observation on 20230215, with LRFS (top-left), and 2DFS for the on-pulse phase region (top-right), leading part (bottom-left) and trailing part (bottom-right) of a mean pulse profile. 0 4 8 50 100 150 200 250 Pulse No. I/ bin J1939+2352g 20240317 0 20 Longitude ( ) 0 1 I/Ipeak 5 0 5 E/ E 0 4 8 300 350 400 450 500 550 Pulse No. I/ bin J1939+2352g 20240317 0 20 … view at source ↗
Figure 746
Figure 746. Figure 746: On-pulse energy histogram of single pulses of PSR J1939+2453g from the FAST observation on 20210514. quences are shown in [PITH_FULL_IMAGE:figures/full_fig_p249_746.png] view at source ↗
Figure 744
Figure 744. Figure 744: Fluctuation analysis of PSR J1939+2352g for the observation on 20240317, with LRFS and 2DFS for the on-pulse region of a mean pulse profile. 0 4 8 50 100 150 200 250 300 350 Pulse No. I/ bin J1939+2453g 20210514 5 0 5 Longitude ( ) 0 1 I/Ipeak 0 10 E/ E [PITH_FULL_IMAGE:figures/full_fig_p249_744.png] view at source ↗
Figure 745
Figure 745. Figure 745: Single pulse sequence of PSR J1939+2453g from the FAST observation on 20210514. 5.0 2.5 0.0 2.5 5.0 7.5 10.0 E/ E 0 20 40 60 80 100 Number J1939+2453g 20210514 2 0 2 4 6 8 I/<I> [PITH_FULL_IMAGE:figures/full_fig_p249_745.png] view at source ↗
Figure 747
Figure 747. Figure 747: Single pulse sequence of PSR J1940+0239 from the FAST observation on 20210719. The pulsar was observed by FAST on 20210719 for 5 min￾utes, deriving a rotation period P = 1.2322 s and a disper￾sion measure DM = 86.1 cm−3 pc. We first report the sub￾pulse behavior of the pulsar here. In single pulse sequences ( [PITH_FULL_IMAGE:figures/full_fig_p250_747.png] view at source ↗
Figure 748
Figure 748. Figure 748: Fluctuation analysis of PSR J1940+0239 for the observation on 20210719, with LRFS (top-left), and 2DFS for the leading part (top￾right), central part (bottom-left) and trailing part (bottom-right) of a mean pulse profile. pulse sequence and a zoomed-in view of pulses No. 200-450 in [PITH_FULL_IMAGE:figures/full_fig_p250_748.png] view at source ↗
Figure 749
Figure 749. Figure 749: Single pulse sequence of PSR J1941+0121 from the FAST observation on 20250410, and a zoomed-in view of pulses No. 200-450. LRFS 0.4 0.8 Norm. Power 50 0 50 Longitude ( ) 0 1 Norm. I 0.1 0.2 0.3 0.4 F r e q. ( 1 / P 3 ) J1941+0121 20250410 2DFS: W 0.4 0.8 Norm. Power 50 0 50 Freq. (1/P2) 0 1 Norm. P. 0.1 0.2 0.3 0.4 F r e q. ( 1 / P 3 ) J1941+0121 20250410 [PITH_FULL_IMAGE:figures/full_fig_p251_749.png] view at source ↗
Figure 752
Figure 752. Figure 752: On-pulse energy histogram of single pulses of PSR J1941+4320 from the FAST observation on 20210808. The pulsar was observed by FAST on 20210808 for 5 min￾utes, deriving a rotation period P = 0.8409 s and a disper￾sion measure DM = 79.2 cm−3 pc. Single pulse sequences of the observation are shown in [PITH_FULL_IMAGE:figures/full_fig_p251_752.png] view at source ↗
Figure 750
Figure 750. Figure 750: Fluctuation analysis of PSR J1941+0121 for the observation on 20250410, with LRFS and 2DFS for the on-pulse region of a mean pulse profile. 0 15 30 25 50 75 100 125 150 175 Pulse No. I/ bin J1941+4320 20210808 10 0 10 Longitude ( ) 0 1 I/Ipeak 0 100 E/ E 0 15 30 200 225 250 275 300 325 350 Pulse No. I/ bin J1941+4320 20210808 10 0 10 Longitude ( ) 0 1 I/Ipeak 0 100 E/ E [PITH_FULL_IMAGE:figures/full_fig… view at source ↗
Figure 753
Figure 753. Figure 753: Fluctuation analysis of the slow drifting mode (pulses No. 1-85 and 210-360) of PSR J1941+4320 from the FAST observation on 20210808, with LRFS and 2DFS for the on-pulse region of a mean pulse profile. 15 10 5 0 5 10 15 Longitude interval ( °) 0.0 0.4 0.8 Norm. corre. coeffi. J1941+4320 20210808 [PITH_FULL_IMAGE:figures/full_fig_p252_753.png] view at source ↗
Figure 755
Figure 755. Figure 755: Single pulse sequences of PSR J1942+1743 from the FAST observation on 20190330. measure DM = 186.6 cm−3 pc were determined. Single pulse sequences in [PITH_FULL_IMAGE:figures/full_fig_p252_755.png] view at source ↗
Figure 757
Figure 757. Figure 757: Single pulse sequences of PSR J1943+0609 from the FAST observation on 20210717. LRFS 0.25 0.50 Norm. Power 0 25 Longitude ( ) 0 1 Norm. I L T 0.1 0.2 0.3 0.4 F r e q. ( 1 / P 3 ) J1943+0609 20210717 2DFS: L 0.3 0.6 Norm. Power 250 0 250 Freq. (1/P2) 0 1 Norm. P. 0.1 0.2 0.3 0.4 F r e q. ( 1 / P 3 ) J1943+0609 20210717 [PITH_FULL_IMAGE:figures/full_fig_p253_757.png] view at source ↗
Figure 756
Figure 756. Figure 756: Fluctuation analysis of PSR J1942+1743 for the observation on 20190330, with LRFS (top-left), and 2DFS for the on-pulse region (top￾right), leading part (bottom-left) and trailing part (bottom-right) of a mean pulse profile. and 1/P2 = 48.7 ± 2.3, that correspond to periodicities of P3 = 5.37 ± 0.02 periods and P2 = 7.4 ± 0.4 ◦ . 4.298. J1943+1704g PSR J1943+1704g was discovered in the FAST GPPS sur￾vey … view at source ↗
Figure 758
Figure 758. Figure 758: Fluctuation analysis of PSR J1943+0609 for the observation on 20210717, with LRFS and 2DFS for the leading part of a mean pulse profile [PITH_FULL_IMAGE:figures/full_fig_p253_758.png] view at source ↗
Figure 761
Figure 761. Figure 761: Mean profiles for the weak (red dashed) and bright (green dotted) emission modes of PSR J1943+1704g observed on 20250814, which are normalized by their respective peaks of the mean pulse profile. 0 20 40 20 40 60 80 100 120 140 Pulse No. I/ bin J1944+1755 20191226 25 0 Longitude ( ) 0 1 I/Ipeak 0 50 E/ E 0 25 50 20 40 60 80 100 120 140 Pulse No. I/ bin J1944+1755 20191226 25 0 Longitude ( ) 0 1 I/Ipeak 0… view at source ↗
Figure 759
Figure 759. Figure 759: Single pulse sequence of PSR J1943+1704g from the FAST observation on 20230214, and a zoomed-in view of pulses No. 100-300. The red and green bars represent weak or bright emission modes. In the right subpanel, the on-pulse energy variation is plotted against period. 0 60 120 Number I = 0 J1943+1704g 20250814 0 10 20 30 E/ E 1 0 1 2 3 4 5 I/<I> [PITH_FULL_IMAGE:figures/full_fig_p254_759.png] view at source ↗
Figure 762
Figure 762. Figure 762: Single pulse sequences of PSR J1944+1755 for two beams of P3M11 and P4M11 from the FAST observation on 20191226 . PSR J1944+1755 was discovered by Hulse & Taylor (1975) using the Arecibo telescope. The pulsar has nulls with a fraction of more than 60% at 430 MHz (Lorimer et al. 2002). Song et al. (2023) reported P3=15±2 periods and P2=-14+1 −3 degrees, and P3=15(1) periods and P2=-29+6 −5 de￾grees for tw… view at source ↗
Figure 763
Figure 763. Figure 763: On-pulse energy histogram of single pulses of PSR J1944+1755 from the FAST observation on 20191226. 2DFS: L 0.4 0.8 Norm. Power 100 0 100 Freq. (1/P2) 0 1 Norm. P. 0.1 0.2 0.3 0.4 F r e q. ( 1 / P 3 ) J1944+1755 20191226 2DFS: T 0.4 0.8 Norm. Power 100 0 100 Freq. (1/P2) 0 1 Norm. P. 0.1 0.2 0.3 0.4 F r e q. ( 1 / P 3 ) J1944+1755 20191226 2DFS: L 0.4 0.8 Norm. Power 100 0 100 Freq. (1/P2) 0 1 Norm. P. 0… view at source ↗
Figure 765
Figure 765. Figure 765: Single pulse sequences of PSR J1944+1934g from the FAST observation on 20240703. 2.5 0.0 2.5 5.0 7.5 10.0 E/ E 0 20 40 60 Number J1944+1934g 20240703 1 0 1 2 3 I/<I> [PITH_FULL_IMAGE:figures/full_fig_p255_765.png] view at source ↗
Figure 766
Figure 766. Figure 766: On-pulse energy histogram of single pulses of PSR J1944+1934g from the FAST observation on 20240703. which display nulling and subpulse drifting behaviors. The nulling fractions are estimated from the on-pulse energy histogram ( [PITH_FULL_IMAGE:figures/full_fig_p255_766.png] view at source ↗
Figure 764
Figure 764. Figure 764: Fluctuation analysis of PSR J1944+1755 from two beam data of the FAST observation on 20191226, with 2DFS for the leading and trail￾ing parts of a mean pulse profile. 0 4 8 20 40 60 80 100 120 Pulse No. I/ bin J1944+1934g 20240703 2.5 0.0 2.5 Longitude ( ) 0 1 I/Ipeak 0 10 E/ E 0 4 8 140 160 180 200 220 240 260 Pulse No. I/ bin J1944+1934g 20240703 2.5 0.0 2.5 Longitude ( ) 0 1 I/Ipeak 0 10 E/ E [PITH_FU… view at source ↗
Figure 769
Figure 769. Figure 769: On-pulse energy histogram of single pulses of PSR J1945+1211 from the FAST observation on 20210807. 0 5 10 0 200 400 600 800 1000 1200 1400 Pulse No. I/ bin J1945+17 20240723 50 0 50 Longitude ( ) 0 1 I/Ipeak 0 5 E/ E 0 5 10 180 200 220 240 260 280 300 320 Pulse No. I/ bin J1945+17 20240723 50 0 50 Longitude ( ) 0 1 I/Ipeak 0 5 E/ E [PITH_FULL_IMAGE:figures/full_fig_p256_769.png] view at source ↗
Figure 767
Figure 767. Figure 767: Fluctuation analysis of PSR J1944+1934g for the observation on 20240703, with LRFS and 2DFS for the on-pulse region of a mean pulse profile. 0 25 50 10 20 30 40 50 60 Pulse No. I/ bin J1945+1211 20210807 0 25 Longitude ( ) 0 1 I/Ipeak 0 100 E/ E [PITH_FULL_IMAGE:figures/full_fig_p256_767.png] view at source ↗
Figure 770
Figure 770. Figure 770: Single pulse sequence of PSR J1945+17 from the FAST ob￾servation on 20240723, and a zoomed-in view of pulses No. 161-330. periods) and 1/P2 = −21 ± 1 (P2 = −17 ± 1 ◦ ) for the trailing component. While the centroid drifting parameters of the P4M11 data are relatively different. For two compo￾nents, they are 1/P3 = 0.061 ± 0.001 (P3 = 16.5 ± 0.2 periods) and 1/P2 = −17 ± 1 (P2 = −21 ± 2 ◦ ), and 1/P3 = 0.… view at source ↗
Figure 768
Figure 768. Figure 768: Single pulse sequence of PSR J1945+1211 from the FAST observation on 20210807. 0 20 40 60 80 100 E/ E 0 5 10 15 20 25 Number (× 0.6) J1945+1211 20210807 0 1 2 3 I/<I> [PITH_FULL_IMAGE:figures/full_fig_p256_768.png] view at source ↗
Figure 771
Figure 771. Figure 771: Fluctuation analysis of PSR J1945+17 for the observation on 20240723, with LRFS and 2DFS for the central part of a mean pulse profile. 0 3 50 100 150 200 250 300 350 Pulse No. I/ bin J1945+2410 20210707 0 20 Longitude ( ) 0 1 I/Ipeak 10 0 10 E/ E [PITH_FULL_IMAGE:figures/full_fig_p257_771.png] view at source ↗
Figure 773
Figure 773. Figure 773: Fluctuation analysis of PSR J1945+2410 for the observation on 20210707, with LRFS (top-left), and 2DFS for the on-pulse region (top￾right), leading part (bottom-left) and trailing part (bottom-right) of a mean pulse profile. PSR J1944+1934g was discovered in the FAST GPPS sur￾vey (Han et al. 2021, 2025). This pulsar was observed by FAST on 20240703 for 15 minutes, yielding a rotation period P = 3.4452 s … view at source ↗
Figure 772
Figure 772. Figure 772: Single pulse sequence of PSR J1945+2410 from the FAST observation on 20210707. LRFS 0.3 0.6 Norm. Power 0 25 Longitude ( ) 0 1 Norm. I L T 0.1 0.2 0.3 0.4 0.5 F r e q. ( 1 / P 3 ) J1945+2410 20210707 2DFS: W 0.3 0.6 Norm. Power 100 0 100 Freq. (1/P2) 0 1 Norm. P. 0.1 0.2 0.3 0.4 0.5 F r e q. ( 1 / P 3 ) J1945+2410 20210707 2DFS: L 0.3 0.6 Norm. Power 100 0 100 Freq. (1/P2) 0 1 Norm. P. 0.1 0.2 0.3 0.4 0.… view at source ↗
Figure 774
Figure 774. Figure 774: Single pulse sequences of PSR J1945-0040 from the FAST observation on 20250410. 5.0 2.5 0.0 2.5 5.0 7.5 10.0 12.5 E/ E 0 50 100 150 Number J1945-0040 20250410 1.0 0.5 0.0 0.5 1.0 1.5 2.0 2.5 I/<I> [PITH_FULL_IMAGE:figures/full_fig_p258_774.png] view at source ↗
Figure 776
Figure 776. Figure 776: Fluctuation analysis of PSR J1945-0040 for the observation on 20250410, with LRFS (top-left), and 2DFS for the on-pulse region (top￾right), leading part (bottom-left) and trailing part (bottom-right) of a mean pulse profile. sequence of this observation, shown in [PITH_FULL_IMAGE:figures/full_fig_p258_776.png] view at source ↗
Figure 777
Figure 777. Figure 777: Single pulse sequences of PSR J1947+10 from the FAST observation on 20210806. played in [PITH_FULL_IMAGE:figures/full_fig_p259_777.png] view at source ↗
Figure 778
Figure 778. Figure 778: Fluctuation analysis of PSR J1947+10 for the observation on 20210806, with LRFS (top-left), and 2DFS for the leading part (top-right), central part (bottom-left) and trailing part (bottom-right) of a mean pulse profile. ported to exhibit nulling behavior (Weisberg et al. 1986; Red￾man & Rankin 2009). The subpulse drifting parameters for two components are also shown by Song et al. (2023), which are P3 = … view at source ↗
Figure 779
Figure 779. Figure 779: Single pulse sequence of PSR J1951+1123 from the FAST observation on 20210710. 6 4 2 0 2 4 6 Longitude interval ( °) 0.0 0.4 0.8 Norm. corre. coeffi. J1951+1123 20210710 [PITH_FULL_IMAGE:figures/full_fig_p260_779.png] view at source ↗
Figure 780
Figure 780. Figure 780: Cross correlation of PSR J1951+1123 from the FAST obser￾vation on 20210710. pared to the leading part. The nulling fraction of this ob￾servation is estimated from the on-pulse energy histogram in [PITH_FULL_IMAGE:figures/full_fig_p260_780.png] view at source ↗
Figure 783
Figure 783. Figure 783: Single pulse sequences of PSR J1952+3021 from the FAST observation on 20211009. 0 10 20 30 40 50 E/ E 0 10 20 30 40 50 Number (× 0.4) J1952+3021 20211009 0 1 2 3 4 5 I/<I> [PITH_FULL_IMAGE:figures/full_fig_p261_783.png] view at source ↗
Figure 782
Figure 782. Figure 782: Fluctuation analysis of PSR J1951+4724 for the observation on 20250225, with LRFS (top-left), and 2DFS for the on-pulse region (top￾right), leading part (bottom-left) and trailing part (bottom-right) of the mean pulse profile. The pulsar was observed by FAST on 20210710 for 5 min￾utes, deriving a rotation period P = 5.0936 s and a disper￾sion measure DM = 27.3 cm−3 pc. The single pulse se￾quence of the o… view at source ↗
Figure 785
Figure 785. Figure 785: Fluctuation analysis of PSR J1952+3021 for the observation on 20211009, with LRFS and 2DFS for the on-pulse region of a mean pulse profile. 0 10 20 50 100 150 200 250 300 Pulse No. I/ bin J1953+1149 20210116 10 0 10 Longitude ( ) 0 1 I/Ipeak 0 25 E/ E 0 10 20 350 400 450 500 550 600 Pulse No. I/ bin J1953+1149 20210116 10 0 10 Longitude ( ) 0 1 I/Ipeak 0 25 E/ E [PITH_FULL_IMAGE:figures/full_fig_p262_785.png] view at source ↗
Figure 786
Figure 786. Figure 786: Single pulse sequences of PSR J1953+1149 from the FAST observation on 20210116. LRFS 0.3 0.6 Norm. Power 10 0 10 Longitude ( ) 0 1 Norm. I 0.1 0.2 0.3 0.4 F r e q. ( 1 / P 3 ) J1953+1149 20210116 2DFS: W 0.3 0.6 Norm. Power 250 0 250 Freq. (1/P2) 0 1 Norm. P. 0.1 0.2 0.3 0.4 F r e q. ( 1 / P 3 ) J1953+1149 20210116 [PITH_FULL_IMAGE:figures/full_fig_p262_786.png] view at source ↗
Figure 789
Figure 789. Figure 789: On-pulse energy histogram of single pulses of PSR J1954+1021 from the FAST observation on 20210117. LRFS 0.25 0.50 Norm. Power 10 0 10 Longitude ( ) 0 1 Norm. I 0.1 0.2 0.3 0.4 F r e q. ( 1 / P 3 ) J1954+1021 20210117 2DFS: W 0.3 0.6 Norm. Power 200 0 200 Freq. (1/P2) 0 1 Norm. P. 0.1 0.2 0.3 0.4 F r e q. ( 1 / P 3 ) J1954+1021 20210117 [PITH_FULL_IMAGE:figures/full_fig_p263_789.png] view at source ↗
Figure 791
Figure 791. Figure 791: Single pulse sequence of PSR J1954+2529 from the FAST observation on 20230729. 5 0 5 10 15 20 25 E/ E 0 20 40 60 Number (× 0.7) J1954+2529 20230729 1 0 1 2 3 4 I/<I> [PITH_FULL_IMAGE:figures/full_fig_p263_791.png] view at source ↗
Figure 792
Figure 792. Figure 792: On-pulse energy histogram of single pulses of PSR J1954+2529 from the FAST observation on 20230729. The low-frequency modulation periodicity of 31±2 periods in fluctuation spectra arises from nulls. 4.309. J1953+1149 PSR J1953+1149 was discovered by the 305 m radio tele￾scope at Arecibo (Nice et al. 1995). Subpulse drifting of P3=3.2±0.9 periods and P2=31+7 −24 degrees was reported by Song et al. (2023).… view at source ↗
Figure 793
Figure 793. Figure 793: Single-pulse sequences of PSR J1955+2930 from the FAST observation on 20210315. LRFS 0.4 0.8 Norm. Power 10 0 10 Longitude ( ) 0 1 Norm. I L T 0.1 0.2 0.3 0.4 F r e q. ( 1 / P 3 ) J1955+2930 20210315 2DFS: T 0.4 0.8 Norm. Power 250 0 250 Freq. (1/P2) 0 1 Norm. P. 0.1 0.2 0.3 0.4 F r e q. ( 1 / P 3 ) J1955+2930 20210315 [PITH_FULL_IMAGE:figures/full_fig_p264_793.png] view at source ↗
Figure 794
Figure 794. Figure 794: Fluctuation analysis of PSR J1955+2930 for the observation on 20210315, with LRFS and 2DFS for the trailing part of a mean pulse profile. quences are shown in [PITH_FULL_IMAGE:figures/full_fig_p264_794.png] view at source ↗
Figure 796
Figure 796. Figure 796: Mean polarization profiles (the top panel) for weak and bright emission modes of PSR J1956+35 observed on 20240628, as well as the averaged PA curves (the bottom panel). sion measure DM = 153.3 cm−3 pc. The single pulse se￾quence in [PITH_FULL_IMAGE:figures/full_fig_p265_796.png] view at source ↗
Figure 795
Figure 795. Figure 795: Single pulse sequence of PSR J1956+35 from the FAST ob￾servation on 20240628. 0.0 0.5 1.0 N orm aliz e d I J1956+35 20240628 I L V 5 0 5 10 Longitude ( ) 60 0 60 120 PA (°) Weak Bright [PITH_FULL_IMAGE:figures/full_fig_p265_795.png] view at source ↗
Figure 798
Figure 798. Figure 798: Single-pulse sequences of PSR J1959+3036g from the FAST observation on 20230613. 0 10 20 30 40 E/ E 0 10 20 30 40 50 Number (× 0.4) J1959+3036g 20230613 1 0 1 2 3 4 5 I/<I> [PITH_FULL_IMAGE:figures/full_fig_p266_798.png] view at source ↗
Figure 797
Figure 797. Figure 797: Fluctuation analysis of PSR J1956+35 for the observation on 20240628, with LRFS (top-left), and 2DFS for the on-pulse region (top￾right), leading part (bottom-left) and trailing part (bottom-right) of a mean pulse profile for the weak emission mode. This pulsar was observed by FAST on 20231015 for 15 minutes, yielding a rotation period P = 0.5146 s and a dis￾persion measure DM = 342.8 cm−3 pc. Single pul… view at source ↗
Figure 800
Figure 800. Figure 800: Single pulse sequences of PSR J1959+3141g from the FAST observation on 20231015. LRFS 0.50 0.75 Norm. Power 0 20 Longitude ( ) 0 1 Norm. I 0.1 0.2 0.3 0.4 F r e q. ( 1 / P 3 ) J1959+3141g 20231015 2DFS: W 0.4 0.8 Norm. Power 100 0 100 Freq. (1/P2) 0 1 Norm. P. 0.1 0.2 0.3 0.4 F r e q. ( 1 / P 3 ) J1959+3141g 20231015 [PITH_FULL_IMAGE:figures/full_fig_p267_800.png] view at source ↗
Figure 801
Figure 801. Figure 801: Fluctuation analysis of PSR J1959+3141g for the observation on 20231015, with LRFS and 2DFS for the on-pulse region of a mean pulse profile. 0 8 50 100 150 200 250 300 350 Pulse No. I/ bin J1959+3620 20210327 50 0 50 Longitude ( ) 0 1 I/Ipeak 0 50 E/ E 0 8 400 450 500 550 600 650 700 750 Pulse No. I/ bin J1959+3620 20210327 50 0 50 Longitude ( ) 0 1 I/Ipeak 0 50 E/ E [PITH_FULL_IMAGE:figures/full_fig_p2… view at source ↗
Figure 806
Figure 806. Figure 806: Single pulse sequences of PSR J2002+4050 from the FAST observation on 20210717. 0 50 100 150 200 250 E/ E 0 10 20 30 Number (× 0.2) J2002+4050 20210717 0.0 0.5 1.0 1.5 2.0 I/<I> 0 20 0 20 (× 0.2) [PITH_FULL_IMAGE:figures/full_fig_p268_806.png] view at source ↗
Figure 807
Figure 807. Figure 807: On-pulse energy histogram of single pulses of PSR J2002+4050 from the FAST observation on 20210717. The inset provides a view of the xaxis region from -10 to 35. 4.317. J2001+2856g PSR J2001+2856g was discovered in the FAST GPPS sur￾vey (Han et al. 2021, 2025). This pulsar was observed by FAST on 20221004 for 5 min￾utes, on 20221111 for 15 minutes, and on 20250417 for 60 minutes. From the 15-minute data,… view at source ↗
Figure 805
Figure 805. Figure 805: Fluctuation analysis of PSR J2001+2856g for the observation on 20221111, with LRFS and 2DFS for the on-pulse region of a mean pulse profile. 0 50 100 20 40 60 80 100 120 140 160 Pulse No. I/ bin J2002+4050 20210717 0 20 Longitude ( ) 0 1 I/Ipeak 0 250 E/ E 0 50 100 180 200 220 240 260 280 300 320 Pulse No. I/ bin J2002+4050 20210717 0 20 Longitude ( ) 0 1 I/Ipeak 0 250 E/ E [PITH_FULL_IMAGE:figures/full… view at source ↗
Figure 809
Figure 809. Figure 809: Single pulse sequences of PSR J2002+4653 from the FAST observation on 20240221. 5 0 5 10 15 E/ E 0 100 200 300 Number J2002+4653 20240221 1 0 1 2 3 4 5 I/<I> [PITH_FULL_IMAGE:figures/full_fig_p269_809.png] view at source ↗
Figure 808
Figure 808. Figure 808: Fluctuation analysis of PSR J2002+4050 from the FAST ob￾servation on 20210717, with LRFS (top-left), and 2DFS for the on-pulse region (top-right), leading part (bottom-left) and trailing part (bottom-right) of a mean pulse profile. tively. In LRFS and 2DFS in [PITH_FULL_IMAGE:figures/full_fig_p269_808.png] view at source ↗
Figure 812
Figure 812. Figure 812: On-pulse energy histogram of single pulses of PSR J2003+2916 from the FAST observation on 20211202. of the observation on 20240221 in [PITH_FULL_IMAGE:figures/full_fig_p270_812.png] view at source ↗
Figure 811
Figure 811. Figure 811: Single pulse sequences of PSR J2003+2916 from the FAST observation on 20211202. 4.319. J2002+4653 PSR J2002+4653 was discovered by FAST in the Commensal Radio Astronomy FAST Survey (CRAFTS) (http://groups.bao.ac.cn/ism/CRAFTS/). This pulsar was observed by FAST on 20210707 for 4 min￾utes and 20240221 for 8 minutes. From the longer data, a rotation period P = 0.2483 s and a dispersion measure DM = 144.8 c… view at source ↗
Figure 814
Figure 814. Figure 814: Single pulse sequence of PSR J2006+22 from the FAST ob￾servation on 20220502. 5 0 5 10 15 20 E/ E 0 10 20 30 40 50 Number J2006+22 20220502 0.5 0.0 0.5 1.0 1.5 2.0 2.5 I/<I> [PITH_FULL_IMAGE:figures/full_fig_p271_814.png] view at source ↗
Figure 813
Figure 813. Figure 813: Fluctuation analysis of PSR J2003+2916 from the FAST ob￾servation on 20211202, with LRFS (top-left), and 2DFS for the on-pulse region (top-right), leading part (bottom-left) and trailing part (bottom-right) of a mean pulse profile. 4.323. J2009+3326 PSR J2009+3326 was discovered by (Cordes et al. 2006) using the Arecibo telescope. This pulsar was observed by FAST on 20200125 for 5 minutes, deriving a rot… view at source ↗
Figure 816
Figure 816. Figure 816: Single pulse sequences of PSR J2006+4058 from the FAST observation on 20210324. LRFS 0.25 0.50 Norm. Power 10 0 10 Longitude ( ) 0 1 Norm. I 0.1 0.2 0.3 0.4 F r e q. ( 1 / P 3 ) J2006+4058 20210324 2DFS: W 0.3 0.6 Norm. Power 200 0 200 Freq. (1/P2) 0 1 Norm. P. 0.1 0.2 0.3 0.4 F r e q. ( 1 / P 3 ) J2006+4058 20210324 [PITH_FULL_IMAGE:figures/full_fig_p272_816.png] view at source ↗
Figure 817
Figure 817. Figure 817: Fluctuation analysis of PSR J2006+4058 for the observation on 20210324, with LRFS and 2DFS for the on-pulse region of a mean pulse profile. 0 10 20 25 50 75 100 125 150 175 200 Pulse No. I/ bin J2009+3326 20200125 20 0 20 Longitude ( ) 0 1 I/Ipeak 0 50 E/ E [PITH_FULL_IMAGE:figures/full_fig_p272_817.png] view at source ↗
Figure 820
Figure 820. Figure 820: Single pulse sequence of PSR J2011+3006g from the FAST observation on 20230507, and a zoomed-in view of pulses No. 1200-1800. are distinguished into weak or bright emission modes, which correspond to two colors in the central bar of the single pulse sequence. 4.327. J2016+1948 PSR J2016+1948 was discovered by the Arecibo Radio Telescope (Navarro et al. 2003). This pulsar was observed by FAST on 20201110 … view at source ↗
Figure 819
Figure 819. Figure 819: Fluctuation analysis of PSR J2009+3326 from the FAST ob￾servation on 20200125, with LRFS (top-left), and 2DFS for the on-pulse region (top-right), leading part (bottom-left) and trailing part (bottom-right) of a mean pulse profile. sponding to periodicities of P3 = 2.236 ± 0.002 periods and P2 = 6.6 ± 0.2 ◦ . 4.326. J2015+2524 PSR J2015+2524 was found by the 305 m radio telescope at Arecibo (Nice et al. … view at source ↗
Figure 822
Figure 822. Figure 822: Single pulse sequence of PSR J2011+3521g from the FAST observation on 20230804. 0 10 20 30 E/ E 0 20 40 60 80 Number (× 0.5) J2011+3521g 20230804 0.5 0.0 0.5 1.0 1.5 2.0 2.5 I/<I> [PITH_FULL_IMAGE:figures/full_fig_p274_822.png] view at source ↗
Figure 821
Figure 821. Figure 821: Fluctuation analysis of PSR J2011+3006g from the FAST observation on 20230507, with LRFS (top-left), and 2DFS for the leading (top-right), central (bottom-left) and trailing parts (bottom-right) of the mean pulse profile. observation, a rotation period and a dispersion measure are derived to be P = 2.1785 s and a dispersion measure DM = 380.1 cm−3 pc. Single pulses of two observations in [PITH_FULL_IMAG… view at source ↗
Figure 824
Figure 824. Figure 824: Fluctuation analysis of PSR J2011+3521g for the observation on 20230804, with LRFS and 2DFS for the on-pulse region of a mean pulse profile. PSR J2022+5154 was discovered by the Jodrell Bank Mk I telescope (Davies & Large 1970). Subpulse drifting with variable drift rate has been presented by Oster et al. (1977) at 1720 MHz and (Weltevrede et al. 2006) at 21 cm. Chen et al. (2024) reported a 5-period sub… view at source ↗
Figure 825
Figure 825. Figure 825: Single pulse sequence of PSR J2015+2524 from the FAST observation on 20210618. The green and red bars represent bright or weak emission modes. In the right subpanel, the on-pulse energy variation is plot￾ted against period, with dashed lines for thresholds to distinguish two states. 0 20 40 Number I = 0 J2015+2524 20210618 0 20 40 60 80 E/ E 0 2 4 6 8 10 I/<I> [PITH_FULL_IMAGE:figures/full_fig_p275_825.png] view at source ↗
Figure 826
Figure 826. Figure 826: On-pulse energy histogram of single pulses of PSR J2015+2524 from the FAST observation on 20210618. The red and green bars indicate the weak and bright emission modes. havior of the pulsar. The nulling fraction is estimated to be 54±4% from the on-pulse integral energy histogram in [PITH_FULL_IMAGE:figures/full_fig_p275_826.png] view at source ↗
Figure 827
Figure 827. Figure 827: Single pulse sequence of PSR J2016+1948 from the FAST observation on 20201110, and a zoomed-in view of pulses No. 1370-1539. LRFS 0.6 0.8 Norm. Power 25 0 Longitude ( ) 0 1 Norm. I T 0.1 0.2 0.3 0.4 F r e q. ( 1 / P 3 ) J2016+1948 20201110 2DFS: T 0.4 0.8 Norm. Power 200 0 200 Freq. (1/P2) 0 1 Norm. P. 0.1 0.2 0.3 0.4 F r e q. ( 1 / P 3 ) J2016+1948 20201110 [PITH_FULL_IMAGE:figures/full_fig_p276_827.png] view at source ↗
Figure 830
Figure 830. Figure 830: On-pulse energy histogram of single pulses of PSR J2016+3318g from the FAST observation on 20241026. This pulsar was observed by FAST on 20220606 for 15 minutes and 20250427 for 50 minutes. From the longer observation, a rotation period P = 1.3613 s and a dis￾persion measure DM = 332.9 cm−3 pc were determined. The single pulse sequence of the observation on 20250427 is shown in [PITH_FULL_IMAGE:figures/… view at source ↗
Figure 828
Figure 828. Figure 828: Fluctuation analysis of PSR J2016+1948 for the FAST obser￾vation on 20201110, with LRFS and 2DFS for the trailing part of a mean pulse profile. 0 5 20 40 60 80 100 120 Pulse No. I/ bin J2016+3318g 20240909 10 0 Longitude ( ) 0 1 I/Ipeak 0 5 E/ E 0 8 16 50 100 150 200 250 300 350 400 Pulse No. I/ bin J2016+3318g 20241026 10 0 10 Longitude ( ) 0 1 I/Ipeak 0 10 E/ E [PITH_FULL_IMAGE:figures/full_fig_p276_8… view at source ↗
Figure 832
Figure 832. Figure 832: Single pulse sequence of PSR J2022+5154 from FAST obser￾vations on 20220917, and a zoomed-in view of pulses No. 1-300. tion of this observation is estimated to be 4.3±0.3% from the on-pulse energy histogram in [PITH_FULL_IMAGE:figures/full_fig_p277_832.png] view at source ↗
Figure 831
Figure 831. Figure 831: Fluctuation analysis of PSR J2016+3318g for FAST observa￾tions on 20240909 and 20241026, with LRFS and 2DFS for the trailing and leading parts of mean pulse profiles. P2 = −8 ± 1 ◦ . The drifting parameters from the observa￾tion on 20220606 are consistent with 20250427, which are P3 = 48 ± 2 periods and P2 = −10 ± 2 ◦ . 4.332. J2030+2228 PSR J2030+2228 was discovered by the Arecibo telescope (Hulse & Tay… view at source ↗
Figure 834
Figure 834. Figure 834: Single pulse sequence of PSR J2026+3656 from the FAST observation on 20211210. 0 20 40 60 80 E/ E 0 50 100 150 Number J2026+3656 20211210 0 2 4 6 8 I/<I> [PITH_FULL_IMAGE:figures/full_fig_p278_834.png] view at source ↗
Figure 833
Figure 833. Figure 833: Fluctuation analysis of PSR J2022+5154 from the FAST ob￾servation on 20220917, with LRFS (top-left), and 2DFS for the on-pulse region (top-right), leading part (bottom-left) and trailing part (bottom-right) of the mean pulse profile. sequence and a zoomed-in view of pulses No. 1000-1300 in [PITH_FULL_IMAGE:figures/full_fig_p278_833.png] view at source ↗
Figure 836
Figure 836. Figure 836: Single pulse sequence of PSR J2029+4453g from the FAST observation on 20250427, and a zoomed-in view of pulses No. 1-560. LRFS 0.3 0.6 Norm. Power 5 0 5 Longitude ( ) 0 1 Norm. I L T 0.1 0.2 0.3 0.4 F r e q. ( 1 / P 3 ) J2029+4453g 20250427 2DFS: T 0.4 0.8 Norm. Power 250 0 250 Freq. (1/P2) 0 1 Norm. P. 0.1 0.2 0.3 0.4 F r e q. ( 1 / P 3 ) J2029+4453g 20250427 [PITH_FULL_IMAGE:figures/full_fig_p279_836.png] view at source ↗
Figure 839
Figure 839. Figure 839: On-pulse energy histogram of single pulses of PSR J2030+2228 from the FAST observation on 20210619. PSR J2037+3621 was discovered in the Princeton-NRAO pulsar survey with the 92 m telescope at Green Bank (Dewey et al. 1985). This pulsar was observed by FAST on 20230729 for 5 min￾utes, deriving a rotation period P = 0.6187 s and a dis￾persion measure DM = 93.9 cm−3 pc. The single pulse sequence in [PITH_… view at source ↗
Figure 837
Figure 837. Figure 837: Fluctuation analysis of PSR J2029+4453g for the observation on 20250427, with LRFS and 2DFS for the trailing part of a mean pulse profile. 0 30 60 100 200 300 400 Pulse No. I/ bin J2030+2228 20210619 10 0 10 Longitude ( ) 0 1 I/Ipeak 0 250 E/ E 0 30 60 130 140 150 160 170 Pulse No. I/ bin J2030+2228 20210619 10 0 10 Longitude ( ) 0 1 I/Ipeak 0 250 E/ E [PITH_FULL_IMAGE:figures/full_fig_p279_837.png] view at source ↗
Figure 842
Figure 842. Figure 842: Fluctuation analysis of PSR J2030+31 for the observation on 20240726, with LRFS and 2DFS for the trailing part of a mean pulse profile. 0 4 0 250 500 750 1000 1250 1500 1750 2000 Pulse No. I/ bin J2032+4127 20200402 25 0 25 Longitude ( ) 0 1 I/Ipeak 0 20 E/ E 0 4 1050 1100 1150 1200 1250 Pulse No. I/ bin J2032+4127 20200402 25 0 25 Longitude ( ) 0 1 I/Ipeak 0 10 E/ E [PITH_FULL_IMAGE:figures/full_fig_p2… view at source ↗
Figure 840
Figure 840. Figure 840: Single pulse sequence of PSR J2030+31 from the FAST ob￾servation on 20240726. 0 10 20 30 E/ E 0 20 40 60 Number (× 0.5) J2030+31 20240726 0 1 2 3 I/<I> [PITH_FULL_IMAGE:figures/full_fig_p280_840.png] view at source ↗
Figure 841
Figure 841. Figure 841: On-pulse energy histogram of single pulses of PSR J2030+31 from the FAST observation on 20240726. 4.337. J2038+5319 PSR J2038+5319 was discovered in the Princeton-NRAO pulsar survey using the 92 m telescope at Green Bank (Dewey et al. 1985). This pulsar was observed by FAST on 20221122 for 5 minutes, yielding a rotation period P = 1.4246 s and a dispersion measure DM = 160.0 cm−3 pc. Single pulse sequenc… view at source ↗
Figure 843
Figure 843. Figure 843: Single pulse sequence of PSR J2032+4127 from the FAST observation on 20200402, with a zoomed-in view of pulses No. 1000-1300 [PITH_FULL_IMAGE:figures/full_fig_p280_843.png] view at source ↗
Figure 844
Figure 844. Figure 844: On-pulse energy histogram of single pulses of PSR J2032+4127 from the FAST observation on 20200402. 20 0 20 40 Longitude ( ) 0.0 0.4 0.8 I/Ip e a k J2032+4127 20200402 Aver. Prof. Weak Bright [PITH_FULL_IMAGE:figures/full_fig_p281_844.png] view at source ↗
Figure 845
Figure 845. Figure 845: Mean profiles of weak and bright emission modes of PSR J2032+4127 from the FAST observation on 20200402. LRFS 0.6 0.8 Norm. Power 25 0 25 Longitude ( ) 0 1 Norm. I 0.1 0.2 0.3 0.4 0.5 F r e q. ( 1 / P 3 ) J2032+4127 20200402 2DFS: W 0.4 0.8 Norm. Power 50 0 50 Freq. (1/P2) 0 1 Norm. P. 0.1 0.2 0.3 0.4 0.5 F r e q. ( 1 / P 3 ) J2032+4127 20200402 [PITH_FULL_IMAGE:figures/full_fig_p281_845.png] view at source ↗
Figure 848
Figure 848. Figure 848: On-pulse energy histogram of single pulses of PSR J2036+2835 from the FAST observation on 20210616. PSR J2041+4551 was discovered in the Green Bank 820 MHz Pulsar Survey (McEwen et al. 2024). This pulsar was observed by FAST on 20220606 for 15 minutes, deriving a rotation period P = 1.1597 s and a dis￾persion measure DM = 307.2 cm−3 pc. The single pulse se￾quence in [PITH_FULL_IMAGE:figures/full_fig_p28… view at source ↗
Figure 849
Figure 849. Figure 849: Single pulse sequence of PSR J2037+3621 from the FAST observation on 20221122. LRFS 0.25 0.50 Norm. Power 0 25 Longitude ( ) 0 1 Norm. I 0.1 0.2 0.3 0.4 0.5 F r e q. ( 1 / P 3 ) J2037+3621 20230729 2DFS: W 0.4 0.8 Norm. Power 100 0 100 Freq. (1/P2) 0 1 Norm. P. 0.1 0.2 0.3 0.4 0.5 F r e q. ( 1 / P 3 ) J2037+3621 20230729 [PITH_FULL_IMAGE:figures/full_fig_p282_849.png] view at source ↗
Figure 850
Figure 850. Figure 850: Fluctuation analysis of PSR J2037+3621 for the observation on 20230729, with LRFS and 2DFS for the on-pulse phase region of a mean pulse profile. 0 15 20 40 60 80 Pulse No. I/ bin J2038+5319 20221122 10 0 10 Longitude ( ) 0 1 I/Ipeak 0 25 E/ E 0 15 120 140 160 180 Pulse No. I/ bin J2038+5319 20221122 10 0 10 Longitude ( ) 0 1 I/Ipeak 0 25 E/ E [PITH_FULL_IMAGE:figures/full_fig_p282_850.png] view at source ↗
Figure 853
Figure 853. Figure 853: Single pulse sequence of PSR J2041+4551 from the FAST observation on 20220606. 0 20 40 60 80 100 120 E/ E 0 20 40 60 80 Number (× 0.2) J2041+4551 20220606 0 1 2 3 4 5 I/<I> [PITH_FULL_IMAGE:figures/full_fig_p283_853.png] view at source ↗
Figure 856
Figure 856. Figure 856: On-pulse energy histogram of single pulses of PSR J2044+4614 from the FAST observation on 20210324. persion measure DM = 316.0 cm−3 pc. The single pulse sequence in [PITH_FULL_IMAGE:figures/full_fig_p283_856.png] view at source ↗
Figure 858
Figure 858. Figure 858: Single pulse sequence of PSR J2045+3633 from the FAST observation on 20210708, and a zoomed-in view of pulses No. 980-1200. observation, a rotation period P = 0.0317 s and a disper￾sion measure DM = 129.6 cm−3 pc were determined. Sin￾gle pulse sequences of the data on 20210708 are shown in [PITH_FULL_IMAGE:figures/full_fig_p284_858.png] view at source ↗
Figure 857
Figure 857. Figure 857: Fluctuation analysis of PSR J2044+4614 from the FAST ob￾servation on 20210324, with LRFS (top-left), and 2DFS for the on-pulse region (top-right), leading part (bottom-left) and trailing part (bottom-right) of a mean pulse profile. frequencies of 1/P3 = 0.122 ± 0.003 and 1/P2 = −15 ± 2, yielding P3 = 8.2 ± 0.2 periods and P2 = −24 ± 3 ◦ . In the single pulse sequence, there seems to be a quasi-periodic v… view at source ↗
Figure 860
Figure 860. Figure 860: Single pulse sequences of PSR J2046+1540 from FAST ob￾servations on 20250217. This pulsar was observed by FAST on 20250217 for 11 minutes, deriving a rotation period P = 1.1383 s and a dis￾persion measure DM = 39.7 cm−3 pc. Single pulse se￾quences in [PITH_FULL_IMAGE:figures/full_fig_p285_860.png] view at source ↗
Figure 859
Figure 859. Figure 859: Fluctuation analysis of PSR J2045+3633 from the FAST ob￾servation on 20210708, with LRFS (top-left), and 2DFS for the leading part (top-right), central part (bottom-left) and trailing part (bottom-right) of a mean pulse profile. P3 = 18 ± 6 periods and P2 = −7.1 +0.5 −1.4 degrees. At 92 cm, Weltevrede et al. (2007) reported values of P3 = 18 ± 4 periods, P2 = −25+10 −10 degrees and P3 = 13 ± 1 periods, P… view at source ↗
Figure 862
Figure 862. Figure 862: Single pulse sequences of PSR J2048+4951 from the FAST observation on 20250210. PSR J2053+4718 was discovered by FAST in the Com￾mensal Radio Astronomy FAST Survey (CRAFTS) (Cruces et al. 2021). The pulsar was observed by FAST on 20200810 for 15 minutes, deriving a rotation period P = 4.9102 s and a dis￾persion measure DM = 322.3 cm−3 pc were determined. Single pulse sequences in [PITH_FULL_IMAGE:figure… view at source ↗
Figure 861
Figure 861. Figure 861: Fluctuation analysis of PSR J2046+1540 from the FAST ob￾servation on 20250217, with LRFS (top-left), and 2DFS for the on-pulse region (top-right), leading part (bottom-left) and trailing part (bottom-right) of the mean pulse profile. 2DFS of the leading part in the mean pulse profile has a temporal modulation feature with the centroid frequency of 1/P3 = 0.085 ± 0.002, corresponding to P3 = 11.8 ± 0.2 pe… view at source ↗
Figure 864
Figure 864. Figure 864: Single pulse sequences of PSR J2053+4718 from the FAST observation on 20200810. 0 20 40 60 E/ E 0 20 40 60 Number J2053+4718 20200810 0 2 4 6 I/<I> [PITH_FULL_IMAGE:figures/full_fig_p287_864.png] view at source ↗
Figure 863
Figure 863. Figure 863: Fluctuation analysis of PSR J2048+4951 for the observation on 20250210, with LRFS (top-left), and 2DFS for the on-pulse phase region (top-right), leading part (bottom-left) and trailing part (bottom-right) of a mean pulse profile. Weltevrede et al. (2006). The centroid of the drift feature is characterized by frequencies of 1/P3 = 0.097 ± 0.001 and 1/P2 = 2.3 ± 0.7, corresponding to periodicities of P3 =… view at source ↗
Figure 866
Figure 866. Figure 866: Cross correlation of PSR J2053+4718 from the FAST obser￾vation on 20200810 [PITH_FULL_IMAGE:figures/full_fig_p287_866.png] view at source ↗
Figure 869
Figure 869. Figure 869: Fluctuation analysis of PSR J2055+3630 for the observation on 20210621, with LRFS and 2DFS for the on-pulse region of a mean pulse profile. 0 3 0 500 1000 1500 2000 2500 3000 3500 Pulse No. I/ bin J2101+5028g 20240920 10 0 10 Longitude ( ) 0 1 I/Ipeak 0 5 10 E/ E 0 3 100 200 300 400 500 Pulse No. I/ bin J2101+5028g 20240920 10 0 10 Longitude ( ) 0 1 I/Ipeak 0 5 10 E/ E [PITH_FULL_IMAGE:figures/full_fig_… view at source ↗
Figure 867
Figure 867. Figure 867: Single pulse sequences of PSR J2055+3630 from the FAST observation on 20210621. 0 20 40 60 80 100 120 E/ E 0 50 100 150 Number (× 0.1) J2055+3630 20210621 0.0 0.5 1.0 1.5 2.0 I/<I> [PITH_FULL_IMAGE:figures/full_fig_p288_867.png] view at source ↗
Figure 868
Figure 868. Figure 868: On-pulse energy histogram of single pulses of PSR J2055+3630 from the FAST observation on 20210621. This pulsar was observed by FAST on 20240731 for 5 min￾utes and 20240920 for 15 minutes, with a rotation period of 0.2544 s and a dispersion measurement of 157.2 cm−3pc from the observation on 20240920. Single pulse sequences and fluctuation spectra of the observation on 20240920 are shown in [PITH_FULL_I… view at source ↗
Figure 870
Figure 870. Figure 870: Single pulse sequences of PSR J2101+5028g from the FAST observation on 20240920 [PITH_FULL_IMAGE:figures/full_fig_p288_870.png] view at source ↗
Figure 873
Figure 873. Figure 873: Histogram of the smoothed on-pulse integral energy for single pulses of PSR J2103+4602g from the FAST observation on 20240314. The red and green bars indicate the weak and bright emission modes. 0 15 30 20 40 60 80 100 120 140 Pulse No. I/ bin J2105+07 20210118 10 0 10 Longitude ( ) 0 1 I/Ipeak 0 25 E/ E [PITH_FULL_IMAGE:figures/full_fig_p289_873.png] view at source ↗
Figure 871
Figure 871. Figure 871: Fluctuation analysis of PSR J2101+5028g for the observation on 20240920, with LRFS and 2DFS for the on-pulse region of a mean pulse profile. 0 5 10 50 100 150 200 250 300 Pulse No. I/ bin J2103+4602g 20240314 10 0 Longitude ( ) 0 1 I/Ipeak 0 5 E/ E 0 5 10 350 400 450 500 550 600 650 Pulse No. I/ bin J2103+4602g 20240314 10 0 Longitude ( ) 0 1 I/Ipeak 0 5 E/ E [PITH_FULL_IMAGE:figures/full_fig_p289_871.png] view at source ↗
Figure 874
Figure 874. Figure 874: Single pulse sequence of PSR J2105+07 from the FAST ob￾servation on 20210118. 4.346. J2103+4602g PSR J2103+4602g was discovered in the FAST GPPS sur￾vey (Han et al. 2021, 2025). The pulsar was observed by FAST on 20240314 for 15 minutes, and the rotation period and a dispersion measure are estimated to be P = 1.3599 s and a dispersion measure DM = 207.2 cm−3 pc. Two segments of bright emission are exhibi… view at source ↗
Figure 872
Figure 872. Figure 872: Single pulse sequences of PSR J2103+4602g from the FAST observation on 20240314. The on-pulse energy variation versus period is smoothed over every 5 periods. 0 40 80 Number I = 0 J2103+4602g 20240314 2 0 2 4 6 E/ E 5 0 5 10 15 I/<I> [PITH_FULL_IMAGE:figures/full_fig_p289_872.png] view at source ↗
Figure 875
Figure 875. Figure 875: On-pulse energy histogram of single pulses of PSR J2105+07 from the FAST observation on 20210118. LRFS 0.3 0.6 Norm. Power 10 0 10 Longitude ( ) 0 1 Norm. I T 0.1 0.2 0.3 0.4 F r e q. ( 1 / P 3 ) J2105+07 20210118 2DFS: T 0.4 0.8 Norm. Power 250 0 250 Freq. (1/P2) 0 1 Norm. P. 0.1 0.2 0.3 0.4 F r e q. ( 1 / P 3 ) J2105+07 20210118 [PITH_FULL_IMAGE:figures/full_fig_p290_875.png] view at source ↗
Figure 877
Figure 877. Figure 877: Single pulse sequence of PSR J2108+4441 from the FAST observation on 20200308. LRFS 0.3 0.6 Norm. Power 25 0 25 Longitude ( ) 0 1 Norm. I 0.1 0.2 0.3 0.4 0.5 F r e q. ( 1 / P 3 ) J2108+4441 20200308 2DFS: W 0.4 0.8 Norm. Power 50 0 50 Freq. (1/P2) 0 1 Norm. P. 0.1 0.2 0.3 0.4 0.5 F r e q. ( 1 / P 3 ) J2108+4441 20200308 [PITH_FULL_IMAGE:figures/full_fig_p290_877.png] view at source ↗
Figure 878
Figure 878. Figure 878: Fluctuation analysis of PSR J2108+4441 for the observation on 20200308, with LRFS and 2DFS for the on-pulse region of a mean pulse profile [PITH_FULL_IMAGE:figures/full_fig_p290_878.png] view at source ↗
Figure 881
Figure 881. Figure 881: On-pulse energy histogram of single pulses of PSR J2112+4058 from the FAST observation on 20211129. 0 25 50 100 200 300 400 500 600 700 800 Pulse No. I/ bin J2116+1414 20250317 20 0 Longitude ( ) 0 1 I/Ipeak 0 100 E/ E 0 25 50 125 150 175 200 225 250 275 Pulse No. I/ bin J2116+1414 20250317 20 0 Longitude ( ) 0 1 I/Ipeak 0 100 E/ E [PITH_FULL_IMAGE:figures/full_fig_p291_881.png] view at source ↗
Figure 879
Figure 879. Figure 879: Single pulse sequence of PSR J2112+4058 from the FAST observation on 20211129. 10 5 0 5 10 Longitude interval ( °) 0.0 0.4 0.8 Norm. corre. coeffi. J2112+4058 20211129 [PITH_FULL_IMAGE:figures/full_fig_p291_879.png] view at source ↗
Figure 880
Figure 880. Figure 880: Cross correlation of PSR J2112+4058 from the observation on 20211129. 4.348. J2108+4441 PSR J2108+4441 was discovered by Davies et al. (1973) using the Mark 1A radio telescope at Jodrell Bank. Low frequency modulation has been detected (Weltevrede et al. 2006, 2007). The pulsar was observed by FAST on 20200308 for 5 minutes, deriving a rotation period P = 0.4149 s and a dispersion measure DM = 140.1 cm−3… view at source ↗
Figure 885
Figure 885. Figure 885: On-pulse energy histogram of single pulses of PSR J2116+3701 from the FAST observation on 20240720. LRFS 0.4 0.8 Norm. Power 10 0 10 Longitude ( ) 0 1 Norm. I 0.1 0.2 0.3 0.4 F r e q. ( 1 / P 3 ) J2116+3701 20240720 2DFS: W 0.4 0.8 Norm. Power 100 0 100 Freq. (1/P2) 0 1 Norm. P. 0.1 0.2 0.3 0.4 F r e q. ( 1 / P 3 ) J2116+3701 20240720 [PITH_FULL_IMAGE:figures/full_fig_p292_885.png] view at source ↗
Figure 883
Figure 883. Figure 883: Fluctuation analysis of PSR J2116+1414 for the observation on 20250317, with LRFS and 2DFS for the on-pulse region of a mean pulse profile. 0 15 200 400 600 800 1000 Pulse No. I/ bin J2116+3701 20240720 10 0 10 Longitude ( ) 0 1 I/Ipeak 0 100 E/ E 0 15 1200 1400 1600 1800 2000 Pulse No. I/ bin J2116+3701 20240720 10 0 10 Longitude ( ) 0 1 I/Ipeak 0 100 E/ E [PITH_FULL_IMAGE:figures/full_fig_p292_883.png] view at source ↗
Figure 886
Figure 886. Figure 886: Fluctuation analysis of PSR J2116+3701 for the observation on 20240720, with LRFS and 2DFS for the on-pulse region of a mean pulse profile. This pulsar was observed by FAST on 20211129 for 5 min￾utes, deriving a rotation period P = 4.0612 s and a dis￾persion measure DM = 125.7 cm−3 pc. The nulling frac￾tion is estimated from the energy histogram in [PITH_FULL_IMAGE:figures/full_fig_p292_886.png] view at source ↗
Figure 884
Figure 884. Figure 884: Single pulse sequences of PSR J2116+3701 from the FAST observation on 20240720. 0 20 40 60 80 100 120 E/ E 0 200 400 600 Number J2116+3701 20240720 0 10 20 30 40 I/<I> [PITH_FULL_IMAGE:figures/full_fig_p292_884.png] view at source ↗
Figure 887
Figure 887. Figure 887: Single pulse sequences of PSR J2122+2426 from the FAST observation on 20210427. LRFS 0.3 0.6 Norm. Power 0 25 Longitude ( ) 0 1 Norm. I L T 0.1 0.2 0.3 0.4 F r e q. ( 1 / P 3 ) J2122+2426 20210427 2DFS: W 0.25 0.50 Norm. Power 100 0 100 Freq. (1/P2) 0 1 Norm. P. 0.1 0.2 0.3 0.4 F r e q. ( 1 / P 3 ) J2122+2426 20210427 [PITH_FULL_IMAGE:figures/full_fig_p293_887.png] view at source ↗
Figure 888
Figure 888. Figure 888: Fluctuation analysis of PSR J2122+2426 for the observation on 20210427, with LRFS and 2DFS for the on-pulse region of a mean pulse profile. 0 8 20 40 60 80 100 120 Pulse No. I/ bin J2123+36 20250125 10 0 10 Longitude ( ) 0 1 I/Ipeak 0 10 E/ E 0 8 140 160 180 200 220 240 Pulse No. I/ bin J2123+36 20250125 10 0 10 Longitude ( ) 0 1 I/Ipeak 0 10 E/ E [PITH_FULL_IMAGE:figures/full_fig_p293_888.png] view at source ↗
Figure 891
Figure 891. Figure 891: Single pulse sequence of PSR J2125+52 from the FAST ob￾servation on 20240731. 0 10 20 30 E/ E 0 5 10 15 20 Number J2125+52 20240731 0 1 2 3 I/<I> [PITH_FULL_IMAGE:figures/full_fig_p294_891.png] view at source ↗
Figure 892
Figure 892. Figure 892: On-pulse energy histogram of single pulses of PSR J2125+52 from the FAST observation on 20240731. quence and a zoomed-in view of pulses No. 100-300 are shown in [PITH_FULL_IMAGE:figures/full_fig_p294_892.png] view at source ↗
Figure 894
Figure 894. Figure 894: Fluctuation analysis of PSR J2138+4911 for the observation on 20200402, with LRFS and 2DFS for the on-pulse region of a mean pulse profile. 0 25 50 200 400 600 800 Pulse No. I/ bin J2150+5247 20221120 20 0 20 Longitude ( ) 0 1 I/Ipeak 0 100 E/ E 0 25 50 125 150 175 200 225 250 275 Pulse No. I/ bin J2150+5247 20221120 20 0 20 Longitude ( ) 0 1 I/Ipeak 0 100 E/ E [PITH_FULL_IMAGE:figures/full_fig_p295_894.png] view at source ↗
Figure 896
Figure 896. Figure 896: Fluctuation analysis of PSR J2150+5247 for the observation on 20221120, with LRFS (top-left), and 2DFS for the leading part (top￾right), central part (bottom-left) and trailing part (bottom-right) of a mean pulse profile. tra shown in [PITH_FULL_IMAGE:figures/full_fig_p295_896.png] view at source ↗
Figure 895
Figure 895. Figure 895: The single pulse sequence of PSR J2150+5247 from the FAST observation on 20221120, and a zoomed-in view of pulses No.101-300. LRFS 0.3 0.6 Norm. Power 0 25 Longitude ( ) 0 1 Norm. I L C T 0.1 0.2 0.3 0.4 F r e q. ( 1 / P 3 ) J2150+5247 20221120 2DFS: L 0.4 0.8 Norm. Power 250 0 250 Freq. (1/P2) 0 1 Norm. P. 0.1 0.2 0.3 0.4 F r e q. ( 1 / P 3 ) J2150+5247 20221120 2DFS: C 0.4 0.8 Norm. Power 200 0 200 Fre… view at source ↗
Figure 897
Figure 897. Figure 897: Single pulse sequence of PSR J2153+44 from the FAST ob￾servation on 20240712. 0 10 20 30 40 50 E/ E 0 10 20 30 Number (× 0.6) J2153+44 20240712 0 1 2 3 4 5 I/<I> [PITH_FULL_IMAGE:figures/full_fig_p296_897.png] view at source ↗
Figure 898
Figure 898. Figure 898: On-pulse energy histogram of single pulses of PSR J2153+44 from the FAST observation on 20240712. quences in [PITH_FULL_IMAGE:figures/full_fig_p296_898.png] view at source ↗
Figure 901
Figure 901. Figure 901: Single pulse sequence of PSR J2209+22 from the FAST ob￾servation on 20210129. 5 0 5 10 15 20 25 30 E/ E 0 10 20 30 40 Number (× 0.5) J2209+22 20210129 0 1 2 3 I/<I> [PITH_FULL_IMAGE:figures/full_fig_p297_901.png] view at source ↗
Figure 900
Figure 900. Figure 900: Fluctuation analysis of PSR J2208+4610 for the observation on 20211124, with LRFS (top-left), and 2DFS for the on-pulse region (top￾right), leading part (bottom-left) and trailing part (bottom-right) of a mean pulse profile. This pulsar was observed by FAST on 20221120 for 5 min￾utes, deriving a rotation period P = 0.3322 s and a dis￾persion measure DM = 148.8 cm−3 pc. The single pulse sequence and a zoo… view at source ↗
Figure 905
Figure 905. Figure 905: Single pulse sequence of PSR J2219+4754 from the FAST observation on 20210608, and a zoomed-in view of pulses No.150-300. LRFS 0.25 0.50 Norm. Power 10 0 10 Longitude ( ) 0 1 Norm. I 0.1 0.2 0.3 0.4 F r e q. ( 1 / P 3 ) J2219+4754 20210608 2DFS: W 0.3 0.6 Norm. Power 250 0 250 Freq. (1/P2) 0 1 Norm. P. 0.1 0.2 0.3 0.4 F r e q. ( 1 / P 3 ) J2219+4754 20210608 [PITH_FULL_IMAGE:figures/full_fig_p298_905.png] view at source ↗
Figure 906
Figure 906. Figure 906: Fluctuation analysis of PSR J2219+4754 for the observation on 20210608, with LRFS and 2DFS for the on-pulse region of a mean pulse profile [PITH_FULL_IMAGE:figures/full_fig_p298_906.png] view at source ↗
Figure 907
Figure 907. Figure 907: Single pulse sequences of PSR J2258+5222g from the FAST observation on 20240723. 4.358. J2208+4610 PSR J2208+4610 was discovered by Dong et al. (2023) using the CHIME telescope. The pulsar was observed by FAST on 20211124 for 5 min￾utes, deriving a rotation period P = 0.6426 s and a disper￾sion measure DM = 62.1 cm−3 pc. The single pulse se￾quence in [PITH_FULL_IMAGE:figures/full_fig_p299_907.png] view at source ↗
Figure 909
Figure 909. Figure 909: Single pulse sequences of PSR J2329+4743 from the FAST observation on 20201028. This pulsar was observed by FAST on 20250317 for 6 min￾utes, deriving a rotation period P = 0.3742 s and a dis￾persion measure DM = 29.1 cm−3 pc. The single pulse sequence and a zoomed-in view of pulses No. 100-270 in [PITH_FULL_IMAGE:figures/full_fig_p300_909.png] view at source ↗
Figure 910
Figure 910. Figure 910: Fluctuation analysis of PSR J2329+4743 for the observation on 20201028, with LRFS (top-left), and 2DFS for the on-pulse region (top￾right), leading part (bottom-left) and central part (bottom-right) of a mean pulse profile. pulses. The 2DFS in [PITH_FULL_IMAGE:figures/full_fig_p300_910.png] view at source ↗
Figure 911
Figure 911. Figure 911: The single pulse sequence of PSR J2338+4818 from the FAST observation on 20250225, and a zoomed-in view of pulses No. 101-400. LRFS 0.4 0.6 0.8 Norm. Power 25 0 Longitude ( ) 0 1 Norm. I T 0.1 0.2 0.3 0.4 F r e q. ( 1 / P 3 ) J2338+4818 20250225 2DFS: T 0.4 0.8 Norm. Power 100 0 100 Freq. (1/P2) 0 1 Norm. P. 0.1 0.2 0.3 0.4 F r e q. ( 1 / P 3 ) J2338+4818 20250225 [PITH_FULL_IMAGE:figures/full_fig_p301_… view at source ↗
Figure 912
Figure 912. Figure 912: Fluctuation analysis of PSR J2338+4818 for the observation on 20250225, with LRFS and 2DFS for the trailing part of a mean pulse profile. 0 4 0 200 400 600 800 1000 1200 1400 1600 Pulse No. I/ bin J2340+08 20210125 50 0 50 Longitude ( ) 0 1 I/Ipeak 0 10 E/ E 0 4 1350 1400 1450 1500 1550 Pulse No. I/ bin J2340+08 20210125 50 0 50 Longitude ( ) 0 1 I/Ipeak 0 10 E/ E [PITH_FULL_IMAGE:figures/full_fig_p301_… view at source ↗
Figure 915
Figure 915. Figure 915: Single pulse sequences of PSR J2346-0609 from the FAST observation on 20250223. The on-pulse energy variation versus period is smoothed over every 5 periods. 0 100 200 300 400 E/ E 0 10 20 30 40 50 Number (× 0.25) J2346-0609 20250223 0 1 2 3 4 I/<I> 0 20 40 0 20 40 (× 0.25) [PITH_FULL_IMAGE:figures/full_fig_p302_915.png] view at source ↗
Figure 916
Figure 916. Figure 916: On-pulse energy histogram of single pulses of PSR J2346- 0609 from the FAST observation on 20250223. The inset provides a view of the xaxis region from -10 to 45. PSR J2340+08 was discovered by Deneva et al. (2013) us￾ing the Arecibo telescope at 327 MHz. The pulsar was observed by FAST on 20210125 for 9 min￾utes, deriving a rotation period P = 0.3033 s and a dis￾persion measure DM = 23.2 cm−3 pc. Single… view at source ↗
Figure 917
Figure 917. Figure 917: Histogram of the smoothed integral energy for the leading profile part of single pulses of PSR J2346-0609. The red and green bars indicate the weak and bright emission modes. The data is from the FAST observation on 20250223. 0.0 0.5 1.0 N orm aliz e d I J2346-0609 20250223 I L V 5 0 5 10 15 20 Longitude ( ) 60 0 60 120 PA (°) Weak Bright [PITH_FULL_IMAGE:figures/full_fig_p303_917.png] view at source ↗
Figure 918
Figure 918. Figure 918: Mean polarization profiles (the top panel) for weak and bright emission modes of PSR J2346-0609 observed on 20250223, as well as the averaged PA curves (the bottom panel). and P2 = 18.2 ± 0.5 ◦ . Additionally, there is also a low￾frequency modulation in 2DFS with a centroid temporally modulated frequency of 1/P3 = 0.016 ± 0.001, yielding the periodicity of P3 = 61 ± 4 periods. From the zoomed-in single p… view at source ↗
Figure 920
Figure 920. Figure 920: P − P˙ diagram for known pulsars and pulsars in this paper. All known pulsars are the grey dots. Pulsars with nulling, mode changing, or subpulse modulation phenomena are represented by blue circles, green pluses, and red minus signs. The traditional death line is drawn for BP −2 = 0.17 × 10¹²Gs−2 (Ruderman & Sutherland 1975) [PITH_FULL_IMAGE:figures/full_fig_p305_920.png] view at source ↗
Figure 921
Figure 921. Figure 921: The distribution of fundamental parameters (rotation period P, period derivation P˙ , characteristic age τ , magnetic field strength B and spin-down energy loss E˙ ) for pulsars with single pulse behaviours (nulling, mode-changing or subpulse drifting), compared with the distribution of all known pulsars from the ATNF pulsar catalog (Manchester et al. 2005). 2 1 0 log(P0) (s) 0.0 0.5 1.0 1.5 2.0 lo g(P 3… view at source ↗
Figure 922
Figure 922. Figure 922: Correlating subpulse drifting parameters (P3, P2 in degree or millisecond) with fundamental pulsar parameters taken from the ATNF pulsar catalog (Manchester et al. 2005). The Spearman correlation coefficient and the p-value are labeled in each panel [PITH_FULL_IMAGE:figures/full_fig_p306_922.png] view at source ↗

discussion (0)

Sign in with ORCID, Apple, or X to comment. Anyone can read and Pith papers without signing in.

Reference graph

Works this paper leans on

210 extracted references · 87 canonical work pages · 37 internal anchors

  1. [1]

    A., Ackermann , M., Ajello , M., et al

    Abdo , A. A., Ackermann , M., Ajello , M., et al. 2009, Science, 325, 840, 10.1126/science.1175558

  2. [2]

    Backer , D. C. 1970 a , , 228, 42, 10.1038/228042a0

  3. [3]

    1970 b , , 228, 1297, 10.1038/2281297a0

    ---. 1970 b , , 228, 1297, 10.1038/2281297a0

  4. [4]

    1970 c , , 227, 692, 10.1038/227692a0

    ---. 1970 c , , 227, 692, 10.1038/227692a0

  5. [5]

    1973, , 182, 245, 10.1086/152134

    ---. 1973, , 182, 245, 10.1086/152134

  6. [8]

    2018 a , , 475, 5098, 10.1093/mnras/sty178

    Basu , R., & Mitra , D. 2018 a , , 475, 5098, 10.1093/mnras/sty178

  7. [9]

    2018 b , , 476, 1345, 10.1093/mnras/sty297

    ---. 2018 b , , 476, 1345, 10.1093/mnras/sty297

  8. [10]

    Basu , R., Mitra , D., & Melikidze , G. I. 2017, , 846, 109, 10.3847/1538-4357/aa862d

  9. [12]

    I., et al

    Basu , R., Mitra , D., Melikidze , G. I., et al. 2016, , 833, 29, 10.3847/1538-4357/833/1/29

  10. [13]

    I., & Skrzypczak , A

    Basu , R., Mitra , D., Melikidze , G. I., & Skrzypczak , A. 2019 a , , 482, 3757, 10.1093/mnras/sty2846

  11. [14]

    2019 b , , 486, 5216, 10.1093/mnras/stz1225

    Basu , R., Paul , A., & Mitra , D. 2019 b , , 486, 5216, 10.1093/mnras/stz1225

  12. [18]

    2009, , 398, 1435, 10.1111/j.1365-2966.2009.15210.x

    Bhattacharyya , B., Gupta , Y., & Gil , J. 2009, , 398, 1435, 10.1111/j.1365-2966.2009.15210.x

  13. [19]

    Biggs , J. D. 1992, , 394, 574, 10.1086/171608

  14. [20]

    S., Ransom , S

    Boyles , J., Lynch , R. S., Ransom , S. M., et al. 2013, , 763, 80, 10.1088/0004-637X/763/2/80

  15. [21]

    Brinkman , C., Freire , P. C. C., Rankin , J., & Stovall , K. 2018, , 474, 2012, 10.1093/mnras/stx2842

  16. [24]

    D., Li , D., Hobbs , G., et al

    Cameron , A. D., Li , D., Hobbs , G., et al. 2020, , 495, 3515, 10.1093/mnras/staa1328

  17. [26]

    J., & Taylor , J

    Camilo , F., Nice , D. J., & Taylor , J. H. 1996 b , , 461, 812, 10.1086/177103

  18. [27]

    J., Lorimer , D

    Champion , D. J., Lorimer , D. R., McLaughlin , M. A., et al. 2005, , 363, 929, 10.1111/j.1365-2966.2005.09499.x

  19. [28]

    Chandler , A. M. 2003, PhD thesis, California Institute of Technology

  20. [32]

    R., Jones , A

    Clifton , T. R., Jones , A. W., & Lyne , A. G. 1987, in IAU Symposium, Vol. 125, The Origin and Evolution of Neutron Stars, ed. D. J. Helfand & J.-H. Huang , 47

  21. [35]

    M., Freire , P

    Cordes , J. M., Freire , P. C. C., Lorimer , D. R., et al. 2006, , 637, 446, 10.1086/498335

  22. [36]

    J., Li , D., et al

    Cruces , M., Champion , D. J., Li , D., et al. 2021, , 508, 300, 10.1093/mnras/stab2540

  23. [37]

    R., Taylor , J

    Damashek , M., Backus , P. R., Taylor , J. H., & Burkhardt , R. K. 1982, , 253, L57, 10.1086/183736

  24. [43]

    Deich , W. T. S., Cordes , J. M., Hankins , T. H., & Rankin , J. M. 1986, , 300, 540, 10.1086/163831

  25. [44]

    S., Stovall , K., McLaughlin , M

    Deneva , J. S., Stovall , K., McLaughlin , M. A., et al. 2013, , 775, 51, 10.1088/0004-637X/775/1/51

  26. [45]

    2016, , 821, 10, 10.3847/0004-637X/821/1/10

    ---. 2016, , 821, 10, 10.3847/0004-637X/821/1/10

  27. [49]

    D., & Craft , H

    Drake , F. D., & Craft , H. D. 1968, , 220, 231, 10.1038/220231a0

  28. [52]

    T., & Stappers , B

    Edwards , R. T., & Stappers , B. W. 2002, , 393, 733, 10.1051/0004-6361:20021067

  29. [53]

    G., Graham-Smith , F., et al

    Esamdin , A., Lyne , A. G., Graham-Smith , F., et al. 2005, , 356, 59, 10.1111/j.1365-2966.2004.08444.x

  30. [55]

    C., & Kramer , M

    Gajjar , V., Joshi , B. C., & Kramer , M. 2012, , 424, 1197, 10.1111/j.1365-2966.2012.21296.x

  31. [56]

    P., Yuen , R., et al

    Gajjar , V., Yuan , J. P., Yuen , R., et al. 2017, , 850, 173, 10.3847/1538-4357/aa96ac

  32. [58]

    2004, , 426, 229, 10.1051/0004-6361:20035657

    Gupta , Y., Gil , J., Kijak , J., & Sendyk , M. 2004, , 426, 229, 10.1051/0004-6361:20035657

  33. [59]

    L., Wang , C., Wang , P

    Han , J. L., Wang , C., Wang , P. F., et al. 2021, Research in Astronomy and Astrophysics, 21, 107, 10.1088/1674-4527/21/5/107

  34. [60]

    L., Zhou , D

    Han , J. L., Zhou , D. J., Wang , C., et al. 2025, Research in Astronomy and Astrophysics, 25, 014001, 10.1088/1674-4527/ada3b7

  35. [61]

    H., & Wolszczan , A

    Hankins , T. H., & Wolszczan , A. 1987, , 318, 410, 10.1086/165377

  36. [62]

    L., & Rankin , J

    Herfindal , J. L., & Rankin , J. M. 2007, , 380, 430, 10.1111/j.1365-2966.2007.12089.x

  37. [63]

    2009, , 393, 1391, 10.1111/j.1365-2966.2008.14119.x

    ---. 2009, , 393, 1391, 10.1111/j.1365-2966.2008.14119.x

  38. [64]

    Hessels , J. W. T., Ransom , S. M., Kaspi , V. M., et al. 2008, in American Institute of Physics Conference Series, Vol. 983, 40 Years of Pulsars: Millisecond Pulsars, Magnetars and More, ed. C. Bassa , Z. Wang , A. Cumming , & V. M. Kaspi (AIP), 613--615, 10.1063/1.2900310

  39. [68]

    W., van Straten , W., & Manchester , R

    Hotan , A. W., van Straten , W., & Manchester , R. N. 2004, , 21, 302, 10.1071/AS04022

  40. [71]

    1975, , 201, L55, 10.1086/181941

    ---. 1975, , 201, L55, 10.1086/181941

  41. [73]

    H., Stappers , B

    Janssen , G. H., Stappers , B. W., Braun , R., et al. 2009, , 498, 223, 10.1051/0004-6361/200811482

  42. [76]

    J., Johnston , S., et al

    Karastergiou , A., Roberts , S. J., Johnston , S., et al. 2011, , 415, 251, 10.1111/j.1365-2966.2011.18697.x

  43. [78]

    F., Barr , E

    Keane , E. F., Barr , E. D., Jameson , A., et al. 2018, , 473, 116, 10.1093/mnras/stx2126

  44. [80]

    J., Shannon , R

    Keith , M. J., Shannon , R. M., & Johnston , S. 2013, , 432, 3080, 10.1093/mnras/stt660

  45. [82]

    1979, The advanced theory of statistics

    Kendall , M., & Stuart , A. 1979, The advanced theory of statistics. Vol.2: Inference and relationship

  46. [83]

    M., & Rankin , J

    Kloumann , I. M., & Rankin , J. M. 2010, , 408, 40, 10.1111/j.1365-2966.2010.17114.x

  47. [85]

    F., Yuan , J

    Kou , F. F., Yuan , J. P., Wang , N., Yan , W. M., & Dang , S. J. 2018, , 478, L24, 10.1093/mnrasl/sly068

  48. [87]

    G., O'Brien , J

    Kramer , M., Lyne , A. G., O'Brien , J. T., Jordan , C. A., & Lorimer , D. R. 2006, Science, 312, 549, 10.1126/science.1124060

  49. [88]

    F., Manchester , R

    Kramer , M., Bell , J. F., Manchester , R. N., et al. 2003, , 342, 1299, 10.1046/j.1365-8711.2003.06637.x

  50. [92]

    R., Camilo , F., & Xilouris , K

    Lorimer , D. R., Camilo , F., & Xilouris , K. M. 2002, , 123, 1750, 10.1086/339026

  51. [93]

    A 1400-MHz pilot search for young pulsars

    Lorimer , D. R., Kramer , M., M \"u ller , P., et al. 2000, , 358, 169, 10.48550/arXiv.astro-ph/9910569

  52. [94]

    R., Lyne , A

    Lorimer , D. R., Lyne , A. G., McLaughlin , M. A., et al. 2012, , 758, 141, 10.1088/0004-637X/758/2/141

  53. [100]

    2010, Science, 329, 408, 10.1126/science.1186683

    Lyne , A., Hobbs , G., Kramer , M., Stairs , I., & Stappers , B. 2010, Science, 329, 408, 10.1126/science.1186683

  54. [101]

    G., & Ashworth , M

    Lyne , A. G., & Ashworth , M. 1983, , 204, 519, 10.1093/mnras/204.2.519

  55. [102]

    G., & Large, M

    Lyne, A. G., & Large, M. I. 1976

  56. [104]

    N., Hobbs , G

    Manchester , R. N., Hobbs , G. B., Teoh , A., & Hobbs , M. 2005, , 129, 1993, 10.1086/428488

  57. [108]

    A., Lorimer , D

    McLaughlin , M. A., Lorimer , D. R., Champion , D. J., et al. 2004, in Young Neutron Stars and Their Environments, ed. F. Camilo & B. M. Gaensler , Vol. 218, 127. astro-ph/0310454

  58. [114]

    J., Bailes , M., et al

    Ng , C., Champion , D. J., Bailes , M., et al. 2015, , 450, 2922, 10.1093/mnras/stv753

  59. [115]

    2020, , 903, 81, 10.3847/1538-4357/abb94f

    Ng , C., Wu , B., Ma , M., et al. 2020, , 903, 81, 10.3847/1538-4357/abb94f

  60. [118]

    Nowakowski , L. A. 1991, , 377, 581, 10.1086/170386

  61. [119]

    Olszanski , T. E. E., Lewis , E. F., Deneva , J. S., et al. 2025, arXiv e-prints, arXiv:2502.04571, 10.48550/arXiv.2502.04571

  62. [121]

    A., & Sieber , W

    Oster , L., Hilton , D. A., & Sieber , W. 1977, , 57, 323

  63. [122]

    Parent , E., Sewalls , H., Freire , P. C. C., et al. 2021, arXiv e-prints, arXiv:2108.02320. 2108.02320

  64. [125]

    1986, , 307, 540, 10.1086/164442

    Proszynski , M., & Wolszczan , A. 1986, , 307, 540, 10.1086/164442

  65. [127]

    J., Lee , K

    Qiao , G. J., Lee , K. J., Zhang , B., Xu , R. X., & Wang , H. G. 2004, , 616, L127, 10.1086/426862

  66. [128]

    Rahaman , S. k. M., Basu , R., Mitra , D., & Melikidze , G. I. 2021, , 500, 4139, 10.1093/mnras/staa3518

  67. [130]

    Rankin , J. M. 1986, , 301, 901, 10.1086/163955

  68. [131]

    M., & Suleymanova , S

    Rankin , J. M., & Suleymanova , S. A. 2006, , 453, 679, 10.1051/0004-6361:20054140

  69. [133]

    M., Wright , G

    Rankin , J. M., Wright , G. A. E., & Brown , A. M. 2013, , 433, 445, 10.1093/mnras/stt739

  70. [135]

    L., & Rankin , J

    Redman , S. L., & Rankin , J. M. 2009, , 395, 1529, 10.1111/j.1365-2966.2009.14632.x

  71. [136]

    L., Wright , G

    Redman , S. L., Wright , G. A. E., & Rankin , J. M. 2005, , 357, 859, 10.1111/j.1365-2966.2005.08672.x

  72. [137]

    Ritchings , R. T. 1976, , 176, 249, 10.1093/mnras/176.2.249

  73. [139]

    A., & Sutherland , P

    Ruderman , M. A., & Sutherland , P. G. 1975, , 196, 51, 10.1086/153393

  74. [140]

    G., Yuan , J

    Rusul , A., Wen , Z. G., Yuan , J. P., et al. 2025, arXiv e-prints, arXiv:2507.04816, 10.48550/arXiv.2507.04816

  75. [143]

    J., Rawley , L

    Segelstein , D. J., Rawley , L. A., Stinebring , D. R., Fruchter , A. S., & Taylor , J. H. 1986, , 322, 714, 10.1038/322714a0

  76. [145]

    2022, Research in Astronomy and Astrophysics, 22, 025018, 10.1088/1674-4527/ac424d

    Shang , L.-H., Bai , J.-T., Dang , S.-J., & Zhi , Q.-J. 2022, Research in Astronomy and Astrophysics, 22, 025018, 10.1088/1674-4527/ac424d

  77. [146]

    1975, , 38, 325

    Sieber , W., & Oster , L. 1975, , 38, 325

  78. [149]

    2023, , 520, 4562, 10.1093/mnras/stad135

    Song , X., Weltevrede , P., Szary , A., et al. 2023, , 520, 4562, 10.1093/mnras/stad135

  79. [151]

    H., & Reifenstein , Edward C., I

    Staelin , D. H., & Reifenstein , Edward C., I. 1968, Science, 162, 1481, 10.1126/science.162.3861.1481

  80. [154]

    A., Izvekova , V

    Suleymanova , S. A., Izvekova , V. A., Rankin , J. M., & Rathnasree , N. 1998, Journal of Astrophysics and Astronomy, 19, 1, 10.1007/BF02714888

Showing first 80 references.