Pith. sign in

REVIEW 1 major objections 5 minor

SN 2022erq's extreme brightness was powered by a massive hydrogen shell whose mass-loss rate rose an order of magnitude in the decades before explosion.

Reviewed by Pith at T0; open to challenge. T0 means a machine referee read the full paper against a public rubric. the ladder, T0–T4 →

T0 review · grok-4.5

2026-07-13 06:52 UTC pith:TA6TZGYU

load-bearing objection Solid new Ia-CSM dataset with a useful dual reconstruction of escalating mass loss; the absolute Ṁ numbers scale with a fixed ε≈50% energy budget, but the qualitative surge and the early spectroscopy are real advances. the 1 major comments →

arxiv 2607.06338 v3 pith:TA6TZGYU submitted 2026-07-07 astro-ph.HE

SN 2022erq: A Superluminous Thermonuclear Supernova with Escalating Preexplosion Mass Loss

classification astro-ph.HE
keywords Type Ia supernovaeSN 2022erqIa-CSMcircumstellar mediummass-loss historythermonuclear supernovaejecta-CSM interactionprogenitor systems
verification ladder T0 review T1 audit T2 compute T3 formal T4 reserved

The pith

A machine-rendered reading of the paper's core claim, the machinery that carries it, and where it could break.

SN 2022erq is a rare superluminous Type Ia supernova whose early spectra show iron-group dominance with weak intermediate-mass lines, consistent with efficient thermonuclear burning, yet whose light curve is overwhelmingly powered by interaction with a hydrogen-rich circumstellar medium. The paper reconstructs the progenitor's mass-loss history by combining narrow H-alpha luminosity with bolometric light-curve modeling of the shock interaction. The mass-loss rate climbed from roughly 0.04 to 0.6 solar masses per year over the final decades, building a roughly 3-solar-mass shell that extends to about 3.5 times 10^16 cm. Together with a young host environment of about 100 Myr, this points to a white-dwarf plus intermediate-mass companion that experienced a sharp late-stage mass-loss surge. The result matters because it shows that extreme luminosities in thermonuclear events can be set by pre-explosion mass loss rather than by the nickel yield alone, and it supplies a concrete density profile that progenitor models must match.

Core claim

By combining H-alpha diagnostics of the outer unshocked wind with bolometric modeling of the interaction-powered light curve, the authors show that the pre-explosion mass-loss rate of SN 2022erq escalated by an order of magnitude over the final decades, rising from about 0.04 to about 0.6 solar masses per year and producing a roughly 3-solar-mass hydrogen-rich CSM shell out to about 3.5 times 10^16 cm, consistent with a white-dwarf plus intermediate-mass companion progenitor.

What carries the argument

Joint inversion of narrow H-alpha luminosity (outer, unshocked CSM) and bolometric luminosity under a shock-interaction model (inner CSM density at the cold dense shell) that yields a steep density profile rho_CSM proportional to r to the -3.6 and the time-dependent mass-loss rate.

Load-bearing premise

The conversion of shock kinetic energy into radiation is fixed at about 50 percent by comparing the total radiated energy to an assumed total kinetic energy of a standard Chandrasekhar-mass explosion; that single efficiency sets the absolute scale of the derived density and mass-loss history.

What would settle it

High-resolution spectroscopy or multi-wavelength monitoring that independently measures either the kinetic-to-radiative efficiency or the total CSM mass (for example via free-free radio continuum or X-ray luminosity) and finds a value inconsistent with the 50 percent efficiency and the ~3 solar-mass shell required by the light-curve inversion.

Watch this falsifier — get emailed when new claim-graph text bears on it.

Editorial analysis

A structured set of objections, weighed in public.

Desk editor's note, referee report, simulated authors' rebuttal, and a circularity audit.

Referee Report

1 major / 5 minor

Summary. The manuscript presents a comprehensive photometric and spectroscopic analysis of SN 2022erq, establishing it as a superluminous Ia-CSM event. Early spectra show IGE-dominated, IME-weak features consistent with efficient thermonuclear burning, while persistent narrow Balmer lines and a slow light-curve decline demonstrate long-lived interaction with a massive H-rich CSM. Combining multi-component Hα diagnostics with bolometric light-curve inversion, the authors reconstruct a pre-explosion mass-loss history that escalates from ~0.04 to ~0.6 M☉ yr⁻¹ over the final decades, yielding a ~3 M☉ CSM shell extending to ~3.5×10¹⁶ cm. The young (~100 Myr), low-metallicity host environment is used to favor a white-dwarf plus intermediate-mass companion progenitor that experienced enhanced late-stage mass loss.

Significance. If the reconstructed mass-loss history holds, SN 2022erq provides one of the most detailed empirical constraints on the CSM density structure and pre-explosion evolution of an Ia-CSM progenitor. The dense early-to-late spectral sequence (from +1.8 d), multi-band photometry including NIR, and joint Hα/bolometric modeling constitute a high-value observational dataset for the rare Ia-CSM class. The qualitative conclusion of escalating mass loss and a massive extended CSM is robust and places useful pressure on steady-wind single-degenerate models, while the quantitative rates and total mass offer a concrete target for binary-evolution calculations.

major comments (1)
  1. Section 5.3, Eqs. (1)–(2): the absolute CSM density profile (and therefore the claimed surge from ~0.04 to ~0.6 M☉ yr⁻¹ and M_CSM~3 M☉) is obtained by inverting L=2πε ρ_CSM r_sh^{2} v_sh^{3} with a fixed ε≈50%. That efficiency is set by dividing the integrated radiated energy (~0.7 foe) by an assumed total shock kinetic energy of ~1.4 foe for a canonical Chandrasekhar ejecta (M_ej=1.4 M☉, v=10⁴ km s⁻¹). Given the IGE-rich, IME-weak early spectra (Figs. 6–7), the true ejecta mass/kinetic energy (or the fraction that couples to the CSM) could differ. A different ε simply rescales the entire ρ_CSM(r) profile and the absolute mass-loss rates. The power-law index s~3.6 and the qualitative escalation are less sensitive, and the outer Hα rates (~0.04 M☉ yr⁻¹) are independent of ε, but the quantitative amplitude of the inner surge is only as secure as the adopted energy budget. The paper should
minor comments (5)
  1. Section 5.2: the Ofek et al. (2013) formula used for the narrow-Hα mass-loss rate assumes a wind-density profile and recombination-dominated emission; a brief statement of the adopted β and any geometric assumptions would improve reproducibility.
  2. Figure 14: the top axis (time before explosion) assumes constant v_wind=180 km s⁻¹. The text already notes that an evolving wind speed would change the absolute timing; a short parenthetical reminder in the figure caption would help.
  3. Section 4.2 / Appendix A.2: the spectral-matching procedure is carefully described, but the ranking metric (RMS of relative residual) and the decision to allow phase offsets up to 120 d could be summarized more compactly in the main text for readers who do not consult the appendix.
  4. Table 1 and the light-curve parameter discussion: the unusually long rise times in the redder bands are attributed in part to strengthening Hα; a quantitative estimate of the Hα contribution to the r-band flux near maximum would strengthen that claim.
  5. A few minor typographical issues appear (e.g., “Tpe IIn” for “Type IIn” in Section 3.3; occasional missing spaces around units). A careful proof-read will catch them.

Circularity Check

0 steps flagged

No circularity: mass-loss history is inverted from independent L(t), v_sh(t), and Hα data via published formulae; ε is fixed by an energy budget, not tuned to recover the claimed escalation.

full rationale

The central claim (order-of-magnitude rise in Ṁ from ~0.04 to ~0.6 M⊙ yr⁻¹ and M_CSM ~3 M⊙) is obtained by applying standard interaction formulae (Ofek et al. 2013 for narrow Hα; Chevalier & Fransson / Moriya et al. 2013 for L = 2πε ρ r_sh^{2} v_sh^{3}) to observed bolometric luminosity, measured CDS velocities, and line fluxes. ε ≈ 50 % is set once by the ratio of integrated radiated energy (~0.7 foe) to an assumed Chandrasekhar kinetic energy (~1.4 foe); it is not adjusted so that the density slope or the final mass-loss rates are recovered by construction. The power-law index s ~ 3.6 is cross-checked by an independent analytic light-curve slope fit (α = −1.46 o s = 3.59). Hα-based outer rates are independent of ε. Self-citations are ordinary comparative literature and do not close any logical loop. The derivation is therefore self-contained against external benchmarks; any vulnerability lies in the physical assumptions (canonical ejecta energy, constant wind speed), not in circular reasoning.

Axiom & Free-Parameter Ledger

5 free parameters · 5 axioms · 0 invented entities

The central reconstruction rests on a handful of standard astrophysical formulae plus a few numerical choices (efficiency, wind speed, ejecta parameters) that convert observed fluxes into a density profile. No new physical entities are postulated; the progenitor interpretation is an inference from the derived CSM properties and host age.

free parameters (5)
  • kinetic-to-radiative efficiency ε = ≈0.5
    Fixed at ≈50 % by equating integrated radiated energy (~0.7 foe) to assumed total shock kinetic energy of a 1.4 M⊙, 10⁴ km s⁻¹ ejecta; used to invert L(t) into ρ_CSM(r).
  • CSM wind velocity v_wind = 180 km s⁻¹
    Measured from P-Cygni absorption minimum of Hα and He I λ10830; held constant when converting radius to pre-explosion time.
  • ejecta mass and velocity for kinetic-energy budget = 1.4 M⊙, 10⁴ km s⁻¹
    Canonical Chandrasekhar values M_ej~1.4 M⊙, v~10⁴ km s⁻¹ adopted to compute total available kinetic energy.
  • ejecta density power-law index n = ≈10
    Set to n≃10 (Matzner & McKee / Kasen) when converting observed light-curve slope α into CSM density slope s via Moriya analytic formula.
  • CDS velocity parameterization v_sh(t)=v1 t^0.15 = v1=2800 km s⁻¹
    Fit to two measured FWHM values of the broad Hα component; integrated to obtain shock radius r_sh(t).
axioms (5)
  • domain assumption Narrow Hα luminosity traces unshocked photo-ionized CSM via the Ofek et al. (2013) recombination formula L_Hα ∝ Ṁ² / (v_w r).
    Invoked in §5.2 to convert observed narrow-line flux into mass-loss rate at earlier epochs.
  • domain assumption Bolometric luminosity equals ε times the kinetic-energy dissipation rate at the forward shock (Chevalier & Fransson / Moriya).
    Eqs. (1)–(2) in §5.3; used to invert L(t) into ρ_CSM(r).
  • domain assumption Post-peak light-curve slope α relates to CSM density index s by the Moriya et al. (2013) analytic expression involving ejecta index n.
    Used as an independent check that s≈3.6, consistent with the numerical density profile.
  • domain assumption Host-galaxy extinction is negligible (A_V(host)≈0.046 mag) and total E(B-V)=0.02 mag.
    Derived from absence of Na I D and SED fitting (§2.3, §5.1); all luminosities and colors depend on it.
  • domain assumption Distance D=270±30 Mpc from z=0.0653 and H0=73.04 km s⁻¹ Mpc⁻¹.
    Sets absolute magnitudes and bolometric luminosities; uncertainty dominates M_peak error budget.

pith-pipeline@v1.1.0-grok45 · 46062 in / 3395 out tokens · 29345 ms · 2026-07-13T06:52:03.653198+00:00 · methodology

0 comments
read the original abstract

We present a photometric and spectroscopic study of the superluminous Type Ia supernova SN 2022erq. Its early spectra, dominated by iron-group elements with weak intermediate-mass features, might indicate highly efficient nuclear burning, broadly similar to that inferred for some overluminous SNe Ia. The rapid emergence and persistence of narrow Balmer emission lines superposed on this iron-rich spectrum provide clear evidence of long-lived interaction with a hydrogen-rich circumstellar medium (CSM), establishing SN 2022erq as a member of the rare Ia-CSM class. SN 2022erq reached a peak bolometric luminosity of about 8 x 10^43 erg/s and exhibited an exceptionally slow post-peak decline, indicating that its light curve is dominated by long-duration ejecta-CSM interaction. By combining H-alpha diagnostics with bolometric light-curve modeling, we reconstruct the pre-explosion mass-loss history of the progenitor. The mass-loss rate escalated by one order of magnitude over the final decades, rising from about 0.04 to about 0.6 solar masses per year. This surge produced a massive, extended CSM shell of about 3 solar masses out to about 3.5 x 10^16 cm. The young stellar environment (about 100 Myr) together with this substantial, extensive CSM points to a progenitor system consisting of a white dwarf and an intermediate-mass companion that underwent increasing mass loss prior to explosion.

Figures

Figures reproduced from arXiv: 2607.06338 by \'Ad\'am S\'odor, \'Agoston Horti-D\'avid, Alexei V. Filippenko, Andr\'as P\'al, A. Pastorello, A. Reguitti, Attila B\'odi, B\'alint Seli, Borb\'ala Cseh, Bo Wang, Chengyuan Wu, C. P. Guti\'errez, Csilla Kalup, D.-D Shi, E. Kankare, Fangzhou Guo, Gaici Li, G. Valerin, I. Salmaso, J. Craig Wheeler, Jialian Liu, Jianrong Shi, Jose L. Prieto, J\'ozsef Vink\'o, Jujia Zhang, J.-W. Zhao, K. Matilainen, Levente Kriskovics, L. Galbany, Liping Li, M. D. Stritzinger, N. Elias Rosa, P. A. Mazzali, Peter Lundqvist, Qian Zhai, R\'eka K\"onyves-T\'oth, R\'obert Szak\'ats, Shengyu Yan, S. Moran, S. Williams, Tengfei Song, Thomas G. Brink, T. Kravtsov, T. M. Reynolds, Weikang Zheng, Weili Lin, Xiangcun Meng, Xiaofeng Wang, Yi Yang, Yongyuan Xiang, Yongzhi Cai, Yunkun Han, Zeyi Zhao, Z.-H. Peng.

Figure 1
Figure 1. Figure 1: Optical and NIR light curves of SN 2022erq. Dotted and dashed vertical lines mark the explosion epoch and the time of B- band maximum, respectively. The data presented in this work are supplemented with public photometry from ZTF and ATLAS. The early-time rise in the gri- bands is fitted with a power-law (fireball) model. In this work, we present SN 2022erq, a superlumi￾nous (Mr ≈ −21 mag) thermonuclear tr… view at source ↗
Figure 1
Figure 1. Figure 1: Optical and NIR light curves of SN 2022erq. Dotted and dashed vertical lines mark the explosion epoch and the time of B- band maximum, respectively. The data presented in this work are supplemented with public photometry from ZTF and ATLAS. The early-time rise in the gri- bands is fitted with a power-law (fireball) model. LAS discovery on March 11.59 in the same band, this provides an initial constraint on… view at source ↗
Figure 2
Figure 2. Figure 2: Spectral sequence of SN 2022erq. Epochs marked on the right side of each spectrum are relative to the adopted explosion date. Dashed and dotted lines mark the rest-frame wavelengths of features originating from the SN and the host galaxy, with identifications labeled above and below the spec￾trum, respectively. All spectra have been corrected for the host redshift and smoothed with bin sizes chosen accordi… view at source ↗
Figure 2
Figure 2. Figure 2: Spectral sequence of SN 2022erq. Epochs marked on the right side of each spectrum are relative to the adopted explosion date. Dashed and dotted lines mark the rest-frame wavelengths of features originating from the SN and the host galaxy, with identifications labeled above and below the spec￾trum, respectively. All spectra have been corrected for the host redshift and smoothed with bin sizes chosen accordi… view at source ↗
Figure 3
Figure 3. Figure 3: The B-, g-, and r/R-band light curves of SN 2022erq compared with representative events: SNe Ia-CSM (SNe 2005gj, 2018evt; G. Aldering et al. 2006; J. L. Prieto et al. 2007; Y. Yang et al. 2023; L. Wang et al. 2024), SC candidates (SNe 2007if, 2009dc; R. A. Scalzo et al. 2010; S. Taubenberger et al. 2011; M. Hicken et al. 2012; J. M. Silverman et al. 2012; B. E. Stahl et al. 2019), 91T-like SNe (SNe 1991T, … view at source ↗
Figure 4
Figure 4. Figure 4: Peak r/R-band luminosity (M r/R max ) vs. duration above half-maximum luminosity (T1/2) in the rest frame. The sample includes normal, 91T-like, SC candidate, and CSM-interaction SNe Ia from J. M. Silverman et al. (2013); Y. Sharma et al. (2023). emission from the shocked CSM, e.g., Hα emission, (Y. Sharma et al. 2023) [PITH_FULL_IMAGE:figures/full_fig_p007_4.png] view at source ↗
Figure 5
Figure 5. Figure 5: The g−r color evolution of SN 2022erq compared to representative objects, including a sample of SNe Ia and Ia-CSM from Y. Sharma et al. (2023), as well as several other well-studied transients. All comparison objects have been corrected for reddening. observations precludes a precise constraint on the onset of its CSM-interaction phase. When re-observed from t ≳ +120 d onward, SN 2018evt exhibited a lumino… view at source ↗
Figure 6
Figure 6. Figure 6: Spectral comparison of SN 2022erq near max￾imum brightness with SNe Ia-CSM (SNe 2002ic, 2005gj, 2018evt), SC candidates (SNe 2007if, 2009dc), 91T-like (SNe 1991T, 2011hr), normal SN Ia SN 2011fe (J. T. Parrent et al. 2012), and SN IIn SN 2010jl (N. Smith et al. 2012). Thin dotted lines mark rest-frame wavelengths; thick lines indi￾cate features at a blueshift of 10,000 km s−1 . All spectra are dereddened. … view at source ↗
Figure 7
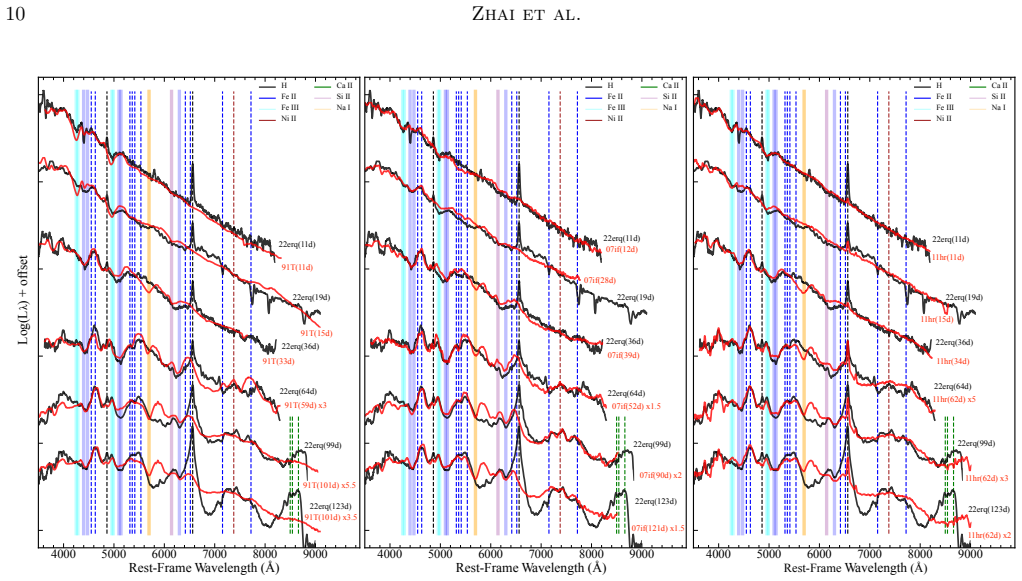
Figure 7. Figure 7: Spectral comparison of SN 2022erq with SNe 1991T, 2007if, and 2011hr. Luminosity scaling factors, where applied, are noted after the phase. Thin dotted lines indicate the rest-frame wavelengths of spectral lines, while thick lines show their positions at a blueshift of 10,000 km s−1 . 4000 5000 6000 7000 8000 9000 Rest-Frame Wavelength (Å) Log(L λ) + o ffset 22erq(31d) 22erq(36d) 22erq(64d) 22erq(71d) 22er… view at source ↗
Figure 8
Figure 8. Figure 8: SN 2022erq compared with SN Ia-CSM SNe 2002ic, 2005gj, and 2018evt, following the same matching procedure applied in [PITH_FULL_IMAGE:figures/full_fig_p010_8.png] view at source ↗
Figure 10
Figure 10. Figure 10: A comparison of the pre-explosion host-galaxy photometric SED, the SED-derived model spectrum of the stellar population, and the late-time spectrum of SN 2022erq at τ ≈ 488 d (continuum-corrected to match the host SED). Dashed lines mark rest-frame wavelengths of spectral lines. the local environment. Applying the R23 index (H. A. Kobulnicky & L. J. Kewley 2004), defined as ([O ii] λ3727 + [O iii] λλ4959,… view at source ↗
Figure 11
Figure 11. Figure 11: Multi-Gaussian fits to the Hα and Paα lines of SN 2022erq. The spectra with higher spectral resolution and S/N were selected to enable a robust decomposition of the line profiles. The instrumental FWHM is ∼ 210 km s−1 for the optical spectra and ∼ 150 km s−1 for the NIR spectrum. 2000 1000 0 1000 2000 3000 4000 5000 Velocity relative to He I 10830 (km s 1 ) N o r m a liz e d F + o ffs e t 13d 35d 88d 103d… view at source ↗
Figure 9
Figure 9. Figure 9: A phase-averaged spectrum of SN 2022erq at τ ≈ 126 d, constructed from adjacent optical and NIR obser￾vations, is compared with those of SNe 2018evt and 2010jl (T. Zhang et al. 2012; H. J. Borish et al. 2015). Dashed lines indicate the rest-frame wavelengths of the spectral lines. 4000 5000 6000 7000 8000 Rest-frame Wavelength (Å) L o g ( F ) H HH H H H [OII] [OIII] [SII] [NII] Ca II Ca II IRT Observed Spe… view at source ↗
Figure 12
Figure 12. Figure 12: Spectral features normalized and displayed in the velocity space at selected phases. The left panel shows the He I λ10, 830 and Paγ lines, while the right panel presents the Paα line. Vertical lines indicate velocities of 0 km s−1 (dashed) and −180 km s−1 (dash-dotted) relative to host galaxy. and Ca ii absorption. The prominent discrepancy lies in the strong gas emission lines (e.g., from O, S, N) presen… view at source ↗
Figure 13
Figure 13. Figure 13: shows the bolometric light curve of SN 2022erq, derived from blackbody fits to the observed SED spanning the u–K bands. Light curves in individ￾ual filters were interpolated onto a common time grid, and blackbody fits were performed only when at least four filters had detections; no extrapolation was applied to epochs with missing bands. The figure also shows quasi-bolometric luminosities from direct flux… view at source ↗
Figure 14
Figure 14. Figure 14: CSM density profile of SN 2022erq. Red stars show densities inferred from the bolometric light curve, with a power-law fit ρCSM ∝ r −s (black line). Black diamonds mark independent density estimates from the narrow Hα line flux. Coloured dash/dotted curves show steady-wind profiles ρ = M /˙ (4πr2 vwind) for different mass-loss rates, as￾suming a constant wind velocity vwind = 180 km s−1 . The top axis giv… view at source ↗
Figure 14
Figure 14. Figure 14: CSM density profile of SN 2022erq. Red stars show densities inferred from the bolometric light curve, with a power-law fit ρCSM ∝ r −s (black line). Black diamonds mark independent density estimates from the narrow Hα line flux. Coloured dash/dotted curves show steady-wind profiles ρ = M /˙ (4πr2 vwind) for different mass-loss rates, as￾suming a constant wind velocity vwind = 180 km s−1 . The top axis giv… view at source ↗

discussion (0)

Sign in with ORCID, Apple, or X to comment. Anyone can read and Pith papers without signing in.