REVIEW 5 major objections 5 minor 10 references
AI vs Human Expert Reasoning: Assessing Agreements in Building Typology Predictions based on Street View Imagery
T0 review · 5 major / 5 minor · reviewed 2026-08-02 · deepseek-v4-flash
Pith's one-line read This paper claims that off-the-shelf vision-language models can label building construction, current use, and number of storeys from street-view images with roughly 70% agreement with expert labels, without task-specific training.
desk verdict Useful applied benchmark for VLM-based building typology prediction, but the 70% agreement figure is only as solid as the uncharacterized expert labels behind it. read the letter →
The pith
A machine-rendered reading of the paper's core claim, the machinery that carries it, and where it could break.
The reading
What carries the argument
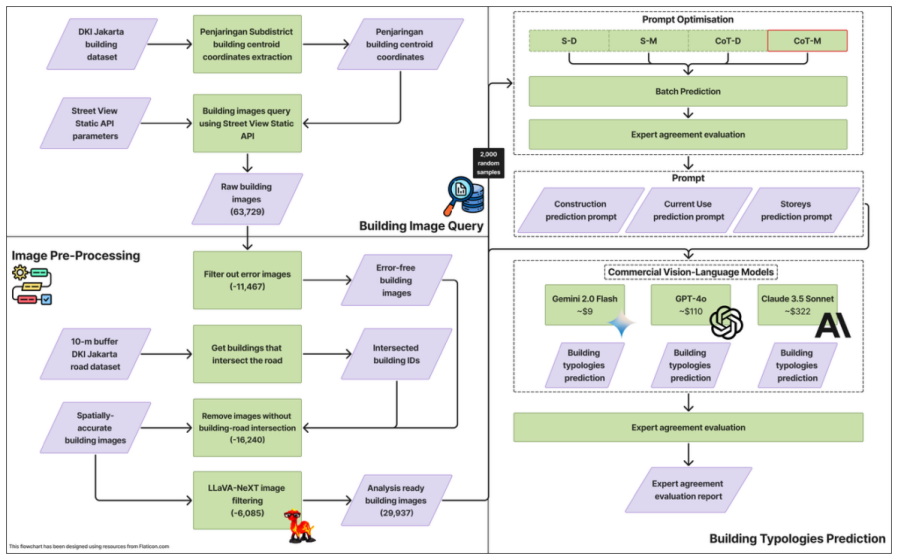
The load-bearing machinery is the evaluation protocol: zero-shot prompting (straight vs Chain-of-Thought, divided vs merged) of commercial VLMs, with expert labels as reference; the merged Chain-of-Thought prompt — asking the model to reason step by step about building features, surroundings, and validation before answering all three typologies together — proved most stable. A second piece is the word-probability analysis of the models' 200-word justifications, which extracts the dominant cues (e.g., wall, structure, entrance) and is used as the basis for comparing AI and expert reasoning. These two parts together let the authors both quantify agreement and diagnose why disagreements occur.
What would settle it
Have a second independent team of experts label the same 6,000 images and compute expert-expert agreement; if expert-expert agreement is close to the VLM-expert agreement (~70%), the claim that VLMs 'approximate expert capability' is confirmed as matching human consensus, but if expert-expert agreement is much higher (e.g., 90%), the VLM's 70% is a real gap. Alternatively, compare VLM labels to verified field-survey or building-record data for a sample of buildings; if accuracy there is far below 70%, the benchmark itself is the source of the number.
Extended reading notes
Core claim
The central claim is that off-the-shelf vision-language models approximate expert human judgement in classifying construction materials, current use, and number of storeys from street-view images, with average expert agreement of about 70% on a 6,000-image test set (Gemini 2.0 Flash 71.6%, GPT-4o 70.6%, Claude 3.5 Sonnet 69.7%). Storeys prediction is the strongest (~80% agreement) and current use the weakest (60-70%), because function is hard to infer from appearance alone. The authors also show that the models' reasoning differs systematically from experts': keyword probabilities in the models' 200-word rationales emphasize visual indicators, while experts emphasize condition, neighbourhood
Load-bearing premise
The expert labels are treated as ground truth, but the paper never shows that experts reliably agree with each other; if different expert teams label the same buildings differently, then the reported ~70% measures agreement with one subjective opinion stream rather than true classification accuracy.
Editorial extensions
If this is right
- A city-district map of construction material, current use, and storeys for ~30,000 buildings in Penjaringan can be produced automatically, with mostly concrete/brick low-rise residential buildings and more diverse materials in informal coastal settlements.
- The same zero-shot setup can be applied to other Global South cities without model retraining, lowering the cost of building-level data for planning and disaster-risk studies.
- Storeys predictions are reliable enough for first-pass use; current-use predictions should be treated as draft labels needing verification, ideally with signage or on-site data.
- The reasoning comparison suggests a practical division of labour: AI drafts labels from visual cues, human experts review ambiguous or mixed-use cases where context matters.
- Using CoT merged prompting and batch processing cuts inference cost by about 50%, making city-scale application feasible on modest budgets.
Reading between the lines
- The 70% figure is agreement with one expert annotation stream, not accuracy against an independent ground truth; measuring inter-expert agreement on the same images would show whether 70% is a human-consensus ceiling or a real shortfall.
- A concrete test: have a second team of experts label a random sample of the 6,000 images; if expert-expert agreement is also around 70%, the VLM is effectively performing at the human-consensus level for these ambiguous categories.
- The word-probability findings imply a tunable lever: instructing the model to weigh 'neighbourhood', 'condition', and 'design intent' — cues experts use — could plausibly raise current-use agreement, a hypothesis the paper does not test.
- The method could be extended to an active-learning loop: use VLM confidence or reasoning-keyword agreement to flag low-confidence images for expert review, but the paper stops at full-scale prediction and does not evaluate such a mixed workflow.
Editorial analysis
A structured set of objections, weighed in public.
Referee Report
Summary. The paper evaluates three commercial Vision-Language Models (GPT-4o, Claude 3.5 Sonnet, Gemini 2.0 Flash) for zero-shot prediction of building construction, current use, and storeys from Google Street View images in Penjaringan, Jakarta. Predictions are compared against manual labels by civil engineers and architects across a 2,000-image validation set and a 6,000-image test set, under four prompt configurations (straight/CoT, divided/merged). The central claim is that VLMs approximate expert capability at scale, with an average agreement of approximately 70% (Table 3). The paper also analyzes word probabilities in VLM reasoning and compares these with expert reflections on the same keywords, then maps predictions for about 30,000 buildings.
Significance. If the 70% figure is robust, this is a practically important result for data-scarce urban contexts: it would show that off-the-shelf VLMs can generate first-pass building-typology labels without task-specific fine-tuning. The paper has clear strengths: it compares multiple commercial VLMs, systematically varies prompting strategies, provides open code, and addresses a relevant Global South case study. However, the headline claim rests on expert labels whose reliability is not established, and the reasoning analysis is partly self-referential. With additional inter-annotator reliability evidence and an independent reasoning elicitation, the paper could become a useful benchmark for automated urban building characterization.
major comments (5)
- [§3.2 and Table 3] The 'accuracy' label is not supported by evidence of expert-label reliability. The paper defines accuracy as agreement with human expert labels, yet no inter-annotator reliability statistic (e.g., Cohen's or Fleiss' kappa) is reported, and only 20% of the initial 2,000 images were 'examined and labelled by consensus among experts.' The 6,000-image labels are not described at all: who labelled them, how many experts, and what consensus process. Since §4.1 itself states that current-use categorization is subjective and prone to 'greater variability in expert labelling,' the 70% VLM-expert agreement could be near or below the expert-expert agreement ceiling. Without expert-expert agreement, the headline figure is uninterpretable; the authors should report inter-annotator reliability for each typology and compare VLM-expert agreement against expert-expert agreement.
- [§3.2 and Fig 6] The provenance and independence of the 6,000-image expert labels are not specified. The text says 'expert agreement with model outputs was systematically assessed,' which suggests experts may have been asked to adjudicate VLM predictions rather than independently label the images. If experts were shown model outputs, the reported 71.6%, 70.6%, and 69.7% figures are human-acceptance rates, not accuracy. If labels were produced independently, the protocol (number of experts, training, consensus rule, blinding to model output) must be reported. This information is required to interpret Table 3.
- [§4.2 and Figs 7–8] The reasoning comparison is partly circular. The 10 keywords per typology are selected from the VLM's own highest-probability explanation words; the same words are then presented to experts, who are asked whether they 'reflected the primary factors considered in their own decision-making.' This elicitation restricts experts to the model's vocabulary and cannot independently establish expert reasoning. The conclusion that 'AI tends to focus on visual indicators, whereas human experts place greater emphasis on broader contextual cues' is therefore not tested. An independent expert reasoning elicitation (e.g., free-listing or think-aloud coding) is needed, with the resulting themes compared directly to the AI-derived keywords.
- [§4.1 and Table 3] Comparative and average accuracy claims lack uncertainty quantification. The text states that Gemini 2.0 Flash 'achieved the highest expert agreement' (71.6% vs 70.6% for GPT-4o) without confidence intervals or significance tests; with n=6,000 the difference may be within sampling error. Additionally, hallucination/invalid outputs are only reported for the 2,000-image Gemini straight-divided case; no invalid-output counts are given for the scaled CoT-m predictions in Table 3. If invalid outputs were discarded, the reported accuracies are conditional on the model producing a valid response. Report confidence intervals, formal model comparisons if ranking is claimed, and invalid-output counts for all models and configurations.
- [§4.2 and Fig 9] The 30,000-image map is described as providing 'reliable building-level information,' but the paper validates only a 6,000-image subset, and that validation is VLM-expert agreement, not an accuracy benchmark. The claim goes beyond the evidence. Please soften the wording or propagate prediction uncertainty to the full map; otherwise 'reliable' should be replaced by 'predicted.'
minor comments (5)
- [Abstract] Grammar: 'AI have the potential' should be 'AI has the potential.' Also, 'Storeys' is capitalized inconsistently throughout.
- [Tables 2–3] Model names are inconsistent: 'Anthropic (Claude Sonnet)', 'Google (Gemini)', and 'OpenAI (GPT)' are used in table headers, while the text refers to Claude 3.5 Sonnet, Gemini 2.0 Flash, and GPT-4o. Please harmonize.
- [References] The reference list is incomplete: several in-text citations are missing (e.g., Belaroussi 2025; DeepSeek-AI et al. 2025; Maharana et al. 2025; Wang et al. 2023; Husin 2025; Englhardt et al. 2019; Godfrey et al. 2015; Balasbaneh et al. 2020), and some listed entries are not cited in the text. Please reconcile the bibliography.
- [Fig 8 and §3.2] Fig 8 is titled 'AI vs Human Precursor (n=6,000)', but the method section describes keyword selection based on the 2,000-image validation set. Clarify whether the precursor was regenerated on the 6,000-image reasoning outputs or applied from the 2,000-image set; the current text is ambiguous.
- [Figs 5 and 9] Figure 5 heatmaps would benefit from numeric cell annotations; the colour legend is coarse and many cells are not readable in print. Figure 9's caption says 'Construction' but the text refers to three typologies; update the caption.
Circularity Check
Main 70% accuracy is externally benchmarked, but the reasoning-alignment analysis is self-referential: VLM-generated high-probability words are used as the items experts are asked to ratify.
-
self definitional
[Section 3.2 (Methods, paragraph on 10 keywords) and Section 4.2 (Experts’ Agreements in AI predictions)]
"We then selected 10 keywords based on their probability scores and frequencies in the VLMs’ reasoning outputs. These keywords represent the most prominent concepts that influenced the models’ predictions. To assess alignment with expert reasoning, we presented these keywords to domain experts and asked whether they accurately reflected the primary factors considered in their own decision-making processes. All experts have identified that the presented keywords were reasonable and can serve as a precursor to further analysis."
The 'AI reasoning' construct is defined by the VLM's own highest-probability explanation words, and 'expert alignment' is measured by asking experts to ratify those same AI-generated words. Thus the comparison is not between independent human reasoning and AI reasoning; it is between AI's self-selected vocabulary and experts' assent to that vocabulary. The later claim that 'VLM-generated reasoning aligns with expert interpretative frameworks' (Section 3.2) is therefore partly guaranteed by construction, because the instrument was generated by the system under test. This does not affect the external 70% accuracy benchmark, but it makes the reasoning-alignment results self-referential.
full rationale
The headline claim (VLMs reach ~70% agreement/accuracy against expert labels) is grounded in external human labels, so it is not circular; precision/recall/F1 are computed against expert-labelled sets (n=2,000 and n=6,000). The paper's self-citations (Law et al. 2019; Sakti et al. 2022) appear only as background and are not load-bearing. However, the reasoning-analysis component contains a self-referential step: the 10 keywords used to characterise AI reasoning are drawn from the VLM's own explanation outputs, and experts were then asked whether those same words were 'reasonable'. Using the model's own top words as the test items means the measured 'alignment' between AI and expert reasoning is at least partly an artefact of the evaluation design rather than an independent finding. This warrants a moderate circularity score, though the central accuracy result remains intact.
Assumptions & free parameters
free parameters (5)
- Keyword selection threshold (top 10) =
10
- Road buffer radius for visibility filtering =
10 m (95th percentile road width)
- Minimum valid image file size threshold =
not specified
- Model hyperparameters (temperature, max tokens) =
defaults except max tokens
- Scaling prompt selection =
CoT merged
assumptions (4)
- domain assumption Expert labels constitute reliable ground truth for building typology.
- domain assumption Google Street View imagery and the LLaVA-filtered sample are representative of the building stock.
- domain assumption The VLM's 200-word rationales reflect its actual decision process.
- domain assumption The predefined typology categories are complete and mutually exclusive.
Cite this review
Pith. "Pith review of AI vs Human Expert Reasoning: Assessing Agreements in Building Typology Predictions based on Street View Imagery." pith.science (2026). https://pith.science/paper/P7EIFDPL
@misc{pith2026260714756,
  author       = {Pith},
  title        = {Pith review of: AI vs Human Expert Reasoning: Assessing Agreements in Building Typology Predictions based on Street View Imagery},
  year         = {2026},
  howpublished = {\url{https://pith.science/paper/P7EIFDPL}},
  note         = {Machine review of arXiv:2607.14756}
}
read the original abstract
This research investigates the potential of Vision-Language Models (VLMs) to infer building typologies: Construction, Current Use, and Storeys from Google Street View (GSV) images. Predictions generated by VLMs are compared with inference by human experts (civil engineers and architects) as a source of manually labelled ground-truth data. We evaluate several state-of-the-art VLMs, including GPT-4o, Claude 3.5 Sonnet, and Gemini 2.0 Flash. By applying different scaling strategies and prompting techniques, we found that Chain-of-Thought prompts provide an overall more stable model performance. We also investigate the reasoning behind VLMs' building-typology predictions by examining the probabilities of keywords appearing in AI explanations. This enabled us to analyse patterns in these reasonings and identify key themes driving both agreements and disagreements between VLM and expert labels. We find that AI tends to focus on visual indicators, whereas human experts place greater emphasis on broader contextual cues and domain knowledge, in addition to visual cues. Overall, VLM can approximate experts' capability in building-typology classification at scale, with an average accuracy of approximately 70%. The study demonstrates the VLM's potential for AI automation in tasks that require pattern recognition and object identification in an urban context. AI have the potential to serve as complementary and collaborative tools for urban analysis, leveraging their strengths in understanding visual patterns. This study contributes to the exploration of the efficiency and scalability of AI visual prediction and provides insights into the reasoning processes that could support automation processes in urban analysis and prediction.
Figures


Figures from the paper (2 more)


Reference graph
Works this paper leans on
-
[1]
Allen, G. C. (2020). Understanding AI Technology. Joint Artificial Intelligence Center (JAIC), (April). Ananthram, A., Stengel-Eskin, E., Bansal, M., & McKeown, K. (2025). See It from My Perspective: How Language Affects Cultural Bias in Image Understanding. http://arxiv.org/abs/2406.11665 Anguelov, D., Dulong, C., Filip, D., Frueh, C., Lafon, S., Lyon, R...
arXiv 2020
-
[15]
https://doi.org/10.1016/j.jobe.2017.11.022 Lartey, D., & Law, K. M. Y . (2025). Artificial intelligence adoption in urban planning governance: A systematic review of advancements in decision-making, and policy making. Landscape and Urban Planning, 258, 105337. https://doi.org/10.1016/J.LANDURBPLAN.2025.105337 Law, S., Paige, B., & Russell, C. (2019). Take...
arXiv 2017
-
[35]
18 Xiao, J., Wu, W., Zhao, J., Fang, M., & Wang, J. (2025). Enhancing long-form question answering via reflection with question decomposition. Information Processing & Management, 62(6), 104274. https://doi.org/10.1016/J.IPM.2025.104274 Yin, L., & Wang, Z. (2016). Measuring visual enclosure for street walkability: Using machine learning algorithms and Goo...
arXiv 2025
-
[76]
https://doi.org/10.1016/j.apgeog.2016.09.024 Yin, Z., & Wang, S. (2025). Enhancing scientific table understanding with type-guided chain-of- thought. Information Processing & Management, 62(4), 104159. https://doi.org/10.1016/J.IPM.2025.104159 Zhang, Y ., & Dong, R. (2018). Impacts of street-visible greenery on housing prices: Evidence from a hedonic pric...
arXiv 2016
-
[131]
https://doi.org/10.1016/j.engappai.2023.107824 Fischer, G. (2022). A Research Framework Focused on AI and Humans instead of AI versus Humans. CEUR Workshop Proceedings,
arXiv 2023
-
[139]
Ramalingam, S. P., & Kumar, V . (2025). Building usage prediction in complex urban scenes by fusing text and facade features from street view images using deep learning. Building and Environment, 267, 112174. https://doi.org/10.1016/J.BUILDENV .2024.112174 Reinhart, C. F., & Cerezo Davila, C. (2016). Urban building energy modeling - A review of a nascent ...
arXiv 2025
-
[154]
https://doi.org/10.1016/j.enbuild.2017.08.029 Colven, E. (2020). Thinking beyond success and failure: Dutch water expertise and friction in postcolonial Jakarta. Environment and Planning C: Politics and Space, 38(6). https://doi.org/10.1177/2399654420911947 Fan, Z., Feng, C. C., & Biljecki, F. (2025). Coverage and bias of street view imagery in mapping th...
arXiv 2017
-
[177]
https://doi.org/10.1016/j.buildenv.2020.106805 Hecht, R., Meinel, G., & Buchroithner, M. (2015). Automatic identification of building types based on topographic databases–a comparison of different data sources. International Journal of Cartography, 1(1). https://doi.org/10.1080/23729333.2015.1055644 16 Hoffmann, E. J., Wang, Y ., Werner, M., Kang, J., & Z...
arXiv 2020
Show all 10 references
-
[2021]
https://doi.org/10.1109/IC-NIDC54101.2021.9660554 Turpin, M., Michael, J., Perez, E., & Bowman, S. R. (2023). Language Models Don’t Always Say What They Think: Unfaithful Explanations in Chain-of-Thought Prompting. Advances in Neural Information Processing Systems., 36, 74952–...
2021
-
[3136]
Goel, R., Garcia, L. M. T., Goodman, A., Johnson, R., Aldred, R., Murugesan, M., Brage, S., Bhalla, K., & Woodcock, J. (2018). Estimating city-level travel patterns using street imagery: A case study of using Google Street View in Britain. PLoS ONE, 13(5). https://doi.org/10.1...
2018 doi
Reviewed August 2, 2026 · model on record in the stance chip above.
Discussion (0). Continue with ORCID to comment.