REVIEW 3 major objections 5 minor 110 references
The paper establishes that galaxies in compact groups have atomic-hydrogen disks at least ~71% smaller than isolated galaxies of the same optical size, placing compact groups alongside the Virgo cluster as the most truncating environments.
Reviewed by Pith at T0; open to challenge. T0 means a machine referee read the full paper against a public rubric. the ladder, T0–T4 →
T0 review · deepseek-v4-flash
2026-08-01 20:53 UTC pith:MKURG3T5
load-bearing objection Central result likely right, but the headline deficit rests on a baseline that is 91% inferred, not measured. the 3 major comments →
The size of the HI disk across different environments: isolated, compact groups, clusters, and pairs
The pith
A machine-rendered reading of the paper's core claim, the machinery that carries it, and where it could break.
Core claim
Using the 1 M_sun pc^-2 isophote, the authors measure D_HI by ellipse fitting and establish an isolated-galaxy baseline, log D_HI = 0.704 log D_25 + 0.691 (scatter 0.153 dex). Compact-group members sit far below this baseline, with Kaplan–Meier median residual ≲ −0.535 dex — HI disks at least ~71% smaller than isolated galaxies of the same optical diameter — and ~90% below baseline once nondetections are included as upper limits. The deficit grows monotonically along the group evolutionary sequence, and the compact-group distribution is statistically indistinguishable from the Virgo cluster sample. The HI size–mass relation is shown to be tight and environment-invariant, so the truncation re
What carries the argument
The load-bearing device is the residual from the isolated-galaxy baseline, Δlog D_HI = log D_HI,obs − log D_HI,exp(D_25), with the baseline fitted by Bayesian regression to 407 isolated galaxies. Because D_HI grows as D_25^0.70, a fixed ratio D_HI/D_25 would systematically vary with galaxy size; the residual-at-fixed-D_25 removes that bias. The measurement chain also includes direct ellipse fitting to the 1 M_sun pc^-2 HI isodensity contour, beam deconvolution, and Kaplan–Meier/Gehan survival statistics to incorporate nondetected members as upper limits.
Load-bearing premise
That the HI diameter of an isolated galaxy can be reliably inferred from its HI mass through a universal size–mass relation, so that the baseline built mostly from 372 inferred diameters is unbiased; if including compact groups in the calibration or environment-dependent variations in the relation shifts those expected diameters, the 71% deficit changes.
What would settle it
Recompute the AMIGA baseline using only the 35 resolved isolated galaxies (or new resolved observations of the 372 single-dish galaxies) and re-measure the compact-group residuals. If the median residual moves above −0.535 dex or the baseline slope changes by more than the quoted uncertainty, the ≥71% deficit as stated is not robust.
If this is right
- If the claim holds, compact groups are as effective as galaxy clusters at truncating HI disks, despite lacking a hot intracluster medium.
- The monotonic phase 1→3 trend implies HI truncation is a progressive process tied to the group's evolutionary stage, not a single starburst or merger event.
- Because the HI size–mass relation is unaffected, gas removal moves galaxies along the relation, so HI-deficiency surveys can be translated into disk-size deficits at fixed optical size.
- The D_25-dependent bias in the classic D_HI/D_25 ratio means previous comparisons mixing samples of different size ranges may need re-evaluation.
- Pairs of galaxies selected to be HI-bright show no truncation relative to isolated galaxies, so interaction alone is not sufficient; the group potential matters.
Where Pith is reading between the lines
- A testable extension: apply the same baseline to resolved HI observations of the 372 single-dish isolated galaxies; if their measured diameters confirm the inferred baseline, the 71% deficit is robust.
- The Phase 3c 'recently accreted' interpretation predicts that the gas-rich member's HI disk should be kinematically undisturbed and symmetrically placed; a resolved kinematic study could discriminate between accretion and survival.
- The same residual framework could rank simulated galaxies from cosmological runs, providing a direct observational benchmark for tidal-stripping prescriptions in group-scale potentials.
- Because more than half of compact-group members are HI nondetections, the quoted deficit is a lower bound; deeper HI observations could reveal true disks even smaller than the beam-size upper limits, pushing the deficit above 71%.
Editorial analysis
A structured set of objections, weighed in public.
Referee Report
Summary. The paper measures HI disk diameters at the 1 M_sun/pc2 isophote for 35 resolved AMIGA galaxies and 51 HCG detections, adds 73 HCG nondetections as beam-size upper limits, and constructs an AMIGA D_HI-D25 baseline from 407 galaxies (35 measured plus 372 D_HI values inferred from a size-mass relation). Residuals from this baseline are used to claim that HCG galaxies have HI disks at least ~71% smaller than isolated galaxies of the same optical diameter, with truncation increasing monotonically along the HCG phase sequence, and that HCGs are statistically indistinguishable from the Virgo cluster (VIVA). The paper also compares loose groups, Hydra I subsets, and galaxy pairs, and provides a fully reproducible Snakemake/Python workflow.
Significance. The question is timely and the measurement strategy is mostly sound: the residual-based metric avoids the size-dependent D_HI/D25 bias, the Monte Carlo error treatment accounts for beam-correlated noise, and the survival analysis handles nondetections in a principled way. The reproducibility framework (installable package plus Snakemake workflow) is a clear strength and sets a good standard for the field. If the baseline-construction concern is resolved, the paper would provide a valuable quantitative environmental sequence from isolated galaxies to compact groups and clusters. The main scientific claim, however, depends on an AMIGA baseline that is largely built from inferred rather than directly measured D_HI values, so the headline deficit is not yet established at the level the text claims.
major comments (3)
- [Sect. 3.2 / 4.1, Eq. (12), Table 3] The AMIGA baseline is not an independent isolated-galaxy reference: 372 of the 407 D_HI values entering Eq. (12) are inferred from the size-mass relation fitted to a combined sample that includes the HCGs being compared (Table 3, N=727). The statement 'With 407 galaxies, the AMIGA fit is not limited by statistics' overstates the effective information; only 35 of those points are direct measurements. Table 3 itself shows the resolved AMIGA size-mass fit is offset from the literature by ~1.4sigma in slope and ~1.6sigma in intercept, an offset the text attributes to small-number statistics. This assumption should be tested directly: (i) fit the D_HI-D25 baseline using only the 35 resolved AMIGA galaxies; (ii) infer the 372 single-dish D_HI values using a size-mass relation fitted to MIGHTEE+Wang16 only (excluding AMIGA and HCGs); then recompute the HCG median residual. If the headline defic
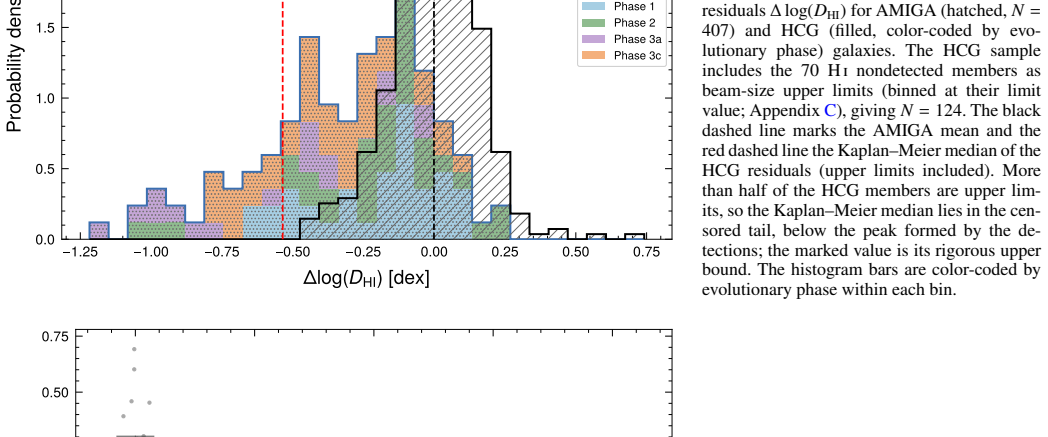
- [Sect. 4.1, Tables 5-8] The statistical tests treat the 124 HCG members as independent, but these galaxies are clustered in 30 groups and share a common environment; the reported p-values (e.g., Gehan p=1.1e-32, Mann-Whitney p=2.3e-5) therefore overstate significance. A group-level bootstrap or cluster-robust test should be used for the HCG-vs-AMIGA comparison. In addition, the claimed monotonic phase trend is not present in the detections-only statistics: Table 7 gives median residuals of -0.116 dex (Phase 1), -0.099 dex (Phase 2), and +0.011 dex (Phase 3c), so the monotonic increase appears only after assigning upper limits (Table 8). The text in Sect. 5 partially acknowledges the Phase 3c behavior, but the abstract's unqualified 'increases monotonically' overstates what the censored medians establish, especially given that the Phase 3c/3a Kaplan-Meier medians are unconstrained upper bounds.
- [Sect. 4.2, Table 9, Bok+20 rows] For the pairs sample, D_HI is inferred from ALFALFA M_HI using the same size-mass relation adopted for the AMIGA single-dish galaxies. This makes the 'least truncated' ranking of Bok+20 partly tautological relative to the AMIGA baseline. The text acknowledges that this comparison probes an HI-mass deficiency expressed in diameter units, but the abstract/conclusions place pairs at the least-truncated end without this caveat. This should be either removed from the central environmental ranking or presented only as a mass-based consistency check.
minor comments (5)
- [Fig. 6 caption] The caption text 'HCG KM median: 0.54' should read '-0.54'; the red dashed line and the stated upper bound -0.535 indicate a missing minus sign.
- [Table 4] The table formatting is garbled: the entries under alpha, beta, sigma_obs, rho_S, p_S, <Delta>low, <Delta>high are not cleanly separated, making some values unreadable. Please reformat for clarity.
- [Sect. 5 / Abstract] The Phase 3c statement that detected members are statistically indistinguishable from isolated galaxies (Mann-Whitney p=0.69) is based on only six detections; this low-N caveat should appear in the abstract or conclusions, not only in Sect. 5.
- [Sect. 2.1 / 4.1] The AMIGA sample excludes nondetections in the single-dish sample (only 'measurements' are used). If any of the 372 single-dish AMIGA galaxies are nondetections, the baseline is biased toward gas-rich systems; please clarify whether the Jones et al. (2018) values are detections only or include upper limits, and discuss the effect on the baseline.
- [General] Minor typographical issues: 'Hinondetections' and 'Hidiameter' spacing appears inconsistently; 'phase' capitalization in Table 8 captions is uneven.
Circularity Check
No significant circularity; the HCG deficit is an observed residual against a baseline that is anchored by external size–mass data and explicitly tested for HCG consistency.
full rationale
The central claim — that HCGs lie below the AMIGA D_HI–D25 baseline — is not forced by construction. HCG D_HI values are measured directly by ellipse fitting to the 1 M_sun pc^-2 iso-density contour (Sect. 3), and the residual is computed as observed minus baseline, Eq. (11). The baseline (Eq. 12) is a Bayesian fit to 407 AMIGA galaxies, of which 372 have D_HI inferred from the size–mass relation rather than from resolved maps. This is a genuine model-dependence caveat, but it is not circular: the size–mass relation is calibrated on a combined sample dominated by external MIGHTEE and Wang et al. (2016) data (639 of 727 galaxies), and the paper explicitly tests that HCGs are statistically consistent with that literature relation (Table 3: slope and intercept differences of only 0.18 sigma and 0.05 sigma). Thus the inclusion of HCGs in the calibration does not measurably determine the baseline, and the HCG residual distribution is an independent observed quantity. The monotonic increase in truncation along the HCG phase sequence follows from the published HI-based phase definitions of Jones et al. (2023), but the residual metric is not identical to those definitions; the trend is a physical correlation, not an equation-level identity. Self-citations to AMIGA and Jones et al. (2023) provide data and classification, but the load-bearing comparison is anchored by external literature samples, so no self-citation chain forces the result. No step reduces to its own input by construction.
Axiom & Free-Parameter Ledger
free parameters (7)
- size-mass slope m (combined) =
0.508 ± 0.003
- size-mass intercept b (combined) =
-3.305 ± 0.028
- size-mass intrinsic scatter sigma_int =
0.065 ± 0.002 dex
- AMIGA D_HI-D25 baseline slope alpha =
0.704 ± 0.037
- AMIGA D_HI-D25 baseline intercept beta =
0.691 ± 0.050
- AMIGA baseline observed scatter sigma_obs =
0.153 dex
- nondetection D_HI upper limit =
B_maj (beam major axis)
axioms (5)
- domain assumption The HI size-mass relation is universal across environment: galaxies stripped of outer gas move along the relation rather than off it (log D_HI = m log M_HI + b with common m,b).
- domain assumption The 1 M_sun pc^-2 isophotal HI diameter is a valid, comparable measure of HI disk extent across heterogeneous observations.
- domain assumption AMIGA galaxies (especially the 372 with single-dish M_HI) represent the isolated-galaxy baseline for D_HI at fixed D25.
- domain assumption HI nondetections can be treated as left-censored data with D_HI = B_maj as upper limit; Kaplan-Meier/Gehan methods then recover the median residual.
- domain assumption Direct least-squares ellipse fit to contour vertices returns an unbiased D_HI after quadrature beam subtraction.
read the original abstract
The 21 cm line of atomic hydrogen (HI) is a sensitive tracer of the outer disk of galaxies, where environmental signatures are most apparent. The relative extent of HI disks compared to optical disks ($D_{\rm HI}$ vs $D_{25}$) is thought to provide a quantitative measure of such imprint, yet systematic comparisons between extreme environments remain scarce. We quantify the relative extent of HI disks in Hickson Compact Groups (HCGs) and in the Analysis of the interstellar Medium in Isolated GAlaxies (AMIGA) sample, using AMIGA as a control sample that captures secular evolution with minimal external influence. We calculate HI diameters by directly fitting an ellipse to the $1\,M_{\odot}\,{\rm pc}^{-2}$ iso-density contour. Because $D_{\rm HI}$ and $D_{25}$ are nonlinearly related, we avoid the traditional $D_{\rm HI}/D_{25}$ ratio, which carries a size-dependent bias, and instead quantify truncation as the residual from the isolated-galaxy $D_{\rm HI}$-$D_{25}$ baseline, which we establish for AMIGA via Bayesian analysis. The full analysis is provided as a reproducible Python package and Snakemake workflow. HCG galaxies lie systematically below the isolated-galaxy baseline in the $D_{\rm HI}$-$D_{25}$ plane. When members with HI nondetections are included as upper limits, HCGs have HI disks at least ~71% smaller than expected for isolated galaxies of the same optical diameter. The truncation increases monotonically along the HCG evolutionary sequence, from Phase 1 to Phase 3. A comparison with literature samples places HCGs at the most-truncated end, statistically indistinguishable from the Virgo cluster sample (VIVA). Compared to AMIGA, HI disks are typically smaller relative to the optical disk in loose groups, compact groups, and cluster infall/field environments, and are most strongly truncated in HCGs and in the Virgo cluster sample.
Figures



Reference graph
Works this paper leans on
-
[1]
Journal of the American Statistical Association , volume =
Pranab Kumar Sen , title =. Journal of the American Statistical Association , volume =. 1968 , publisher =. doi:10.1080/01621459.1968.10480934 , URL =
arXiv 1968
-
[2]
emcee: The MCMC Hammer. , keywords =. doi:10.1086/670067 , archivePrefix =. 1202.3665 , primaryClass =
-
[3]
Hyper-Fit: Fitting Linear Models to Multidimensional Data with Multivariate Gaussian Uncertainties. , keywords =. doi:10.1017/pasa.2015.33 , archivePrefix =. 1508.02145 , primaryClass =
Pith/arXiv arXiv 2015
-
[4]
American Journal of Physics , keywords =
Unified equations for the slope, intercept, and standard errors of the best straight line. American Journal of Physics , keywords =. doi:10.1119/1.1632486 , adsurl =
-
[5]
Some Aspects of Measurement Error in Linear Regression of Astronomical Data. , keywords =. doi:10.1086/519947 , archivePrefix =. 0705.2774 , primaryClass =
-
[6]
Linear Regression for Astronomical Data with Measurement Errors and Intrinsic Scatter. , keywords =. doi:10.1086/177901 , archivePrefix =. astro-ph/9605002 , primaryClass =
-
[7]
and Byrd, Richard H
Boggs, Paul T. and Byrd, Richard H. and Rogers, John E. and Schnabel, Robert B. , title =. 1992 , doi =
1992
-
[8]
Soobshcheniya Spetsial'noj Astrofizicheskoj Observatorii , year = 1973, month = jan, volume =
Catalogue of isolated galaxies. Soobshcheniya Spetsial'noj Astrofizicheskoj Observatorii , year = 1973, month = jan, volume =
1973
-
[9]
Systematic properties of compact groups of galaxies. , keywords =. doi:10.1086/159838 , adsurl =
-
[10]
The morphology-density relation - The group connection. , keywords =. doi:10.1086/162078 , adsurl =
-
[11]
Evolution since z = 0.5 of the Morphology-Density Relation for Clusters of Galaxies. , keywords =. doi:10.1086/304890 , archivePrefix =. astro-ph/9707232 , primaryClass =
-
[12]
The AMIGA sample of isolated galaxies. IV. A catalogue of neighbours around isolated galaxies. , keywords =. doi:10.1051/0004-6361:20077307 , archivePrefix =. 0705.0479 , primaryClass =
-
[13]
Where is the neutral atomic gas in Hickson groups?. , keywords =. doi:10.1051/0004-6361:20011127 , archivePrefix =. astro-ph/0108223 , primaryClass =
-
[14]
The AMIGA sample of isolated galaxies. XII. Revision of the isolation degree for AMIGA galaxies using the SDSS. , keywords =. doi:10.1051/0004-6361/201321326 , archivePrefix =. 1311.0856 , primaryClass =
-
[15]
New lessons from the H I size-mass relation of galaxies. , keywords =. doi:10.1093/mnras/stw1099 , archivePrefix =. 1605.01489 , primaryClass =
-
[16]
The HI properties of spiral galaxies in the Virgo cluster. III. The HI surface density distribution in 36 galaxies. , keywords =
-
[17]
The Westerbork HI survey of spiral and irregular galaxies. I. HI imaging of late-type dwarf galaxies. , keywords =. doi:10.1051/0004-6361:20011755 , archivePrefix =. astro-ph/0204525 , primaryClass =
-
[18]
Neutral hydrogen in isolated galaxies. IV. Results for the Arecibo sample. , year = 1984, month = jun, volume =
1984
-
[19]
The H I Content of Spirals. II. Gas Deficiency in Cluster Galaxies. , year = 2001, month = feb, volume =
2001
-
[20]
A Very Large Array Survey of Neutral Hydrogen in Virgo Cluster Spirals. III. Surface Density Profiles of the Gas. , keywords =. doi:10.1086/116913 , adsurl =
-
[21]
HI imaging of galaxies in X-ray bright groups. , keywords =. doi:10.1111/j.1365-2966.2007.11748.x , archivePrefix =. astro-ph/0703643 , primaryClass =
arXiv 2007
-
[22]
HI properties
Short 21-cm WSRT observations of spiral and irregular galaxies. HI properties. , keywords =
-
[23]
The Arecibo Legacy Fast ALFA Survey: The ALFALFA Extragalactic H I Source Catalog. , keywords =. doi:10.3847/1538-4357/aac956 , archivePrefix =. 1805.11499 , primaryClass =
-
[24]
HyperLEDA. III. The catalogue of extragalactic distances. , keywords =. doi:10.1051/0004-6361/201423496 , archivePrefix =. 1408.3476 , primaryClass =
-
[25]
The Ursa Major cluster of galaxies. IV. HI synthesis observations. , keywords =. doi:10.1051/0004-6361:20010090 , archivePrefix =. astro-ph/0101404 , primaryClass =
-
[26]
The AMIGA sample of isolated galaxies. XIII. The HI content of an almost ``nurture free'' sample. , keywords =. doi:10.1051/0004-6361/201731448 , archivePrefix =. 1710.03034 , primaryClass =
-
[27]
A case study of the H I content of HCG 16
Evolution of compact groups from intermediate to final stages. A case study of the H I content of HCG 16. , keywords =. doi:10.1051/0004-6361/201936349 , archivePrefix =. 1910.03420 , primaryClass =
Pith/arXiv arXiv 1910
-
[28]
WALLABY Pilot Survey: The Diversity of Ram Pressure Stripping of the Galactic H I Gas in the Hydra Cluster. , keywords =. doi:10.3847/1538-4357/abfc52 , archivePrefix =. 2104.13052 , primaryClass =
-
[29]
Massive HI clouds with no optical counterparts as high-density regions of intragroup HI rings and arcs. , keywords =. doi:10.1111/j.1745-3933.2005.08625.x , archivePrefix =. astro-ph/0411561 , primaryClass =
arXiv 2005
-
[30]
Origin of the galaxy H I size-mass relation. , keywords =. doi:10.1093/mnras/stz2513 , archivePrefix =. 1908.11149 , primaryClass =
Pith/arXiv arXiv 1908
-
[31]
MIGHTEE-H I: the H I size-mass relation over the last billion years. , keywords =. doi:10.1093/mnras/stac693 , archivePrefix =. 2203.06149 , primaryClass =
-
[32]
The AMIGA project. I. Optical characterization of the CIG catalog. , keywords =. doi:10.1051/0004-6361:20042280 , archivePrefix =. astro-ph/0504201 , primaryClass =
-
[33]
HI deficiency in the cores and surrounding regions
MeerKAT view of Hickson Compact Groups: II. HI deficiency in the cores and surrounding regions. , keywords =. doi:10.1051/0004-6361/202452995 , archivePrefix =. 2503.05999 , primaryClass =
-
[34]
A Model for Lopsided Galactic Disks. , keywords =. doi:10.1086/311239 , archivePrefix =. astro-ph/9803146 , primaryClass =
-
[35]
Cold gas accretion in galaxies. , keywords =. doi:10.1007/s00159-008-0010-0 , archivePrefix =. 0803.0109 , primaryClass =
-
[36]
The AMIGA sample of isolated galaxies. V. Quantification of the isolation. , keywords =. doi:10.1051/0004-6361:20077481 , archivePrefixes =
-
[37]
Revised positions for CIG galaxies. , keywords =. doi:10.1051/0004-6361:20034141 , archivePrefixes =
-
[38]
The AMIGA sample of isolated galaxies - effects of environment on angular momentum. , keywords =. doi:10.1093/mnras/stae006 , archivePrefixes =
-
[39]
The AMIGA sample of isolated galaxies. XIV. Disc breaks and interactions through ultra-deep optical imaging. , keywords =. doi:10.1051/0004-6361/202346719 , archivePrefixes =
-
[40]
SOFIA: a flexible source finder for 3D spectral line data. , keywords =. doi:10.1093/mnras/stv079 , archivePrefix =. 1501.03906 , primaryClass =
-
[41]
A blind HI survey in the Canes Venatici region. , keywords =. doi:10.1111/j.1365-2966.2009.14662.x , archivePrefix =. 0904.2775 , primaryClass =
arXiv 2009
-
[42]
Galaxy Populations and Evolution in Clusters. I. Dynamics and the Origin of Low-Mass Galaxies in the Virgo Cluster. , keywords =. doi:10.1086/322373 , archivePrefix =. astro-ph/0105492 , primaryClass =
-
[43]
Structure and kinematics of the Virgo cluster of galaxies. , keywords =. doi:10.1051/0004-6361/201936172 , archivePrefix =. 2002.12820 , primaryClass =
Pith/arXiv arXiv 2002
-
[44]
The Annals of Statistics , year =
Efron, Bradley , title =. The Annals of Statistics , year =
-
[45]
Journal of the Royal Statistical Society: Series B (Methodological) , volume =
Benjamini, Yoav and Hochberg, Yosef , title =. Journal of the Royal Statistical Society: Series B (Methodological) , volume =. 1995 , month =. doi:10.1111/j.2517-6161.1995.tb02031.x , url =
arXiv 1995
-
[46]
The properties of early-type galaxies in the Ursa Major cluster. , keywords =. doi:10.1093/mnras/stu1722 , archivePrefix =. 1409.3070 , primaryClass =
-
[47]
The dynamically hot stellar halo around NGC 3311: a small cluster-dominated central galaxy. , keywords =. doi:10.1051/0004-6361/201015485 , archivePrefix =. 1009.3281 , primaryClass =
-
[48]
NGC 3314a/b and NGC 3312: Ram pressure stripping in Hydra I cluster substructure. , keywords =. doi:10.1051/0004-6361/202243412 , archivePrefix =. 2209.05605 , primaryClass =
-
[49]
, keywords =
The Hydra I cluster of galaxies. , keywords =
-
[50]
Starburst galaxies in the Hydra I cluster. , keywords =. doi:10.1051/0004-6361/202553831 , archivePrefix =. 2510.10222 , primaryClass =
-
[51]
H i-rich dwarf galaxies in the Hydra I cluster. I. Photometric and H i data. , keywords =. doi:10.1051/aas:1999469 , adsurl =
-
[52]
Galaxy content of the Hydra I and Fornax clusters of galaxies. , keywords =. doi:10.1086/158480 , adsurl =
-
[53]
Galaxy populations in the Hydra I cluster from the VEGAS survey. I. Optical properties of a large sample of dwarf galaxies. , keywords =. doi:10.1051/0004-6361/202141901 , archivePrefix =. 2112.00711 , primaryClass =
-
[54]
The DiskMass Survey. X. Radio synthesis imaging of spiral galaxies. , keywords =. doi:10.1051/0004-6361/201527067 , archivePrefix =. 1510.07666 , primaryClass =
-
[55]
Dynamics of starbursting dwarf galaxies. III. A H I study of 18 nearby objects. , keywords =. doi:10.1051/0004-6361/201322657 , archivePrefix =. 1404.6252 , primaryClass =
-
[56]
SOFIA 2 - an automated, parallel H I source finding pipeline for the WALLABY survey. , keywords =. doi:10.1093/mnras/stab1881 , archivePrefix =. 2106.15789 , primaryClass =
-
[57]
The Twin Paradoxes of Compact Groups: Discordant Excess Muted But the Dynamical Puzzle Persists. , keywords =. doi:10.1086/304164 , adsurl =
-
[58]
21-cm line studies of spiral galaxies. I. Observations of the galaxies NGC 5033, 3198, 5055, 2841, and 7331. , keywords =. doi:10.1086/113062 , adsurl =
-
[59]
The stellar mass-size relation for the most isolated galaxies in the local Universe. , keywords =. doi:10.1093/mnras/stt1020 , archivePrefix =. 1306.1687 , primaryClass =
-
[60]
The AMIGA sample of isolated galaxies. II. Morphological refinement. , keywords =. doi:10.1051/0004-6361:20054020 , archivePrefixes =
-
[61]
The AMIGA sample of isolated galaxies. IX. Molecular gas properties. , keywords =. doi:10.1051/0004-6361/201117056 , archivePrefixes =
-
[62]
The AMIGA sample of isolated galaxies. III. IRAS data and infrared diagnostics. , keywords =. doi:10.1051/0004-6361:20066144 , archivePrefixes =
-
[63]
Reviews of Modern Physics , keywords =
History of dark matter. Reviews of Modern Physics , keywords =. doi:10.1103/RevModPhys.90.045002 , archivePrefixes =
-
[64]
H I study of isolated and paired galaxies: the MIR SFR-M sequence. , keywords =. doi:10.1093/mnras/staa3034 , archivePrefixes =
-
[65]
Radial gas motions in The H I Nearby Galaxy Survey (THINGS). , keywords =. doi:10.1093/mnras/stw011 , archivePrefixes =
-
[66]
The H distribution versus to the old and young stellar discs
Extraplanar emission in isolated edge-on late-type galaxies - I. The H distribution versus to the old and young stellar discs. , keywords =. doi:10.1093/mnras/stae043 , archivePrefixes =
-
[67]
The morphology of extended discs in UV and H I
Quantified H I morphology - VI. The morphology of extended discs in UV and H I. , keywords =. doi:10.1111/j.1365-2966.2012.21975.x , archivePrefixes =
arXiv 2012
-
[68]
Dynamical Centers and Noncircular Motions in THINGS Galaxies: Implications for Dark Matter Halos. , keywords =. doi:10.1088/0004-6256/136/6/2720 , archivePrefixes =
-
[69]
Kinematic modelling of disk galaxies. I. A new method to fit tilted rings to data cubes. , keywords =. doi:10.1051/0004-6361:20066164 , archivePrefixes =
-
[70]
The AMIGA sample of isolated galaxies. VIII. The rate of asymmetric H i profiles in spiral galaxies. , keywords =. doi:10.1051/0004-6361/201016117 , archivePrefix =. 1107.0601 , primaryClass =
-
[71]
CHANG-ES XXXI A Decade of CHANG-ES: What We Have Learned from Radio Observations of Edge-on Galaxies. Galaxies , keywords =. doi:10.3390/galaxies12030022 , adsurl =
-
[72]
MeerKAT view of Hickson Compact Groups: I. Data description and release. , keywords =. doi:10.1051/0004-6361/202453005 , archivePrefix =. 2502.09691 , primaryClass =
-
[73]
VLA Imaging of Virgo Spirals in Atomic Gas (VIVA). I. The Atlas and the H I Properties. , keywords =. doi:10.1088/0004-6256/138/6/1741 , adsurl =
-
[74]
Linear Regression in Astronomy. I. , keywords =. doi:10.1086/169390 , adsurl =
-
[75]
Nonlinear Dependence of L _ B on L _ FIR and M _ H<SUB>2 </SUB> among Spiral Galaxies and the Effects of Tidal Interaction. , keywords =. doi:10.1086/304876 , archivePrefix =. astro-ph/9706302 , primaryClass =
-
[76]
Ultraviolet+Infrared Star Formation Rates: Hickson Compact Groups with Swift and Spitzer. , keywords =. doi:10.1088/0004-637X/716/1/556 , archivePrefix =. 1005.4059 , primaryClass =
-
[77]
Disturbed, diffuse, or just missing? A global study of the H I content of Hickson compact groups. , keywords =. doi:10.1051/0004-6361/202244622 , archivePrefix =. 2211.15687 , primaryClass =
-
[78]
Numerically Stable Direct Least Squares Fitting of Ellipses , author=. Proc. Sixth International Conference in Central Europe on Computer Graphics and Visualization (WSCG'98) , pages=. 1998 , url=
1998
-
[79]
, year = 1980, month = dec, volume =
An Analysis of the Isolated Galaxy Criterion. , year = 1980, month = dec, volume =
1980
-
[80]
SDSS-III: Massive Spectroscopic Surveys of the Distant Universe, the Milky Way, and Extra-Solar Planetary Systems. , keywords =. doi:10.1088/0004-6256/142/3/72 , archivePrefix =. 1101.1529 , primaryClass =
discussion (0)
Sign in with ORCID, Apple, or X to comment. Anyone can read and Pith papers without signing in.