REVIEW 3 major objections 4 minor 30 references
The observed substructure of the Milky Way—stellar streams, lensing perturbations, and satellite galaxies—requires a primordial curvature bump with peak amplitude ≳10⁻⁹ at wavenumbers 10–30 Mpc⁻¹, turning substructure data into a lower boun
Reviewed by Pith at T0; open to challenge. T0 means a machine referee read the full paper against a public rubric. the ladder, T0–T4 →
T0 review · deepseek-v4-flash
2026-08-01 09:05 UTC pith:F5MSWTGZ
load-bearing objection The lower bound is new and likely in the right ballpark, but the headline numbers are controlled by an ad-hoc collapse probability, so treat them as model-dependent until that piece is placed on firmer footing. the 3 major comments →
A lower bound on primordial power spectrum from halo substructure
The pith
A machine-rendered reading of the paper's core claim, the machinery that carries it, and where it could break.
Core claim
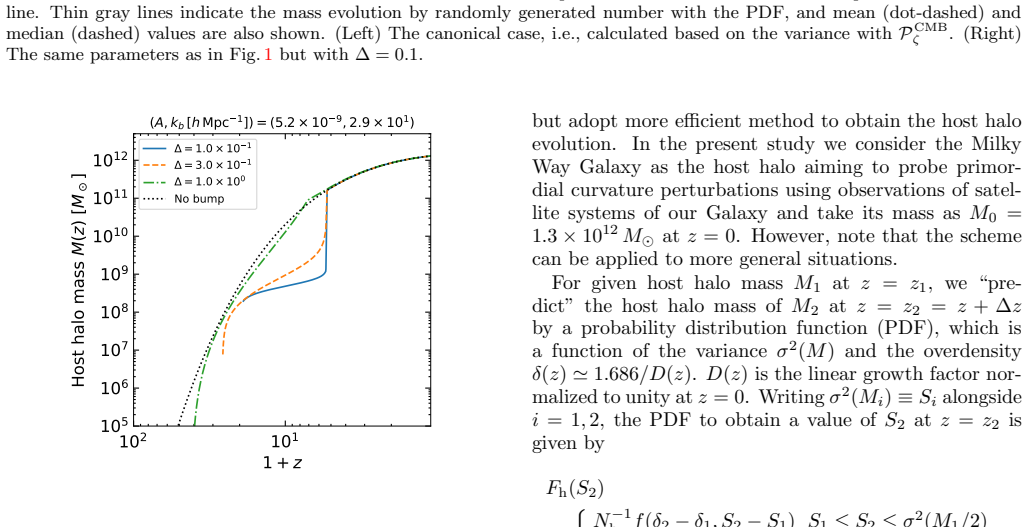
Working within a modified extended Press–Schechter framework, the paper shows that a power spectrum with a sharp cutoff at k_cut = 5 h/Mpc and a log-normal bump at higher k produces a host-halo mass evolution that is unchanged at z ≲ 4 but exhibits a plateau, a sharp jump, and then canonical growth at higher redshift, with the jump location set by the bump's wavenumber k_b and its height by the amplitude A. The resulting subhalo mass function has a peak at masses 10⁸–10¹⁰ M⊙ when k_b ≈ 20–40 h/Mpc. Comparing this peak with stellar-stream and gravitational-lensing data excludes P_ζ^peak ≲ 10⁻⁸/(Δ/0.1), while satellite counts with Vmax > 4 km/s exclude P_ζ^peak ≲ 10⁻⁹/(Δ/0.1). The authors inte
What carries the argument
The central object is the log-normal bump in the primordial curvature power spectrum (Eq. 1), whose peak amplitude P_ζ^peak = A/(√(2π)Δ) sets the height of small-scale matter fluctuations. The argument runs through the variance σ²(M) of the filtered matter power spectrum and a companion variance σ_bump²(M) built only from the bump; the latter enters an ad hoc halo-formation probability P_coll(M) that multiplies the EPS subhalo mass function. This P_coll is what converts the observed subhalo abundance into a lower bound on the bump amplitude.
Load-bearing premise
The load-bearing premise is the hand-set rule that halo formation near the bump scale is controlled only by the bump's own variance and becomes certain above the cutoff mass—if that rule misrepresents how small halos form, the lower bound moves.
What would settle it
An independent measurement of the primordial power spectrum at k ≈ 10–30 Mpc⁻¹, for example from future 21-cm or spectral-distortion observations, that yields P_ζ < 10⁻⁹ at those scales would falsify the satellite-count lower bound.
If this is right
- Any inflation or early-universe model that truncates or suppresses curvature power at k ≳ O(1) Mpc⁻¹ must still produce a bump with peak amplitude ≳10⁻⁹ at k ≈ 10–30 Mpc⁻¹ to avoid conflict with Milky Way substructure data.
- The stellar-stream and gravitational-lensing bound (P_ζ^peak ≳ 10⁻⁸/(Δ/0.1)) is concentrated at k_b ≈ 20–40 h/Mpc, while the satellite-count bound is broader, spanning k_b from ~20 to ≳100 h/Mpc and acting as a generic small-scale floor.
- Tidal stripping is essential: without it, for narrow bumps (Δ = 0.1) the predicted subhalo mass function is too sharp and much of the parameter space is excluded; with it, the distribution broadens and fits the data.
- For wider bumps (Δ ≈ 1), the constraints weaken and approach the no-bump case, meaning the lower bound is most restrictive for narrow, localized features in the primordial spectrum.
Where Pith is reading between the lines
- If the derived floor is robust, it sharpens the distinction between inflation models that naturally suppress small-scale power (e.g., through a negative running) and those that produce a bump; the former need an extra ingredient to match the substructure data.
- The satellite-count limit assumes every subhalo with Vmax > 4 km/s hosts a dwarf galaxy, a conservative assumption; if some subhalos fail to form stars, the required primordial amplitude would be higher than quoted.
- The method could be applied to other host galaxies with deep substructure surveys (e.g., M31 or lensing clusters); a null detection of subhalos at the predicted mass range would test the universality of the lower bound.
- The P_coll prescription is the main theoretical uncertainty; calibrating it against N-body simulations of bumpy power spectra would either confirm or move the quoted bounds by a factor of a few.
Editorial analysis
A structured set of objections, weighed in public.
Referee Report
Summary. The paper models the primordial curvature power spectrum as a scale-invariant spectrum cut off at k_cut = 5 h/Mpc plus a log-normal bump of amplitude A, position k_b, and width Δ. Using the EPS formalism and the public SASHIMI code, the authors compute the host halo mass evolution and subhalo mass function, introducing a new halo-formation probability P_coll (Eq. 17) to remove an unphysical A→0 contribution. Comparing with stellar stream, gravitational lensing, and satellite count observations, they derive lower bounds on the bump amplitude: P_ζ^peak ≳ 10^-8/(Δ/0.1) from streams+lensing at k_b ~ 20–40 h/Mpc, and P_ζ^peak ~ 10^-9/(Δ/0.1) from satellite counts. The central claim is that observed Milky Way substructure requires primordial curvature perturbations at the 10^-9–10^-8 level at k ~ 10–30 Mpc^-1.
Significance. The direction is novel and complementary to the usual upper bounds from spectral distortions and primordial black holes: substructure observations are used to demand a minimum level of primordial power rather than a maximum. The paper uses a public, reproducible code, introduces an efficient expectation-value method for host halo evolution, and makes a falsifiable prediction. If the bounds survive the modeling uncertainties, they would constrain inflationary and structure-formation scenarios with suppressed small-scale power. However, the numerical thresholds depend on an ad hoc suppression factor (P_coll) and on the assumed power-spectrum shape, so the quantitative conclusions are currently conditional rather than robust.
major comments (3)
- [Sec. IV, Eq. (17)] The halo-formation probability P_coll is introduced to cure the unphysical A→0 tail, but it is not derived from the excursion-set first-crossing problem for the combined CMB+bump spectrum. Because P_coll = erfc(δ(z)/(√2 σ_bump)) vanishes exponentially as A→0, it is the term that converts 'small A' into 'too few subhalos' and therefore controls the numerical thresholds in Fig. 11 and the quoted bounds. A different physically motivated suppression (e.g., including the CMB variance in the barrier, or a sharp minimum-mass cutoff) would shift the A thresholds, possibly by an order of magnitude. The paper should either justify Eq. (17) from a two-barrier excursion-set calculation or demonstrate that the bounds are stable under alternative prescriptions.
- [Sec. IV, Eqs. (5) and (17)] There is a threshold inconsistency: Eq. (5) uses δ_c = 2.7 to map mass to scale, while Eq. (17) and the host-halo evolution use δ(z) ≃ 1.686/D(z). Since P_coll is exponentially sensitive to δ/σ_bump, the difference between 2.7 and 1.686 changes the suppression. Also, P_coll uses erfc(δ/(√2 σ)) without the factor 1/2, i.e., a two-sided excursion probability, whereas the EPS first-crossing distribution is one-sided. The normalization and threshold should be made consistent and the impact on the bounds quantified.
- [Sec. V, Fig. 11] The quoted exclusions are point estimates with no theory error bars. The EPS/SASHIMI subhalo mass function depends on the assumed host-halo mass M0 = 1.3×10^12 M☉, the tidal-stripping model (only two are compared), the conversion to 300 kpc, and the assumed log-normal dispersion in host-halo masses. These systematic uncertainties are not propagated into the 95% C.L. contours. At minimum, the authors should show how the bounds shift for the range of these inputs, or state clearly that the contours are conditional on the fiducial choices.
minor comments (4)
- [Fig. 11 caption] Typo: 'lensig' should be 'lensing'.
- [Abstract and Sec. VI] The abstract says 'same or larger than 10^-9 of the primordial curvature perturbation'—this should be phrased as a lower bound on P_ζ^peak, with the Δ-dependence stated, to avoid ambiguity.
- [Sec. V, Eq. (21)] The treatment of upper-limit data points (central value set to zero, 2σ upper limit) is a conservative approximation but should be justified; a likelihood-based treatment might shift the contours slightly.
- [Sec. II and Fig. 11] The Lyman-α upper bound at k = 4.5 h/Mpc is adopted from Ref. [25]; the paper should clarify how this single point is extrapolated to the shaded region in the (P_ζ^peak, k_b) plane.
Circularity Check
No material circularity: A is constrained by external substructure observations; self-citations are methodological only.
full rationale
The central lower bound on P_zeta^peak is an inference from external observational data (DES/PanSTARRS satellite counts [1,28]; lensing [2]; stellar streams [3,4]; Lyman-alpha [25]) compared with a model subhalo mass function. The model parameter A is scanned and excluded by a chi-square statistic (Eq. 21); it is not fitted to the data and then renamed as a prediction. The host-halo evolution (Sec. III) and subhalo mass function (Sec. IV) are standard EPS calculations implemented in the public SASHIMI code, whose tidal-stripping and window-function ingredients come from external references [7,21,22]. The ad hoc collapse probability P_coll (Eq. 17) is introduced explicitly to remove the unphysical A→0 tail; this is a model assumption that makes the quantitative thresholds model-dependent, but it is not a circular reduction because the empirical content still comes from the observations. No equation is equal to its input by construction, no fitted parameter is repackaged as a prediction, and no load-bearing uniqueness theorem is imported from self-citations. The self-citations [5,6,18,19,30] are methodological references, not sources of the empirical constraint, so they do not constitute circularity. Score 1 reflects only the presence of minor self-citations in the method chain; the central derivation is self-contained with respect to external data.
Axiom & Free-Parameter Ledger
free parameters (4)
- A (bump amplitude) =
constrained; e.g., A ≳ few×10^-10 for satellite counts, A ≳ few×10^-9 for streams+lensing at Δ=0.1 (Fig. 11)
- k_b (bump location) =
constrained to ~20–40 h/Mpc (10–30 Mpc^-1)
- Δ (bump width) =
scanned over 0.1, 0.3, 1.0
- k_cut (cutoff scale) =
5 h/Mpc
axioms (7)
- domain assumption Extended Press–Schechter formalism correctly describes host halo growth and subhalo accretion
- domain assumption Sharp-k window function is appropriate for power spectra with a steep cutoff
- domain assumption SASHIMI tidal stripping model accurately captures subhalo evolution
- domain assumption All subhalos with Vmax > 4 km/s host dwarf spheroidals
- domain assumption Host halo mass distribution is log-normal with dispersion σ = 0.12 − 0.15 log(M̄_a/M_0)
- ad hoc to paper Halo formation probability P_coll = erfc(δ/(√2 σ_bump)) for M < M_cut, 1 otherwise
- domain assumption δ_c = 2.7 converts wavenumber to mass via Eq. (5)
read the original abstract
We investigate how the primordial curvature perturbation of a certain wavelength scale affects the halo and subhalo structure. Primordial power spectrum considered in this paper features a nearly scale-invariant form with a cutoff at the wavenumber $ k = \mathcal{O}(1)~$Mpc$^{-1}$ and an additional log-normal bump at smaller scales. We compute the host halo evolution, as well as the subhalo mass function. To be consistent with the observations of stellar streams and gravitational lensing data, the amplitude of the bump that is typically the same or larger than $10^{-9}$ of the primordial curvature perturbation should be present at the wavenumbers of $10$ - $30$ Mpc$^{-1}$.
Figures




Reference graph
Works this paper leans on
-
[1]
Drlica-Wagneret al., Astrophys
DES, A. Drlica-Wagneret al., Astrophys. J.893, 1 (2020), arXiv:1912.03302
Pith/arXiv arXiv 2020
-
[2]
Y. D. Hezavehet al., Astrophys. J.823, 37 (2016), arXiv:1601.01388
Pith/arXiv arXiv 2016
-
[3]
N. Banik, J. Bovy, G. Bertone, D. Erkal, and T. J. L. de Boer, Mon. Not. Roy. Astron. Soc.502, 2364 (2021), arXiv:1911.02662
Pith/arXiv arXiv 2021
-
[4]
N. Banik, J. Bovy, G. Bertone, D. Erkal, and T. J. L. de Boer, JCAP10, 043 (2021), arXiv:1911.02663
Pith/arXiv arXiv 2021
-
[5]
N. Hiroshima, S. Ando, and T. Ishiyama, Phys. Rev. D 97, 123002 (2018), arXiv:1803.07691
Pith/arXiv arXiv 2018
-
[6]
S. Ando, T. Ishiyama, and N. Hiroshima, Galaxies7, 68 (2019), arXiv:1903.11427
Pith/arXiv arXiv 2019
-
[7]
F. Jiang and F. C. van den Bosch, Mon. Not. Roy. As- tron. Soc.458, 2848 (2016), arXiv:1403.6827. 11
Pith/arXiv arXiv 2016
-
[8]
A. A. Starobinsky, JETP Lett.55, 489 (1992)
1992
-
[9]
M. Kamionkowski and A. R. Liddle, Phys. Rev. Lett.84, 4525 (2000), arXiv:astro-ph/9911103
Pith/arXiv arXiv 2000
-
[10]
J. Yokoyama, Phys. Rev. D62, 123509 (2000), arXiv:astro-ph/0009127
Pith/arXiv arXiv 2000
-
[11]
M. Kubota, K.-y. Oda, S. Rusak, and T. Takahashi, JCAP06, 016 (2022), arXiv:2202.04869
Pith/arXiv arXiv 2022
-
[12]
S. E. Hong, H.-J. Lee, Y. J. Lee, E. D. Stewart, and H. Zoe, JCAP06, 002 (2015), arXiv:1503.08938
Pith/arXiv arXiv 2015
-
[13]
J.-M. Bae, S. E. Hong, and H. Zoe, Class. Quant. Grav. 41, 015024 (2024), arXiv:2204.08657
Pith/arXiv arXiv 2024
-
[14]
K. Enqvist, T. Sawala, and T. Takahashi, JCAP10, 053 (2020), arXiv:1905.13580
Pith/arXiv arXiv 2020
-
[15]
J. Chluba, A. L. Erickcek, and I. Ben-Dayan, Astrophys. J.758, 76 (2012), arXiv:1203.2681
Pith/arXiv arXiv 2012
-
[16]
T. Bringmann, P. Scott, and Y. Akrami, Phys. Rev. D 85, 125027 (2012), arXiv:1110.2484
Pith/arXiv arXiv 2012
-
[17]
C. T. Byrnes, P. S. Cole, and S. P. Patil, JCAP06, 028 (2019), arXiv:1811.11158
Pith/arXiv arXiv 2019
-
[18]
S. Ando, N. Hiroshima, and K. Ishiwata, Phys. Rev. D 106, 103014 (2022), arXiv:2207.05747
Pith/arXiv arXiv 2022
-
[19]
N. Hiroshima, S. Ando, and T. Ishiyama, Mon. Not. Roy. Astron. Soc.517, 2728 (2022), arXiv:2206.01358
Pith/arXiv arXiv 2022
-
[20]
Planck, N. Aghanimet al., Astron. Astrophys.641, A6 (2020), arXiv:1807.06209
Pith/arXiv arXiv 2020
-
[21]
A. Schneider, R. E. Smith, and D. Reed, Mon. Not. Roy. Astron. Soc.433, 1573 (2013), arXiv:1303.0839
Pith/arXiv arXiv 2013
-
[22]
X. Yang, H. J. Mo, Y. Zhang, and F. C. v. d. Bosch, Astrophys. J.741, 13 (2011), arXiv:1104.1757
Pith/arXiv arXiv 2011
-
[23]
J. R. Bond, S. Cole, G. Efstathiou, and N. Kaiser, As- trophys. J.379, 440 (1991)
1991
-
[24]
Lacey and S
C. Lacey and S. Cole, Mon. Not. Roy. Astron. Soc.262, 627 (1993)
1993
-
[25]
S. Bird, H. V. Peiris, M. Viel, and L. Verde, Mon. Not. Roy. Astron. Soc.413, 1717 (2011), arXiv:1010.1519
Pith/arXiv arXiv 2011
-
[26]
J. D. Simon, Ann. Rev. Astron. Astrophys.57, 375 (2019), arXiv:1901.05465
Pith/arXiv arXiv 2019
-
[27]
M. L. M. Collinset al., Monthly Notices of the Royal Astronomical Society , stx067 (2017)
2017
-
[28]
A. Dekker, S. Ando, C. A. Correa, and K. C. Y. Ng, Phys. Rev. D106, 123026 (2022), arXiv:2111.13137
Pith/arXiv arXiv 2022
-
[29]
A. S. Grauset al., Monthly Notices of the Royal Astro- nomical Society488, 4585–4595 (2019)
2019
-
[30]
S. Ando, S. Balaji, M. Fairbairn, N. Hiroshima, and K. Ishiwata, Phys. Rev. D112, 103034 (2025), arXiv:2408.11098
arXiv 2025
discussion (0)
Sign in with ORCID, Apple, or X to comment. Anyone can read and Pith papers without signing in.