REVIEW 3 major objections 5 minor 22 references
CO second overtone line variability in three carbon-rich early post-AGB stage stars
T0 review · 3 major / 5 minor · reviewed 2026-08-01 · deepseek-v4-flash
Pith's one-line read The paper shows that CO second-overtone lines in three carbon-rich post-AGB stars flip between emission and absorption as the stars pulsate, and contends the lines form in the extended atmosphere rather than in a photosphere or a detached s
desk verdict Useful first high-resolution time series of CO second-overtone lines in three post-AGB stars; the extended-atmosphere formation claim holds up, but the phase-emission correlation rests on approximate periods that could use a sensitivity check. read the letter →
The pith
A machine-rendered reading of the paper's core claim, the machinery that carries it, and where it could break.
The reading
What carries the argument
The central object is the carbon monoxide second-overtone (Δv=3) band-head sequence in the H-band, observed at high spectral resolution so that individual rotational lines are resolved. These lines are tracked across pulsation phases, and their widths and velocity offsets are used to locate the formation region: circumstellar shell lines would be narrower than about 5 km/s, photospheric lines broader than about 20 km/s, while the observed 14–17 km/s widths point to the extended atmosphere. Line-profile shapes such as P Cygni and inverse P Cygni structure are then used to infer outflow and infall in the same region, and comparison with CN Red and C2 Swan lines probes how formation height chan
What would settle it
Observe CO second-overtone lines at high spectral resolution across at least two full pulsation cycles for one of these stars, deriving the period from the same contemporaneous photometry, and check whether emission still peaks near light maximum; if emission appears at random phases, the claimed phase-locking fails.
Extended reading notes
Core claim
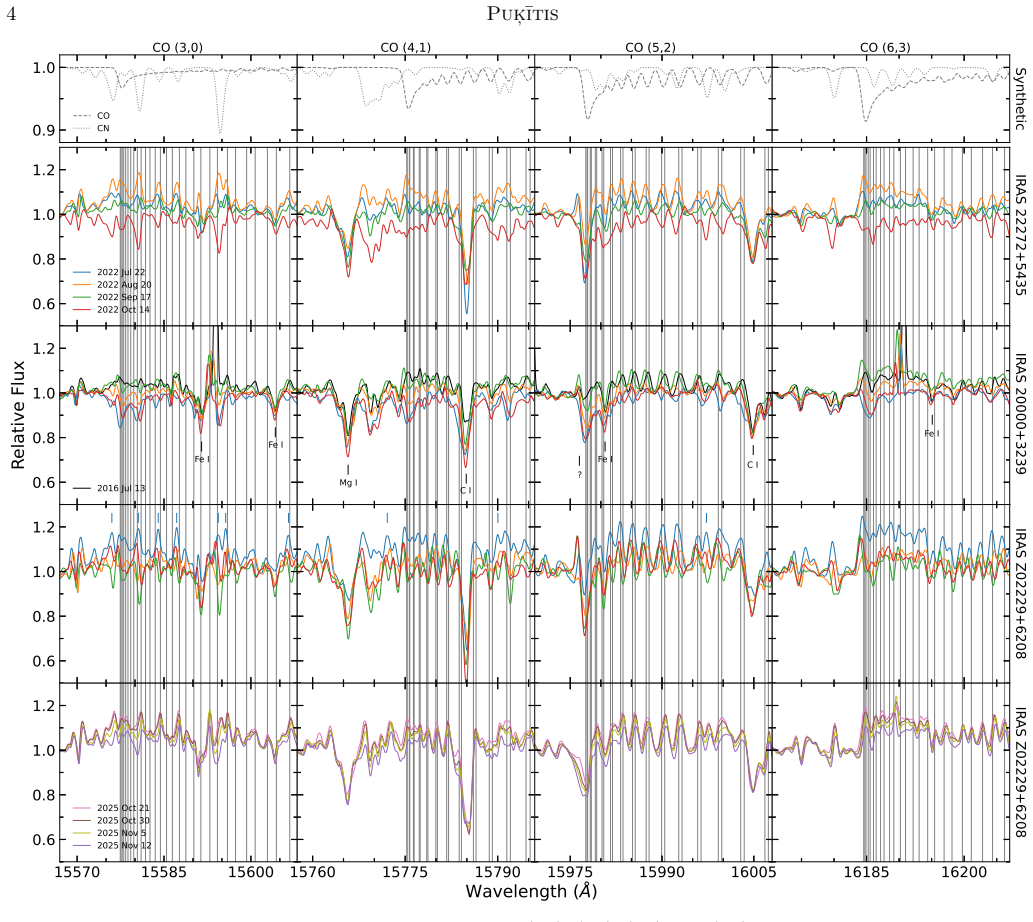
On the paper's own terms, the discovery is that the H-band CO Δv=3 lines in the three stars are not stable photospheric absorptions. In high-resolution spectra taken over several months, the (3,0) through (10,7) bandheads change from emission to absorption and back, with line widths of roughly 14–17 km/s and velocities within 10 km/s of the systemic velocity. Emission is generally strongest near light maximum and weakest or absent near light minimum. Because the widths are too broad for a narrow circumstellar shell and too narrow for photospheric lines, and because the velocities differ from the photosphere, the author concludes that the lines form in the extended atmosphere. The presence of
Load-bearing premise
The phase-correlation claim rests on assumed pulsation periods of 135, 120, and 110 days; if any of these is sufficiently wrong, the spectral changes would not actually line up with light maxima and minima.
Editorial extensions
If this is right
- CO second-overtone lines can serve as a pulsation-phase indicator for carbon-rich post-AGB stars: emission near maximum light, absorption near minimum.
- The extended atmosphere is stratified; different molecules (CO, CN, C2) probe different formation heights and therefore respond to the same pulsation with different phase offsets and profile shapes.
- P Cygni and inverse P Cygni profiles show that outflowing and infalling gas coexist in the extended atmosphere, so wind models must allow both motions.
- The same emission/absorption pattern seen in AC Herculis and R Scuti suggests a common shock-driven mechanism across pulsating post-AGB and RV Tauri stars.
Reading between the lines
- If the phase-locking survives more accurate periods, CO second-overtone emission could become a cheap phase diagnostic for post-AGB stars that are too faint for asteroseismology.
- The reported between-cycle differences hint that convection or non-radial structure modulates the shock, so phase alone will not predict line shape exactly; cycle-to-cycle monitoring would test this.
- A natural extension is to look for the predicted shock in other diagnostics, such as SiO or H2O masers, or in radio CO lines with higher angular resolution.
Signed reviews
Editorial analysis
A structured set of objections, weighed in public.
Referee Report
Summary. This paper presents CARMENES high-resolution H-band spectroscopy of three carbon-rich post-AGB stars (IRAS 22272+5435, IRAS Z02229+6208, IRAS 20000+3239) obtained at multiple epochs over 2022 (and 2025 for one star). The author reports that CO second overtone (Δv=3) band heads and individual lines vary in intensity, shape, and radial velocity, sometimes switching between emission and absorption, with line positions within about 10 km/s of the systemic velocity. Using ASAS-SN light curves, phases are assigned from approximate periods (135, 120, 110 d) and the paper claims that CO emission tends to be strongest near light maximum and weakest near light minimum, similar to previously reported C2 and CN variability. A width argument (FWHM 14–17 km/s, intermediate between circumstellar ~5 km/s and photospheric >20 km/s) and a comparison with synthetic spectra are used to argue that the lines form in the extended atmosphere above the photosphere. The discussion relates the variability to pulsation-driven shocks and notes complexity beyond earlier simple infall/outflow scenarios.
Significance. If the claims hold, this is the first high-resolution study of CO second overtone (Δv=3) variability in post-AGB stars, a spectral region that has received little attention. The observations directly address the long-standing question of where near-infrared CO lines form in these objects. The paper's strengths include the use of a single high-resolution instrument for multi-epoch observations, careful line identification with explicit treatment of blends (using Kurucz/VALD line lists and synthetic CO/CN spectra), and the presentation of individual line profiles in radial velocity space. The reported variability—intensity, shape, and velocity changes, including emission/absorption reversals—is a useful empirical result that will motivate further modeling. The width-based discrimination between photospheric, circumstellar, and extended-atmosphere origin is a simple but effective diagnostic, provided the caveats about smoothing and blending are addressed. However, the phase-dependence claim rests on approximate periods with no quoted uncertainties, and the continuum normalization is acknowledged as challenging, so the quantitative phase-emission correlation should be treated with caut
major comments (3)
- [§2, Table 1] The phase assignment is the weakest point in the paper. The periods are 'roughly assumed' (135, 120, and 110 d), and for IRAS Z02229+6208 and IRAS 20000+3239 they disagree with periods in Hrivnak et al. (2022). No uncertainties are given for the adopted periods or the light-minimum epochs, and the phase errors are never propagated. For a semiregular variable, a period change of 10–15% between cycles would accumulate a phase error of 0.2–0.4 cycles over the 3-year gap between the 2022 and 2025 spectra of IRAS Z02229+6208. With only 3–4 epochs per star, the claimed correlation between CO emission strength and pulsation phase (Abstract, §4) is not firmly established. The author should either perform a quantitative period analysis with uncertainties, or explicitly soften the phase-dependence conclusion to 'tentative' and present the phase assignments as working estimates.
- [§2, continuum normalization] The paper states that continuum placement is challenging and that the temporal variability of features is used to choose continuum points. Yet the absolute emission/absorption strengths are later compared across phases and stars to infer the phase-emission trend. If the normalization systematics are phase-dependent (for instance, if molecular bands or weak features affect the chosen continuum windows differently in different epochs), the apparent 'strongest near light maximum' could be an artifact. The author should provide error estimates for the line strengths or show that the qualitative phase trend is robust to different reasonable continuum choices (e.g., alternative spline placements or fixed continuum windows).
- [§4, width argument] The key evidence for formation in the extended atmosphere is the observed FWHM range of 14–17 km/s for CO lines, compared to circumstellar (~5 km/s) and photospheric (≥20 km/s) widths. This is a useful argument, but it is presented without accounting for the Gaussian smoothing applied to all spectra (FWHM corresponding to R=50000, i.e., about 6 km/s at the relevant wavelengths). The intrinsic line widths could be several km/s narrower, which would move them closer to the circumstellar value. In addition, the synthetic spectrum comparison is performed for only one phase and one star (light minimum of IRAS 22272+5435), so it is a limited consistency check. The paper should add a short discussion of how smoothing and unresolved blending affect the measured FWHMs and should present the synthetic comparison as supportive rather than conclusive. This does not invalidate the extended-atmosphere
minor comments (5)
- [§2, text after Table 1] Typo: 'IRAS 222272+5435' should be 'IRAS 22272+5435'. Also in the Observations section, 'IRAS Z02229+6209' appears once instead of '6208'.
- [Figure 4] The axis label shows 'uni0394Vr' apparently a Unicode escape for 'ΔVr' that did not render correctly. The figure is otherwise informative.
- [§3.2] In the CN line discussion, 'FWHH' is used instead of 'FWHM'. Please correct for consistency.
- [§4] The phrase 'trough the extend atmosphere' contains typos; should be 'through the extended atmosphere'.
- [Figure 1] The light-curve panels cover different time ranges and filters (V vs g), which makes visual comparison difficult. It would be helpful to state in the caption which photometric band is used for each panel (the text does this for IRAS 22272+5435 but not explicitly for the others).
Circularity Check
No significant circularity; the CO variability claim rests on independent spectroscopy and photometry.
full rationale
This is an observational paper with no derivation chain that reduces to its own inputs. The central new result—variability of CO second-overtone (Δv=3) lines in three post-AGB stars—is read directly from CARMENES spectra. Pulsation phases are assigned from independent ASAS-SN photometry using adopted periods (135 d, 120 d, 110 d), and the CO line measurements are made separately from those light curves. The phase assignment is an external input, not a quantity derived from or fitted to the CO data, so the correlation between emission strength and light phase is an empirical finding rather than a tautology. The paper explicitly acknowledges that the adopted periods disagree with earlier literature periods for two stars and attributes this to semiregular pulsation; this is an accuracy limitation, not circularity. The cited prior work by the same group (Začs & Puķītis 2023, 2025; Puķītis et al. 2023) is used for line lists, radial-velocity reference comparisons, and molecular-line context, but none of these citations supplies the CO variability claim itself or forbids alternative interpretations. No fitted parameter is renamed as a prediction, no quantity is self-defined through the claimed result, and no uniqueness theorem is imported from the authors' earlier work. The paper's own caveat that the variation 'does not strictly repeat' further undercuts any impression that the result is forced. Accordingly, the appropriate finding is no significant circularity, score 0.
Assumptions & free parameters
free parameters (4)
- Pulsation period of IRAS 22272+5435 =
135 days (assumed)
- Pulsation period of IRAS Z02229+6208 =
120 days (assumed)
- Pulsation period of IRAS 20000+3239 =
110 days (assumed)
- Gaussian smoothing FWHM =
R=50000
assumptions (4)
- domain assumption Wavelength calibration and telluric standard-star subtraction are accurate enough that the emission/absorption features are real.
- domain assumption ASAS-SN photometry and the adopted pulsation periods are adequate for coarse phase classification.
- domain assumption Line lists (Li et al. 2015; VALD; Kurucz) and synthetic spectra are sufficiently complete to identify CO, CN, and C2 features and assess blending.
- domain assumption Systemic velocities adopted from radio CO measurements and prior RV monitoring are correct for all three stars.
Cite this review
Pith. "Pith review of CO second overtone line variability in three carbon-rich early post-AGB stage stars." pith.science (2026). https://pith.science/paper/W66NCEML
@misc{pith2026260721473,
  author       = {Pith},
  title        = {Pith review of: CO second overtone line variability in three carbon-rich early post-AGB stage stars},
  year         = {2026},
  howpublished = {\url{https://pith.science/paper/W66NCEML}},
  note         = {Machine review of arXiv:2607.21473}
}
abstract
Near-infrared CO molecular lines are suggested to be linked with dynamic processes in post-AGB stars; however, they have not been investigated at high spectral resolution. CO second overtone line variability in the H-band is presented for the cool carbon-rich post-AGB stars IRAS 22272+5435, IRAS Z02229+6208, and IRAS 20000+3239. CO features are observed to change intensity, shape, and radial velocity as well as switch between emission and absorption during the pulsation cycle. At all times, the CO line positions are located no more than around 10 km/s away from the systemic velocity. Molecular line variation is qualitatively similar in all three stars, and it appears that the site of formation is the extended atmosphere. Emission in CO lines tends to be strongest during pulsation phases close to light maximum, and weakest emission or absorption tends to be seen when close to light minimum, resembling the behaviour in CN Red and C$_2$ Swan system lines at shorter wavelengths. The connection of molecular line variability with pulsation of the star could be related to a shock that traverses the atmosphere once per pulsation cycle.
Figures


Figures from the paper (3 more)


Reference graph
Works this paper leans on
-
[1]
A., Seifert, W., Quirrenbach, A., et al
Caballero, J. A., Seifert, W., Quirrenbach, A., et al. 2025, arXiv e-prints, arXiv:2503.05501, doi: 10.48550/arXiv.2503.05501 10 Puķītis
-
[2]
A., Guàrdia, J., López del Fresno, M., et al
Caballero, J. A., Guàrdia, J., López del Fresno, M., et al. 2016, in Society of Photo-Optical Instrumentation Engineers (SPIE) Conference Series, Vol. 9910, Observatory Operations: Strategies, Processes, and Systems VI, ed. A. B. Peck, R. L. Seaman, & C. R. Benn, 99100E, doi: 10.1117/12.2233574 De Smedt, K., Van Winckel, H., Kamath, D., et al. 2016, A&A, ...
-
[3]
Galazutdinov, G. A. 2022, Astrophysical Bulletin, 77, 519, doi: 10.1134/S1990341322040034
-
[4]
2015, MNRAS, 453, 133, doi: 10.1093/mnras/stv1627
Gezer, I., Van Winckel, H., Bozkurt, Z., et al. 2015, MNRAS, 453, 133, doi: 10.1093/mnras/stv1627
-
[5]
Gledhill, T. M., Forde, K. P., Lowe, K. T. E., & Smith, M. D. 2011, MNRAS, 411, 1453, doi: 10.1111/j.1365-2966.2010.17779.x
arXiv 2011
-
[6]
Gorlova, N., Lobel, A., Burgasser, A. J., et al. 2006, ApJ, 651, 1130, doi: 10.1086/507590
-
[7]
Gray, R. O., & Corbally, C. J. 1994, AJ, 107, 742, doi: 10.1086/116893
doi:10.1086/116893 1994
-
[8]
Hrivnak, B. J., & Bieging, J. H. 2005, ApJ, 624, 331, doi: 10.1086/428894
Show all 22 references
- [9]
-
[10]
J., Kwok, S., & Geballe, T
Hrivnak, B. J., Kwok, S., & Geballe, T. R. 1994, ApJ, 420, 783, doi: 10.1086/173602
1994 doi
-
[11]
J., Lu, W., Bakke, W
Hrivnak, B. J., Lu, W., Bakke, W. C., & Grimm, P. J. 2022, ApJ, 939, 32, doi: 10.3847/1538-4357/ac938a
2022 doi
-
[12]
J., Lu, W., Sperauskas, J., et al
Hrivnak, B. J., Lu, W., Sperauskas, J., et al. 2013, ApJ, 766, 116, doi: 10.1088/0004-637X/766/2/116
2013 doi
-
[13]
G., & Kipper, T
Klochkova, V. G., & Kipper, T. 2006, Baltic Astronomy, 15, 395
2006
-
[14]
S., Shappee, B
Kochanek, C. S., Shappee, B. J., Stanek, K. Z., et al. 2017, PASP, 129, 104502, doi: 10.1088/1538-3873/aa80d9
2017 doi
-
[15]
A., Stempels, H
Kupka, F., Piskunov, N., Ryabchikova, T. A., Stempels, H. C., & Weiss, W. W. 1999, A&AS, 138, 119, doi: 10.1051/aas:1999267
1999 doi
-
[16]
E., Rothman, L
Li, G., Gordon, I. E., Rothman, L. S., et al. 2015, ApJS, 216, 15, doi: 10.1088/0067-0049/216/1/15 Miller Bertolami, M. M. 2016, A&A, 588, A25, doi: 10.1051/0004-6361/201526577
2015 doi
-
[17]
D., Hinkle, K
Mozurkewich, D., Gehrz, R. D., Hinkle, K. H., & Lambert, D. L. 1987, ApJ, 314, 242, doi: 10.1086/165053
1987 doi
-
[18]
D., Waters, L
Oudmaijer, R. D., Waters, L. B. F. M., van der Veen, W. E. C. J., & Geballe, T. R. 1995, A&A, 299, 69
1995
-
[19]
E., Kupka, F., Ryabchikova, T
Piskunov, N. E., Kupka, F., Ryabchikova, T. A., Weiss, W. W., & Jeffery, C. S. 1995, A&AS, 112, 525 Puķītis, K., Začs, L., & Sperauskas, J. 2023, ApJ, 948, 70, doi: 10.3847/1538-4357/acc52b
1995 doi
-
[20]
J., Caballero, J
Quirrenbach, A., Amado, P. J., Caballero, J. A., et al. 2014, in Society of Photo-Optical Instrumentation Engineers (SPIE) Conference Series, Vol. 9147, Ground-based and Airborne Instrumentation for Astronomy V, ed. S. K. Ramsay, I. S. McLean, & H. Takami, 91471F, doi: 10.1117...
2014 doi
-
[21]
E., Bakker, E
Reddy, B. E., Bakker, E. J., & Hrivnak, B. J. 1999, ApJ, 524, 831, doi: 10.1086/307858 Sánchez Contreras, C., & Sahai, R. 2012, ApJS, 203, 16, doi: 10.1088/0067-0049/203/1/16
1999 doi
-
[22]
J., Prieto, J
Shappee, B. J., Prieto, J. L., Grupe, D., et al. 2014, ApJ, 788, 48, doi: 10.1088/0004-637X/788/1/48 Venkata Raman, V., & Anandarao, B. G. 2008, MNRAS, 385, 1076, doi: 10.1111/j.1365-2966.2008.12915.x Začs, L., Musaev, F., Kaminsky, B., et al. 2016, ApJ, 816, 3, doi: 10.3847/0...
2014
Reviewed August 1, 2026 · model on record in the stance chip above.
Discussion (0). Continue with ORCID to comment.