REVIEW 3 major objections 5 minor 46 references
Visibility graph-based characterization of extreme values in time series
T0 review · 3 major / 5 minor · reviewed 2026-08-01 · deepseek-v4-flash
Pith's one-line read Ranking a time series by the degree of its visibility-graph nodes identifies extreme values—global and local—without thresholds or detrending.
desk verdict Stationary-case degree ranking is a useful, cheap extreme-value detector; the nonstationary half is asserted, not shown, and the paper's own appendix concedes the degree–value link dies for random walks. read the letter →
The pith
A machine-rendered reading of the paper's core claim, the machinery that carries it, and where it could break.
The reading
What carries the argument
The central object is the visibility graph (VG): a network whose nodes are time-series points and whose edges connect two points if every intermediate point lies below the straight line between them (Eq. 1). The load-bearing identity is the ensemble-averaged relation k(x)=2−2ln[1−F(x)], proven for horizontal visibility graphs and empirically approximated for VGs across stationary processes. This monotone, logarithmically amplifying relation lets the paper replace amplitude ranking with degree ranking; the same degree concept is carried to nonstationary signals, where the formula no longer holds but degree is argued to remain stable and informative. A peak-subsampling step (keeping only local
What would settle it
Take a long random-walk time series, independently define 'locally extreme' events as record-high excursions above a local window (or via a separate event catalog for temperature data), and check whether the top-ranked visibility-graph degree nodes coincide with those events significantly better than random. If they do not, the nonstationary half of the claim collapses.
Extended reading notes
Core claim
The central claim is that jointly ranking data points by their amplitude and by the degree of their associated visibility-graph node separates extremes from the bulk: extreme values systematically occupy the top positions in both rankings. The mechanism is a known relation (exact for horizontal visibility graphs, approximate for visibility graphs) between a node's degree k and the data value x: k(x) = 2 − 2 ln[1 − F(x)], with F the cumulative distribution. Monotonicity makes degree rank a proxy for value rank, while the logarithmic divergence at the upper tail amplifies large values, so the correspondence is strongest exactly at the extremes. For nonstationary processes the formula is void,
Load-bearing premise
The load-bearing premise is that, for nonstationary processes, a node's degree remains a meaningful marker of local importance even though the theoretical degree–value link is broken; the paper asserts this without testing it against any independent ground-truth event list.
Editorial extensions
If this is right
- For stationary time series, high-degree nodes provide a parameter-free identification of both global and local extreme values, complementing or replacing threshold-based detection.
- The logarithmic amplification in the degree–value relation means the degree ranking is more reliable for true extremes than for mid-range values, suppressing noise.
- Subsampling to peaks yields a nearly identical ranking while reducing computational cost, allowing the method to scale to long series.
- For nonstationary series—where mean or variance drift makes threshold outlier definitions ill-posed—degree ranking still yields a ranked list of locally important events without detrending or window choices.
- The method is demonstrated on real climate data (Niño3.4, global temperature anomaly), indicating it can be directly applied to observational records.
Reading between the lines
- If the degree-ranking claim generalizes, a natural extension is to turn the top-degree nodes into a candidate list that a downstream extreme-event catalog (e.g., heatwave definitions) can validate, giving precision-recall numbers.
- The degree–value monotonicity is exact only for uncorrelated series; for multi-scale or long-memory processes, the rank correspondence may degrade, so a useful benchmark is measuring how often the top-degree node is also the top-value node across correlation lengths.
- Peak subsampling removes the redundancy of multiple points belonging to one extreme event, which suggests a fast pre-filtering step: compute degrees only at local maxima and use that ranking as an inexpensive extreme-event screener for very long series.
- The random-walk case (Appendix Fig. 9E) shows no direct k–x relation, so a decisive test is to compare degree-hub detections against independent local-extreme definitions on surrogate nonstationary data; if hubs are generic structural artifacts of the graph, the claim would lose its evidential basis.
Editorial analysis
A structured set of objections, weighed in public.
Referee Report
Summary. The paper proposes using node degree in the visibility graph (VG) as a parameter-free detector of extreme values in time series. For stationary series, the method builds on an established monotonic, nonlinear relation between data value and ensemble-averaged degree (Eq. 2), arguing that this relation, together with its logarithmic amplification, justifies ranking data points by degree. For nonstationary series, the paper asserts that degree ranking remains a 'robust indicator of relative importance' even though amplitude-based extremes are ill-defined. The method is illustrated on a simulated laser rogue-wave series, the Niño3.4 SST index, a global temperature anomaly index, and an unbiased random walk. The authors also propose subsampling the series to local maxima to reduce computational cost while preserving detection.
Significance. The stationary half of the paper is grounded in a concrete external result (Eq. 2 is an exact prior result for HVGs of uncorrelated processes) and the nonlinear-amplification mechanism is a plausible and potentially useful idea. If the stationary claims were quantitatively validated, the method would be a simple, parameter-free complement to threshold-based EV detection. The nonstationary extension, which is central to the abstract and conclusions, is currently an unsupported assertion: for random walks the paper concedes that no relation between k and x exists, and the claimed robustness of degree ranking for nonstationary data is not tested against any ground truth. The paper would be significantly improved by either restricting its claims to stationary processes or by validating the nonstationary claim with a synthetic model with known local extremes and a baseline comparison.
major comments (3)
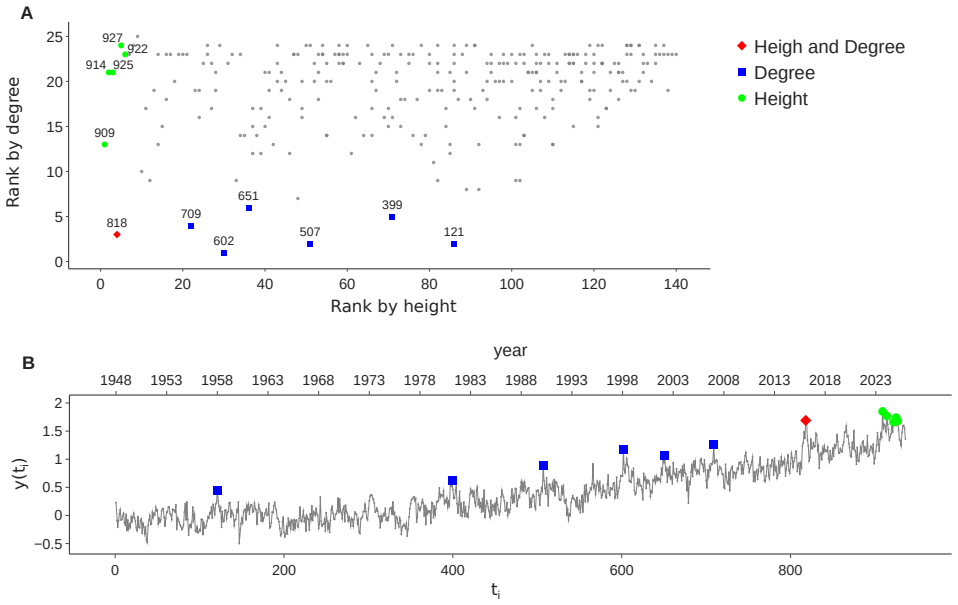
- [§3 and Appendix, Fig. 9] The central stationary inference leaps from an ensemble-averaged relation to a per-node statement. Eq. (2) is an average over realizations for HVG and is admitted to be 'only an approximation' for VG (Fig. 9B). The Appendix states that the logarithmic divergence 'suggests' that rank(k)=rank(x) holds for finite-sample extremes, but no proof or numerical test of this is provided. The abstract's claim that extreme values 'systematically occupy the top positions' requires a quantitative statement, such as the expected overlap between the top-m by height and top-m by degree under a given process, against a null model. The visual selection of the first six positions in Figs. 4–6 is illustrative, not a validation.
- [§4.2 and Appendix Fig. 9E] The nonstationary half of the central claim is unsupported. The paper states that Eq. (2) 'completely breaks down for nonstationary processes' and the Appendix explicitly concedes for an unbiased random walk 'there is no relation really between k and x' (Fig. 9E). The subsequent argument that VG-stationarity of P(k) (Refs. [11,15]) makes hubs a meaningful extreme-event indicator does not follow: stationarity of the degree distribution says nothing about whether high-degree nodes are locally prominent in the signal. For the random walk there is no independent notion of an extreme to check against, and for the GMT record (Fig. 7) the top-degree nodes are labeled as 'locally important events' with no external event list or baseline detector. The claim that degree ranking provides 'a robust indicator of relative importance' for nonstationary data is therefore an assertion. The manuscript sho
- [§4.1, Table 1 and §5] The 'joint ranking' methodology is not quantified. In Table 1, the top-6 by height and the top-6 (or top-7, due to a tie) by degree only partially overlap; for example, the sixth-ranked height point (index 297) is absent from the top degree ranks, while indices 553 and 930 appear in the top-degree list despite being ranked 27th and 10th by height. The paper neither reports a rank-correlation measure nor evaluates whether the degree-selected points are actually 'locally extreme' according to an independent criterion. Because the method's purpose is to identify EVs that height-based ranking misses, a quantitative evaluation (e.g., precision/recall against a synthetic ground truth or a threshold-based reference) is essential to support the claim that 'extreme values systematically occupy the top positions in these rankings.'
minor comments (5)
- [Fig. 3] The green threshold line in Fig. 3(a) is not defined; if it is a free parameter, this should be stated and its choice justified since the paper emphasizes parameter-free detection.
- [§4.1] The authors note that the number of positions kept in the rankings is a free parameter, but no guidance is given for choosing it. This is relevant because the method's output depends on this choice.
- [§3] Eq. (2) is derived for HVGs, yet the paper exclusively uses VGs and notes the relation is only approximate there. This should be stated prominently in the main text, not only in the Appendix.
- [Appendix Fig. 9E] The caption says for a random walk 'there is no relation really between k and x,' while the text immediately concludes that 'k or rank(k) could be used here' for extreme-event detection. This apparent contradiction needs to be resolved explicitly: either the meaning of 'extreme' is being redefined as a hub, or the relation is not as absent as suggested.
- [§4.2] The phrase 'extreme events ... definition ... in terms of degree rankings is still perfectly possible' redefines extremes as graph hubs. This conceptual shift should be stated explicitly and discussed, since it is not the standard notion of an extreme value.
Circularity Check
Nonstationary extreme-value claim is partly circular: the random-walk demonstration concedes k and x are unrelated, then labels top-degree hubs as 'EVs'; the stationary half rests on the independent Eq. (2).
-
self definitional
[Appendix, Fig. 9(E) and §4.2]
"in the case of a random walk, shown in Fig. 9(E), we can see that there is no relation really between k and x. This suggests that k or rank(k) could be used here for extreme event detection (the hubs) in a situation where extreme events cannot be detected by x."
For the nonstationary demonstration the paper admits k and x are unrelated and that no value-based definition of an extreme exists. The 'validated' events in Figs. 7–8 are simply the top-degree nodes, with no independent event list, null model, or baseline. Calling these hubs 'locally important events' or 'EVs' is therefore not a test of the detector against an external notion of extremeness; it defines extremeness as the detector output. The nonstationary claim that degree ranking provides a robust indicator of relative importance reduces to 'the ranking selects what it selects.'
full rationale
The stationary half of the paper is substantially independent. Eq. (2) is an externally published, parameter-free relation (Luque–Lacasa 2009), and the paper uses it to predict overlap between height and degree rankings; its extension to VGs is presented as a numerical approximation (Fig. 9A–D), not as a fitted parameter renamed as a prediction. The peak-subsampling discussion is a complexity-reduction observation, not circular. The self-citations to [11,15] are real support for VG-stationarity of the degree marginal, but they only establish that P(k) is time-invariant; they do not establish that hubs correspond to independent local or global extreme values. The circular content is concentrated in the nonstationary application: once k and x are admitted to be unrelated (Fig. 9E), the only sense in which degree-ranked nodes are 'extreme values' is that the method defines them as such. Because the stationary half retains independent content and the Eq. (2) anchor is external, this is a partial circularity centered on the nonstationary claim, not a fully forced derivation.
Assumptions & free parameters
free parameters (3)
- M — number of top positions kept in both rankings =
6 (all four case studies)
- Comparison threshold in Fig. 3(a) (green line) =
not stated
- Number of bins for k–x binning averages =
100
assumptions (4)
- standard math Eq. (2): k(x)=2−2ln[1−F(x)] is exact for HVG of i.i.d. data (Luque et al. 2009) and “holds to a good approximation” for the VG of correlated stationary processes
- ad hoc to paper Ensemble-averaged monotonicity of k(x), plus the logarithmic tail of Eq. (2), implies rank(k)=rank(x) holds for the largest values in finite samples
- domain assumption VG-stationarity of the degree distribution of nonstationary processes makes degree ranking a meaningful indicator of local extremes
- ad hoc to paper Peak-value subsampling preserves extreme-value detection
Cite this review
Pith. "Pith review of Visibility graph-based characterization of extreme values in time series." pith.science (2026). https://pith.science/paper/GTLHRHNJ
@misc{pith2026260725214,
  author       = {Pith},
  title        = {Pith review of: Visibility graph-based characterization of extreme values in time series},
  year         = {2026},
  howpublished = {\url{https://pith.science/paper/GTLHRHNJ}},
  note         = {Machine review of arXiv:2607.25214}
}
read the original abstract
Complex dynamical systems often display extreme fluctuations of an observed variable that constitute significant deviations from the long-term average, and which are often associated with severe impacts on the system. By definition, extreme events are therefore usually explored from time series recordings. In this work, we characterize extreme values in time series using visibility graphs, a method that non-parametrically maps a time series onto a network, whose topological structure is known to inherit important characteristics of the original time series dynamics. Unlike threshold-based approaches, extreme values in this framework can be identified without the need to introduce external parameters and can be applied to time series generated by both stationary and nonstationary processes. For stationary processes, we exploit a known property of visibility graphs in which the degree of a node is monotonically and nonlinearly related to the corresponding data value. This nonlinear amplification enhances the contribution of large values while suppressing noise, while the monotonic relationship enables a direct ranking of data points according to node degree. This procedure identifies global extreme values and locally prominent ones. For nonstationary processes, the degree ranking in the visibility graph still provides a robust indicator of relative importance. We validate our findings with synthetic time series and with real climatological data. Our results show that extreme-value characterization in stationary time series is enhanced when combining standard methods with visibility-graph-based detection, whereas for nonstationary data, where conventional approaches are often ill-posed, visibility graphs provide an effective alternative. We discuss how sub-sampling the time series using only peak values preserves the ability to identify extreme values while reducing computational cost.
Figures


Figures from the paper (6 more)




Reference graph
Works this paper leans on
-
[1]
Albeverio, V
S. Albeverio, V . Jentsch, E. Kantz, H., Extreme Events in Nature and Society, Springer, 2006
2006
-
[2]
J. M. Beggs, D. Plenz, Neuronal avalanches in neocortical circuits, Journal of neuroscience 23 (35) (2003) 11167– 11177
2003
-
[3]
Sornette, Critical market crashes, Physics reports 378 (1) (2003) 1–98
D. Sornette, Critical market crashes, Physics reports 378 (1) (2003) 1–98
2003
-
[4]
Kharif, E
C. Kharif, E. Pelinovsky, A. Slunyaev, Rogue Waves in the Ocean, Springer, 2009
2009
-
[5]
D. R. Solli, C. Ropers, P. Koonath, B. Jalali, Optical rogue waves, Nature 450 (2007) 1054
2007
-
[6]
Bonatto, M
C. Bonatto, M. Feyereisen, S. Barland, M. Giudici, C. Ma- soller, J. R. Rios Leite, J. R. Tredicce, Deterministic opti- cal rogue waves, Phys. Rev. Lett. 107 (2011) 053901
2011
-
[7]
Boers, B
N. Boers, B. Goswami, A. Rheinwalt, B. Bookhagen, B. Hoskins, J. Kurths, Complex networks reveal global pattern of extreme-rainfall teleconnections, Nature 566 (2019) 373–377
2019
-
[8]
Corral, Scaling in the timing of extreme event, Chaos, Solitons & Fractals 74 (2015) 99–112
A. Corral, Scaling in the timing of extreme event, Chaos, Solitons & Fractals 74 (2015) 99–112
2015
Show all 46 references
-
[9]
Lacasa, B
L. Lacasa, B. Luque, F. Ballesteros, J. Luque, J. C. Nuño, From time series to complex networks: The visibility graph, Proceedings of the National Academy of Sciences of the United States of America 105 (13) (2008) 4972– 4975.doi:10.1073/pnas.0709247105
2008 doi
-
[10]
Luque, L
B. Luque, L. Lacasa, F. Ballesteros, J. Luque, Horizon- tal visibility graphs: Exact results for random time series, Physical Review E—Statistical, Nonlinear, and Soft Mat- ter Physics 80 (4) (2009) 046103. 8 A B 818 709 602 651 507 399 121 909 914 925 927 922 0 20 40 60 80 10...
2009
-
[11]
Lacasa, B
L. Lacasa, B. Luque, J. Luque, J. C. Nuno, The visibility graph: A new method for estimating the hurst exponent of fractional brownian motion, EPL (Europhysics Letters) 86 (3) (2009) 30001
2009
-
[12]
Lacasa, R
L. Lacasa, R. Toral, Description of stochastic and chaotic series using visibility graphs, Physical Review E—Statistical, Nonlinear, and Soft Matter Physics 82 (3) (2010) 036120
2010
-
[13]
Lacasa, A
L. Lacasa, A. Nunez, É. Roldán, J. M. Parrondo, B. Luque, Time series irreversibility: a visibility graph approach, The European Physical Journal B 85 (6) (2012) 217
2012
-
[14]
Lacasa, W
L. Lacasa, W. Just, Visibility graphs and symbolic dynam- ics, Physica D: Nonlinear Phenomena 374 (2018) 35–44
2018
-
[15]
Lacasa, R
L. Lacasa, R. Flanagan, Time reversibility from visibil- ity graphs of nonstationary processes, Physical Review E 92 (2) (2015) 022817
2015
-
[16]
Iacovacci, L
J. Iacovacci, L. Lacasa, Sequential visibility-graph motifs, Physical Review E 93 (4) (2016) 042309
2016
-
[17]
Luque, L
B. Luque, L. Lacasa, Canonical horizontal visibility graphs are uniquely determined by their degree sequence, The European Physical Journal Special Topics 226 (3) (2017) 383–389
2017
-
[18]
Böhmer, J
T. Böhmer, J. P. Gabriel, L. Costigliola, J.-N. Kociok, T. Hecksher, J. C. Dyre, T. Blochowicz, Time reversibil- ity during the ageing of materials, Nature Physics 20 (4) (2024) 637–645
2024
-
[19]
Iacobello, L
G. Iacobello, L. Ridolfi, S. Scarsoglio, Large-to-small scale frequency modulation analysis in wall-bounded tur- bulence via visibility networks, Journal of fluid mechanics 918 (2021) A13
2021
-
[20]
Aragoneses, L
A. Aragoneses, L. Carpi, N. Tarasov, D. V . Churkin, M. C. Torrent, C. Masoller, S. K. Turitsyn, Unveiling temporal correlations characteristic to phase transition in the inten- sity of fibre laser radiation, Phys. Rev. Lett. 116 (2016) 033902
2016
-
[21]
Sannino, S
S. Sannino, S. Stramaglia, L. Lacasa, D. Marinazzo, Visi- bility graphs for fmri data: Multiplex temporal graphs and their modulations across resting-state networks, Network Neuroscience 1 (3) (2017) 208–221
2017
-
[22]
Zhuang, M
E. Zhuang, M. Small, G. Feng, Time series analysis of the developed financial markets’ integration using visibility graphs, Physica A: Statistical Mechanics and its Applica- tions 410 (2014) 483–495. 9 A B 0 500 1000 1500 2000 −40 −20 0 20 ti 640 931 1232 1496 1238 1486 1568 1...
2014
-
[23]
J. T. Moraes, S. C. Ferreira, Visibility graphs of criti- cal and off-critical time series for absorbing state phase transitions, Physical Review E 108 (4) (2023) 044309. doi:10.1103/PhysRevE.108.044309
2023 doi
-
[24]
J. T. Moraes, S. C. Ferreira, Strong localization blurs the criticality of time series for spreading phenomena on net- works, Phys. Rev. E 111 (2025) 044302.doi:10.1103/ PhysRevE.111.044302
2025
-
[25]
Zhang, E
P. Zhang, E. Dai, C. Wu, J. Hu, Spatio-temporal patterns of hot extremes in china based on complex network anal- ysis, Climate dynamics 62 (2) (2024) 841–860
2024
-
[26]
D. Zhao, X. Yang, W. Song, W. Zhang, D. Huang, Vis- ibility graph analysis of the sea surface temperature ir- reversibility during el niño events, Nonlinear Dynamics 111 (18) (2023) 17393–17409
2023
-
[27]
Beltramone, A
G. Beltramone, A. C. Frery, M. C. Scavuzzo, M. Bo- nansea, A. Ferral, Detecting seasonal snow transitions in sar time series with horizontal visibility graphs, Remote Sensing Applications: Society and Environment (2025) 101772
2025
-
[28]
Zhang, E
X. Zhang, E. C. Landsness, W. Chen, H. Miao, M. Tang, L. M. Brier, J. P. Culver, J.-M. Lee, M. A. Anastasio, Automated sleep state classification of wide-field calcium imaging data via multiplex visibility graphs and deep learning, Journal of neuroscience methods 366 (2022) 109421
2022
-
[29]
Q. Xuan, J. Zhou, K. Qiu, Z. Chen, D. Xu, S. Zheng, X. Yang, Avgnet: Adaptive visibility graph neural net- work and its application in modulation classification, IEEE Transactions on Network Science and Engineering 9 (3) (2022) 1516–1526
2022
-
[30]
H. ˙I. Aslan, C. Choi, Visgin: Visibility graph neural network on one-dimensional data for biometric authen- tication, Expert Systems with Applications 237 (2024) 121323
2024
-
[31]
Belhadi, P
A. Belhadi, P. G. Lind, Y . Djenouri, A. Yazidi, Enhanced visibility graph for eeg classification, Frontiers in neuro- science 19 (2025) 1541062
2025
-
[32]
Boccaletti, V
S. Boccaletti, V . Latora, Y . Moreno, M. Chavez, D.- U. Hwang, Complex networks: Structure and dynamics, Phys. Reports 424 (2006) 175–308
2006
-
[33]
Zanin, D
M. Zanin, D. Papo, P. Sousa, E. Menasalvas, A. Nicchi, E. Kubik, S. Boccaletti, Combining complex networks and data mining: Why and how, Phys. Reports 635 (2016) 1–44. 10 Figure 9: Degreekof a node vs its associated time series data valuex. In all panels, time series haveN=3×1...
2016
-
[34]
Kantz, T
H. Kantz, T. Schreiber, Nonlinear time series analysis, Cambridge university press, 2003
2003
-
[35]
Y . Zou, R. V . Donner, N. Marwan, J. F. Donges, J. Kurths, Complex network approaches to nonlinear time series analysis, Phys. Reports 787 (2019) 1–97
2019
-
[36]
X. Zhao, Y . Li, J. Wang, Extreme events analysis of non- stationary time series by using horizontal visibility graph, Fractals 28 (8) (2020) 2050150.doi:10.1142/S02183 48X20500899
2020 doi
-
[37]
Zhang, X
J. Zhang, X. Chen, H. Wang, C. Gu, H. Yang, Visibility graph approach to extreme event series, Chinese Physics B 32 (10) (2023) 100505.doi:10.1088/1674-1056/ acd62b
2023 doi
-
[38]
Katsouda, B
M. Katsouda, B. Boutsinas, Detecting extreme values in time series based on bar visibility, International Journal of Data Science and Analytics (2025).doi:10.1007/s410 60-025-00758-3
2025 doi
-
[39]
NOAA Physical Sciences Laboratory (PSL), Climate Pre- diction Center (CPC) Niño 3.4 Index,https://psl.no aa.gov/data/timeseries/month/DS/Nino34_CPC/, accessed 05-11-2026
2026
-
[40]
N. A. Rayner, D. E. Parker, E. B. Horton, C. K. Fol- land, L. V . Alexander, D. P. Rowell, E. C. Kent, A. Ka- plan, Global analyses of sea surface temperature, sea ice, and night marine air temperature since the late nineteenth century, Journal of Geophysical Research: Atmosph...
2003 doi
-
[41]
GISTEMP Team, GISS Surface Temperature Analysis (GISTEMP), Version 4,https://data.giss.nasa.g ov/gistemp/, accessed 05-12-2026 (2026)
2026
-
[42]
NOAA Physical Sciences Laboratory (PSL), Global Mean Land/Ocean Temperature Index,https://psl.noaa.g ov/data/climateindices/list/, accessed 05-11- 2026
2026
-
[43]
Lenssen, G
N. Lenssen, G. A. Schmidt, M. Hendrickson, P. Jacobs, M. Menne, R. Ruedy, A GISTEMPv4 observational un- certainty ensemble, Journal of Geophysical Research: At- mospheres 129 (17) (2024) e2023JD040179.doi:10.1 029/2023JD040179
2024
-
[44]
R. H. Shumway, D. S. Stoffer, Time Series Analysis and Its Applications: With R Examples, 3rd Edition, Springer, 2011
2011
-
[45]
Estrada, The structure of complex networks: theory and applications, American Chemical Society, 2012
E. Estrada, The structure of complex networks: theory and applications, American Chemical Society, 2012
2012
-
[46]
Latora, V
V . Latora, V . Nicosia, G. Russo, Complex networks: prin- ciples, methods and applications, Cambridge University Press, 2017. 11
2017
Reviewed August 1, 2026 · model on record in the stance chip above.
Discussion (0). Continue with ORCID to comment.