REVIEW 3 major objections 4 minor 1 cited by
Visual analytics for cosmological simulation results
T0 review · 3 major / 4 minor · reviewed 2026-08-03 · deepseek-v4-flash
Pith's one-line read ARGOS establishes that full visual analytics for cosmological simulation data — linked views, interactive filtering, and catalogue-to-object drill-down — can run entirely in a browser with no server-side code.
desk verdict Solid, checkable interactive-visualisation tool for simulation data; the novelty is real but the paper's load-bearing performance claims rest on assertion rather than measurement. read the letter →
The pith
A machine-rendered reading of the paper's core claim, the machinery that carries it, and where it could break.
The reading
What carries the argument
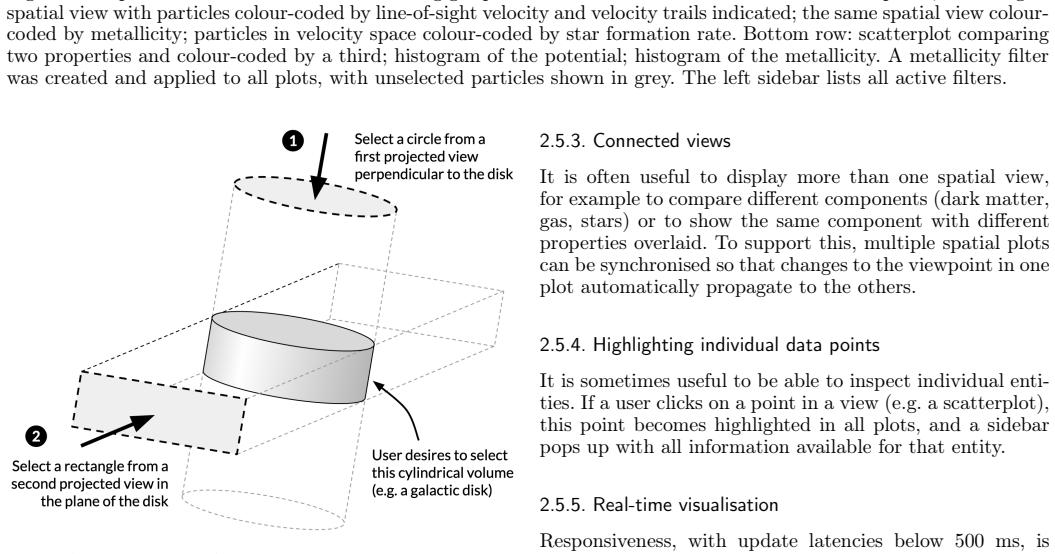
The carrying mechanism is ARGOS's client-only architecture: all datasets live in the browser's memory (IndexedDB plus TypedArrays), and all rendering happens on the GPU through direct WebGL with shader-level operations — for example, the slicing window that scans through a third dimension is computed entirely in the vertex shader, avoiding CPU–GPU round trips. On top of that sits the coordinated dashboard engine, where one shared selection filter is propagated to every linked plot, and lasso selections can be combined across viewing directions to isolate finite 3D volumes. The data model — concepts, assets, tables, properties, entities — and YAML-configured concept definitions let new datase
What would settle it
Measure interaction latency and frame rate on a mid-range laptop while lasso-brushing the 14-million-point subhalo catalogue, then update a linked histogram or scatterplot; if updates take more than 500 ms or the tab's memory use approaches browser limits, the real-time visual-analytics claim is not supported by the reported architecture.
Extended reading notes
Core claim
The paper's central claim is that the missing piece in cosmological visualisation is not raw rendering power but an accessible visual-analytics layer: coordinated views, brushing and linking, and interactive filtering that let researchers form and test hypotheses on high-dimensional simulation data. The authors argue that ARGOS is the first browser-native platform to combine this visual-analytics capability with a strong user-experience focus and effortless data dissemination. The load-bearing evidence is architectural: GPU-accelerated WebGL rendering, client-side storage in IndexedDB, a generic concept/asset/table data model, and a template-and-script system that supports catalogue-to-objec
Load-bearing premise
The paper's central claim depends on an unmeasured performance premise: that a typical modern laptop, not a specialised machine, can sustain sub-500 ms interaction latency and smooth GPU rendering for datasets up to about 10 million particles.
Editorial extensions
If this is right
- Simulation teams can publish interactive data releases by placing files on a static web server, with no backend, database, or ongoing maintenance.
- Astronomers can visually select particles in a region or phase-space subpopulation, with every linked plot updating in real time, making troubleshooting and hypothesis generation part of an exploratory, visual workflow.
- The catalogue drill-down pattern — explore a 14-million-object overview, select objects of interest, then fetch per-object detail on demand — gives a reusable template for releasing large atlases.
- Scale limits are explicit: datasets up to roughly 1–2 GB or on the order of 10^7 particles fit the browser memory budget; larger snapshots require random subsampling before import.
Reading between the lines
- If the real-time performance holds as described, the tool could shift community expectations: interactive dashboards could become the default format for simulation data releases, not just a supplement to papers.
- The drill-down architecture is generic: the same static-hosting pattern should transfer to observational survey catalogues, time-domain data, or any tabular dataset with a natural object level, not just cosmological simulations.
- The absence of published latency benchmarks means the '14 million points in real time' claim remains an open empirical question; a standardised interaction-latency measurement against established desktop tools would settle whether browser-only exploration is a research-grade replacement or a convenient complement.
- The paper's own roadmap, level-of-detail rendering and dynamic subsampling, points to a plausible path to much larger datasets; validating that path would determine whether ARGOS remains a 10^7-particle tool or scales to full simulation volumes.
Editorial analysis
A structured set of objections, weighed in public.
Referee Report
Summary. The paper presents ARGOS, an open-source, client-only web application for real-time visual analytics of cosmological simulation data. Built with TypeScript/React and WebGL, it stores assets in IndexedDB, supports HDF5 and text import, provides configurable dashboards with linked views, brushing/lasso filtering, 3D spatial and kinematic plots, shader-based slicing, and a catalogue drill-down workflow from overview assets to per-object dashboards. The authors claim interactive performance at the ~10^7-particle scale, with a 14-million-point TNG300 subhalo catalogue as a scalability showcase, and stress the value of static-HTTP, no-backend deployment for data dissemination. The manuscript includes example use cases based on IllustrisTNG, EAGLE, and SKIRT synthetic imaging data, and points to a public deployment and MIT-licensed source repository.
Significance. If the central performance and novelty claims hold, ARGOS would fill a genuine niche: a browser-native, low-barrier tool that combines linked-view visual analytics with effortless dissemination of simulation-derived data products. The paper's strengths are its concrete architecture description, the shader-level implementation for slicing, the drill-down pattern that works without server-side code, and the fact that the tool is publicly accessible and externally checkable. The reported artefact-discovery anecdote, while unpublished, suggests practical utility. However, the paper's differentiator is real-time interactivity at scale, and this is asserted rather than measured. The absence of benchmarks is a substantive gap, not a cosmetic one, because the 'Powerful' objective and the comparison with existing tools in Section 4 rest on quantitative responsiveness claims.
major comments (3)
- [§2.5.5, §2.4.3, §3.1] The paper's load-bearing claim is real-time interactivity at the claimed scale: §2.5.5 invokes the 500 ms latency standard as if it were met, and §3.1 presents the 14M-point TNG300 subhalo asset as evidence of scalability. However, no measurements are reported for any asset or interaction — no frame rate, interaction latency percentile, heap/GPU memory usage, or hardware/browser configuration. Since the 'Powerful' objective (§1) and the novelty claim in §4 rest on this, please add reproducible benchmark tables (or video traces) for rotation/pan, lasso/brush selection, shader slicing, and filter updates on at least the 14M-point asset and the TNG/EAGLE particle assets, on a stated typical laptop/browser, with latency percentiles relative to the 500 ms threshold.
- [§2.4.3] The statement that responsive interaction 'requires limiting the particle count to on the order of 10^7' is presented as a design constraint, but no derivation, measurement, or reference supports it. The companion claim that random subsampling 'preserves ARGOS's utility for interactive exploration' is an unstated assumption that defines the tool's scope and preprocessing guidance. Please quantify the relationship: memory footprint per particle, draw-call/vertex budget, and which operations were tested at what performance. If 10^7 is a heuristic, say so explicitly and provide at least one empirical data point.
- [§4 / §1] The statement that no existing tool 'provides a browser-native platform that combines interactive visual analytics, strong emphasis on user experience, and effortless data dissemination' is a strong negative claim, especially since the paper itself lists Firefly as a browser-based astronomy visualisation tool. The related-work discussion is not systematic enough to support 'none of these'. Please add a feature/comparison table covering Splotch, yt, TOPCAT, Topsy, ParaView, VisIt, Glue, Vaex, Firefly, and ARGOS with respect to interaction model, deployment model, linked views, and demonstrated dataset scale. Without this, the novelty claim is not checkable.
minor comments (4)
- [§3.2 / References] The artefact-discovery example is cited as 'Baes et al. (in prep.)'. An in-preparation citation cannot be verified by readers; please remove it or replace it with a preprint, DOI, or other publicly available reference.
- [References] The two 'Baes et al. 2024' entries are not disambiguated as a and b; this will cause confusion in the reference list and in-text citations.
- [§2.4.1] Minor typo: 'using theh5pypackage' should read 'using the h5py package'.
- [§3.1] The asset names 'TNG28 2784' and 'TNG479290' are hard to parse. Please state the underlying IllustrisTNG snapshot IDs and cutout sizes explicitly, either in the text or in a small table.
Circularity Check
No significant circularity; the paper has no derivation-to-fit structure, and its central claims are externally checkable.
full rationale
The paper is a software/tool description, not a derivation chain. The load-bearing assertions are that ARGOS provides real-time, browser-native visual analytics for cosmological particle data and that no existing tool combines these properties. These are empirical, externally checkable claims about software functionality; they are not reduced to the paper's own inputs by construction. The 500 ms latency standard in §2.5.5 is cited from external literature (Liu & Heer 2014) and stated as a design goal, not derived from ARGOS's own measurements; while the absence of measured latency/frame-rate benchmarks is a genuine evidence gap that weakens the scalability claim, it is not circularity. The 10^7 particle-count guidance in §2.4.3 is a stated design constraint, not a fitted parameter that is later renamed a prediction. The only potentially self-referential element is the anecdotal validation in §3.2 citing 'Baes et al. (in prep.)' for an artefact discovery using ARGOS; however, this is an illustrative use case, not the foundation of the paper's central claim, and the tool's operation is independently verifiable on public IllustrisTNG/EAGLE data and shipped source code. No equations are equated, no fitted parameter is relabeled as a prediction, and no uniqueness theorem from the authors is invoked to forbid alternatives. The paper therefore does not exhibit the specific reduction patterns required to establish circularity.
Assumptions & free parameters
free parameters (1)
- interactive particle budget =
~10^7 particles
assumptions (4)
- domain assumption HDF5 is the de facto standard for cosmological simulation outputs and is faithfully supported in-browser via h5wasm
- domain assumption Visual analytics paradigms validated in bioinformatics/social sciences (linked views, brushing & linking) transfer to cosmological simulation exploration and produce scientific insight
- ad hoc to paper Random subsampling to ~10^7 particles preserves the exploratory utility of full-resolution simulation outputs
- domain assumption WebGL/IndexedDB browser environment delivers the promised real-time interaction (sub-500 ms updates) on typical laptops for million-point datasets
Cite this review
Pith. "Pith review of Visual analytics for cosmological simulation results." pith.science (2026). https://pith.science/paper/2D4PPPPC
@misc{pith2026260729426,
  author       = {Pith},
  title        = {Pith review of: Visual analytics for cosmological simulation results},
  year         = {2026},
  howpublished = {\url{https://pith.science/paper/2D4PPPPC}},
  note         = {Machine review of arXiv:2607.29426}
}
read the original abstract
Context: Modern cosmological simulations rely on sophisticated assumptions and generate rich, highly complex datasets. Interpreting their results in order to extract new scientific insights remains challenging. Existing visualisation tools offer powerful capabilities but often come with a relatively high barrier for entry, and are not designed with a focus on knowledge discovery through real-time, intuitive visual analytics. This stands in contrast to other research domains, such as bioinformatics, where visual analytics tools have become deeply embedded in scientific discovery workflows. Aim: Our goal is to complement the existing ecosystem of cosmological visualisation tools with a lightweight, user-friendly application that supports visual analytics and frictionless dissemination of results to the scientific community. Methods: We developed ARGOS, an open-source, web-based environment for real-time visual analytics, tailored to cosmological simulation outputs and designed with an emphasis on user experience. ARGOS combines GPU-accelerated browser rendering for interactive exploration of large datasets with a template-driven approach that enables rapid adaptation to other types of data and analysis workflows. Importantly, ARGOS combines catalogue-level and object-level exploration, allowing users to move seamlessly from large ensembles of objects to snapshots of individual objects. Results: We demonstrate how ARGOS can support intuitive visual data exploration through example dashboards for multiple cosmological particle datasets, and illustrate broader applicability with dashboards for SKIRT synthetic multi-band imaging data products. Source code is freely available at https://github.com/pvaut/skirt-argos under the MIT licence. A reference deployment, including sample data, is available at https://skirt-argos.ugent.be.
Figures


Figures from the paper (1 more)

Forward citations
Cited by 1 Pith paper
-
The TNG50-SKIRT Atlas: Spatially resolved synthetic galaxies from the ultraviolet to the submillimetre (DR2)
TNG50-SKIRT Atlas DR2 provides 1154 simulated galaxies with resolved UV-to-submm images, spectral cubes, and dust-aware synthetic observables, publicly released.
Reference graph
Works this paper leans on
-
[1]
2024, A&A, 683, A181
Baes, M., Gebek, A., Trčka, A., et al. 2024, A&A, 683, A181
2024
-
[2]
2024, A&A, 683, A182
Baes, M., Mosenkov, A., Kelly, R., et al. 2024, A&A, 683, A182
2024
-
[3]
2015, in ADASS XXIV
Beaumont, C., Goodman, A., Greenfield, P., Robitaille, T., & Borkin, M. 2015, in ADASS XXIV
2015
-
[4]
Breddels, M. A. & Veljanoski, J. 2018, A&A, 618, A13
2018
-
[5]
& Baes, M
Camps, P. & Baes, M. 2015, Astron. Comput., 9, 20
2015
-
[6]
Chui, K. K. H., Wenger, J. B., Cohen, S. A., & Naumova, E. N. 2011, PLoS ONE, 6, e14683
2011
-
[7]
Crain, R. A. & van de Voort, F. 2023, ARA&A, 61, 473–515
2023
-
[8]
2008, New J
Dolag, K., Reinecke, M., Gheller, C., & Imboden, S. 2008, New J. Phys., 10, 125006
2008
Show all 31 references
-
[9]
2011, ACM Int
Federico, P., Aigner, W., Miksch, S., Windhager, F., & Zenk, L. 2011, ACM Int. Conf. Proceeding Ser
2011
-
[10]
& Bieri, R
Feldmann, R. & Bieri, R. 2026, in Encyclopedia of Astrophysics, Vol- ume 4, Vol. 4, 576–599
2026
-
[11]
2022, Astron
Hausammann, L., Gonnet, P., & Schaller, M. 2022, Astron. Comput., 41, 100659
2022
-
[12]
& Shneiderman, B
Heer, J. & Shneiderman, B. 2012, Communications of the ACM, 55, 45 Höllt, T., Pezzotti, N., van Unen, V., et al. 2016, Comput. Graph. Forum, 35, 171
2012
-
[13]
2008, Visual Analytics:
Keim, D., Andrienko, G., Fekete, J.-D., et al. 2008, Visual Analytics:
2008
-
[14]
S., Gold, I., McCallum, C., et al
Keller, M. S., Gold, I., McCallum, C., et al. 2025, Nat. Methods, 22, 63
2025
-
[15]
& Heer, J
Liu, Z. & Heer, J. 2014, IEEE Trans. Vis. Comput. Graph., 20, 2122
2014
-
[16]
2019, Comput
Nelson, D., Pillepich, A., Springel, V., et al. 2019, Comput. Astrophys. Cosmol., 6, 2
2019
-
[17]
& Shneiderman, B
North, C. & Shneiderman, B. 2000, in Int. J. Hum. Comput. Stud., Vol. 53, 715–739
2000
-
[18]
M., Savelyev, A., & Robinson, A
Pezanowski, S., MacEachren, A. M., Savelyev, A., & Robinson, A. C. 2018, Cartogr. Geogr. Inf. Sci., 45, 420
2018
-
[19]
2009, Inf
Pike, W., Stasko, J., Chang, R., & O’Connell, T. 2009, Inf. Vis., 8, 263
2009
-
[20]
2009, IEEE trans- actions on visualization and computer graphics, 15, 1113
Piringer, H., Tominski, C., Muigg, P., & Berger, W. 2009, IEEE trans- actions on visualization and computer graphics, 15, 1113
2009
-
[21]
W., et al
Schaller, M., Borrow, J., Draper, P. W., et al. 2024, MNRAS, 530, 2378
2024
-
[22]
A., Bower, R
Schaye, J., Crain, R. A., Bower, R. G., et al. 2015, MNRAS, 446, 521
2015
-
[23]
Somerville, R. S. & Davé, R. 2015, ARA&A, 53, 51
2015
-
[24]
2021, MNRAS, 506, 2871
Springel, V., Pakmor, R., Zier, O., & Reinecke, M. 2021, MNRAS, 506, 2871
2021
-
[25]
2002, IEEE Trans
Stolte, C., Tang, D., & Hanrahan, P. 2002, IEEE Trans. Vis. Comput. Graph., 8, 52
2002
- [26]
-
[27]
Thomas, J. J. & Cook, K. A. 2005, Illuminating the Path: The Re- search and Development Agenda for Visual Analytics (IEEE Com- puter Society Press)
2005
-
[28]
J., Smith, B
Turk, M. J., Smith, B. D., Oishi, J. S., et al. 2011, ApJS, 192, 9
2011
-
[29]
2017, Bioinformatics, 33, 3243
Vauterin, P., Jeffery, B., Miles, A., et al. 2017, Bioinformatics, 33, 3243
2017
-
[30]
Vogelsberger, M., Marinacci,F., Torrey,P., &Puchwein, E.2020, Nat. Rev. Phys., 2, 42
2020
-
[31]
2021, Nucleic Acids Res., 49, W476 Article number, page 9
Zhou, G., Ewald, J., & Xia, J. 2021, Nucleic Acids Res., 49, W476 Article number, page 9
2021
Reviewed August 3, 2026 · model on record in the stance chip above.
Discussion (0). Sign in to comment.