REVIEW 3 major objections 5 minor 38 references
Optical Counterparts of MeerKLASS L-band and UHF-band surveys
T0 review · 3 major / 5 minor · reviewed 2026-08-07 · deepseek-v4-flash
Pith's one-line read The Stellar-mass Enhanced Density Association method matches MeerKLASS radio sources to optical hosts with 94.7% purity and recovers rare high-redshift quasars.
desk verdict A useful empirical counterpart-matching method with solid catalogs, but the headline purity rests on a control catalog that needs external validation before the P_assoc numbers are used as hard probabilities. read the letter →
The pith
A machine-rendered reading of the paper's core claim, the machinery that carries it, and where it could break.
The reading
What carries the argument
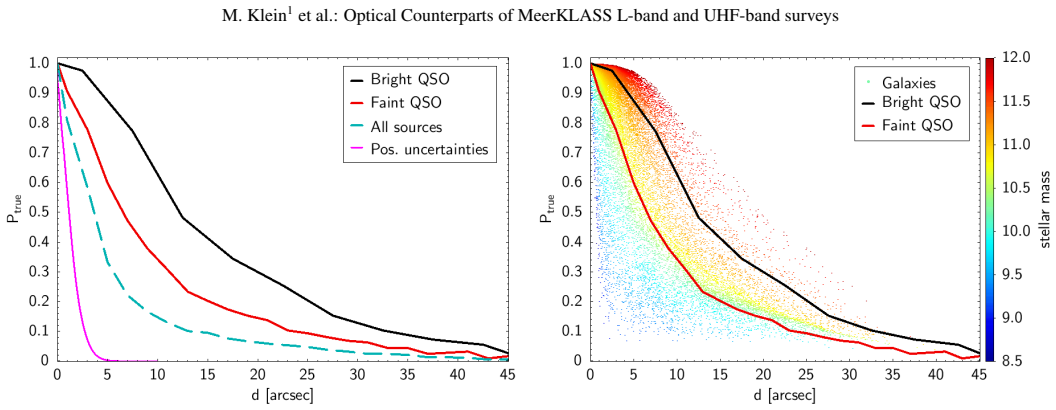
The load-bearing object is the empirical probability estimator $P_{\rm true}(d,M_\star,z)=1-n_{\rm BG}(M_\star,z)/n_S(d,M_\star,z)$ (Eq. 1), with $d$ an elliptical radio-optical offset that accounts for the elongated MeerKLASS beams; galaxies are binned in three redshift slices and 52 stellar-mass bins, and quasar candidates get the offset-only analogue $P_{\rm true}(d)=1-n_{\rm BG}/n_S(d)$ (Eq. 2). The control catalog, created by applying a uniform 6 arcmin shift to all radio positions and rerunning the full two-pass search, is what converts the raw empirical densities into calibrated association probabilities $P_{\rm assoc}$ and sample purity (Eq. 3). The second-pass machinery, midpoints between nearest unmatched neighbors plus low-deblending detection centers, is what lets the method recover multi-component radio galaxies and produce combined fluxes for merged systems.
What would settle it
A direct falsifier is to compare SEDA counterparts with an independent spectroscopic campaign: take random samples of low-$P_{\rm true}$ candidates ($P_{\rm true}<0.2$) and high-$P_{\rm true}$ candidates in both fields; if a substantial fraction of low-$P_{\rm true}$ candidates share the radio source redshift, the control rescaling underestimates chance associations at the true positions. A second concrete check is to measure the MeerKLASS radio-source two-point correlation function at separations of 1-10 arcmin, since significant clustering at those scales would break the assumption built into the uniform 6 arcmin displaced control.
Extended reading notes
Core claim
The central claim, stated on the paper's own terms, is that empirical density comparison substitutes for the parametric likelihood-ratio assumptions used in earlier cross-identification work. Around each radio position SEDA measures the density of optical/infrared candidates $n_S(d,M_\star,z)$ in radial, stellar-mass, and redshift bins, and estimates the probability that a candidate is the true host as $P_{\rm true}=1-n_{\rm BG}/n_S$, with the background $n_{\rm BG}$ taken from a 45 to 60 arcsec annulus. Quasar candidates are handled separately using offset alone plus WISE color selection ($w1-w2>-0.2$, $w2<21$), split at $w2=19.5$ into bright and faint subsets. A position-displaced control catalog built by shifting all radio positions 6 arcmin provides the chance-association distribution; after rescaling its low-$P_{\rm true}$ tail to the real data, the paper derives $P_{\rm assoc}$ and reports the purity and completeness numbers. A two-pass search that uses midpoints between unmatched neighboring radio sources and low-deblending detection centers merges many multi-component systems onto a single host, with visual inspection of difficult subsets finding correct host assignment in 86% of flagged non-primary components.
Load-bearing premise
The whole calibration assumes that shifting every radio position by six arcminutes gives a fair estimate of chance alignments at the real positions, and that low-probability matches are mostly chance alignments.
Editorial extensions
If this is right
- If the central claim is correct, the $P_{\rm true}>0.5$ thresholds in both released catalogs come with measured approximately 95% purity, so users can trade completeness against contamination simply by choosing thresholds in $P_{\rm true}$ or $P_{\rm assoc}$.
- The L-band KiDS catalog contains 20,400 counterparts (66% of sources) and the UHF catalog 61,633 counterparts (81% of sources), providing the first statistically usable host samples for MeerKLASS DR1.
- The catalogs separate host populations by redshift, stellar mass, WISE-based quasar selection, and LS DR10 light-profile morphology, enabling radio luminosity versus stellar mass studies and AGN versus star-formation decomposition.
- The two-pass merging assigns combined radio fluxes for multi-component systems, so extended radio galaxies that would otherwise be split or lost can enter the analysis.
- Rare high-redshift radio-loud quasars are recoverable automatically, including QSO J2318-3113 at $z=6.44$ and UHF_DR1 J+111111.8+053626.6 at $z=5.24$.
Reading between the lines
- Editorial inference: the control-catalog design is transportable to other wide-area radio surveys with different beam shapes; re-running SEDA on LoTSS or EMU footprints would show whether the 94.7% purity calibration holds when optical source density and beam ellipticity change.
- Editorial inference: the paper's own Appendix B shows LS DR10 photo-z estimates are truncated near $z\approx1.5$ for massive passive galaxies, so the 81% UHF completeness almost certainly overstates recovery of passive hosts at $z>1.5$; a near-infrared-based check in the COSMOS overlap would quantify the shortfall.
- Editorial inference: the 6 arcmin displaced control assumes radio sources do not cluster strongly on arcminute scales; as MeerKLASS grows, measuring the radio two-point correlation function at 1-10 arcmin and building a clustered mock control would test this directly.
- Editorial inference: the spectroscopic subset (22% of L-band and 44% of UHF counterparts) can serve as an independent validator of the probability calibration; if the observed same-redshift fraction within $P_{\rm true}$ bins does not track $P_{\rm assoc}$, the rescaling procedure would need revision.
Editorial analysis
A structured set of objections, weighed in public.
Referee Report
Summary. The paper presents optical and infrared counterpart catalogs for the first MeerKLASS L-band and UHF-band continuum surveys, using KiDS DR5 and DESI Legacy Imaging Surveys DR10, respectively. To identify hosts, the authors introduce the Stellar-mass Enhanced Density Association (SEDA) method, which compares the density of optical candidates around radio positions with a background estimate and, for galaxies, incorporates stellar mass and redshift; quasar candidates are handled separately with WISE-based selection. A position-displaced control catalog (a uniform 6-arcmin shift) is used to estimate the chance-association rate, and a second-pass search merges multi-component radio sources. The paper reports 20,400 L-band counterparts (66% of sources in the KiDS footprint) and 61,633 UHF counterparts (81%) with Ptrue > 0.5, a purity of 94.7% at that threshold, and recovery of rare high-redshift quasars including QSO J2318-3113 at z=6.44. The catalogs are intended to enable studies of radio source populations and host-galaxy demographics.
Significance. If the reliability estimates are correct, SEDA offers a practical, data-driven alternative to likelihood-ratio methods for wide-area radio surveys with complex morphologies, and the catalogs themselves are a valuable community resource. The paper is honest about its limitations, discloses the self-referential nature of the purity calibration, and includes visual audits of challenging cases. The recovery of known high-redshift quasars is a concrete demonstration of sensitivity. However, the headline purity and completeness rest on assumptions about the control catalog that are not independently validated, and the paper's own visual inspections show higher contamination in the complex-source populations that motivate the method. The cross-catalog comparison also reveals a non-negligible rate of conflicting assignments. These issues bear directly on the central claims and require additional work before the reliability numbers can be taken at face value.
major comments (3)
- [Sec. 3.4, Eq. (3)] The purity estimate of 94.7% for Ptrue>0.5 depends entirely on the assumption that the position-displaced control catalog (uniform 6-arcmin shift) reproduces the chance-association distribution at the true radio positions. The rescaling to the real catalog at Ptrue<0.2 in the top panel of Fig. 9 only matches the overall normalization; it cannot correct for a shape mismatch in the high-Ptrue tail. If MeerKLASS radio sources preferentially reside in large-scale galaxy overdensities on scales comparable to or larger than the search radius, the chance-association rate at true positions could differ from that at the shifted positions. I recommend validating the control with several displacement amplitudes (e.g., 3, 6, and 10 arcmin) or a random-position control, and reporting how the resulting purity changes. Without such a test, the 94.7% figure is an assumption rather than a measured reliability.
- [Sec. 3.3] The visual inspections of the three most challenging subsets find that 10–15% of sources with Ptrue>0.5 are assigned an incorrect counterpart, and the flagged non-primary sample shows 12% incorrect source merging. These rates are inconsistent with a global purity of 94.7% (5.3% contamination) if the challenging subsets make up a non-negligible fraction of the catalog. The abstract emphasizes 'complex source morphologies' as a key motivation, so the paper should quantify what fraction of the catalog falls into these challenging regimes (e.g., by size, signal-to-noise ratio, number of PyBDSF components) and present purity as a function of that complexity. Without this, the headline purity and the abstract's claim about complex morphologies are in tension.
- [Sec. 4.3] In the overlapping high-quality footprint, 7.4% of L-band counterparts with Ptrue>0.5 and 1.9% with Ptrue>0.9 have different optical hosts depending on whether KiDS or LS DR10 is used; visual inspection leaves 53% of the high-confidence differing cases ambiguous. Since the claimed contamination is only 5.3% at Ptrue>0.5, the cross-catalog disagreement alone is comparable to the claimed purity. The paper should discuss how the global purity estimate can be consistent with this catalog-dependent disagreement, or provide a joint classification that explicitly quantifies the probability that either assignment is correct.
minor comments (5)
- [Sec. 5] In the sentence before Appendix A, 'column desciption' should be 'column description'.
- [Sec. 3.1.2, Eq. (2)] Eq. (2) uses n_BG without the dependencies shown in Eq. (1); please define n_BG consistently and clarify whether it is averaged over magnitude and redshift for quasar candidates.
- [Sec. 3.3] In the visual-audit paragraph, 'the associated and the best counterpart had Ptrue<0.5' is grammatically unclear; consider rewording to 'the assigned best counterpart had Ptrue<0.5'.
- [References] Several references are incomplete: Bilicki et al. 2021, Hardcastle et al. 2023, Nakoneczny et al. 2021, and Smith et al. 2011 lack volume and page/article numbers; please complete them before publication.
- [Sec. 3.1.1] The paper states that elliptical distances are used to account for beam ellipticity, but the formula for the elliptical distance (axis-ratio scaling) is not given; please provide it so the offset definition is reproducible.
Circularity Check
SEDA's Ptrue and purity estimates are empirical calibrations with disclosed assumptions; no load-bearing reduction to the method's own inputs is present.
full rationale
The derivation chain is self-contained rather than circular. Equation (1) defines Ptrue as 1 - nBG/nS, where nS and nBG are measured densities around radio positions and in an outer annulus; this is an empirical density-enhancement estimate, not a quantity defined in terms of the final purity. The control catalog of Sec. 3.4 applies a uniform 6-arcmin shift and reruns the same search; its Ptrue distribution is an independent null measurement. The rescaling of the control to match the real Ptrue distribution at low Ptrue is a standard mixture-model normalization, and the paper explicitly states that Passoc approaches zero at low Ptrue "by construction." The headline purity of 94.7% at Ptrue>0.5 is an output of Eq. (3), not an input: it is the complement of the ratio of rescaled-control to real associations at that threshold, and it is not equal to any fitted parameter. Concerns about whether the 6-arcmin control reproduces the true background (e.g., if radio sources cluster in galaxy overdensities) are validity assumptions, not circular reductions; the paper discloses the assumption. External anchors—recovery of known quasars QSO J2318-3113 (z=6.44) and UHF_DR1 J+111111.8+053626.6 (z=5.24), the KiDS versus LS DR10 consistency check, and the visual inspection subsets with their disclosed 10–15% failure rates—provide independent checks of sensitivity and limitations. Companion-paper citations (Paul et al. 2025; Mangla et al. 2025; Chatterjee et al. 2025) are data-provenance references to externally produced catalogs and imaging, not self-supporting theoretical claims. No equation in the paper reduces a predicted quantity to a fitted input by construction.
Assumptions & free parameters
free parameters (6)
- LS DR10 stellar-mass estimator =
Not quoted; calibrated with COSMOS and GAMA reference samples
- Redshift bin boundaries for Ptrue =
z<0.2, 0.2<=z<0.4, z>=0.4
- Control-catalog displacement =
6 arcmin
- Quasar selection cuts =
w1-w2 > -0.2, w2 < 21, bright/faint split at w2 = 19.5
- Second-pass acceptance threshold =
Ptrue,2nd - Ptrue,1st > 0.2 and Ptrue,2nd > 0.5
- SEDA density-grid binning =
30 radial bins out to 45 arcsec, 52 stellar-mass bins from log M* = 7.3 to 12.5, 3 redshift bins
assumptions (5)
- domain assumption The background catalog measured at positions displaced by 6 arcmin has the same density as the background at the true radio positions.
- domain assumption The low-Ptrue end of the real catalog (Ptrue<0.2) is dominated by chance associations, allowing the control distribution to be rescaled to match it.
- domain assumption The excess optical source density around radio positions relative to background consists entirely of genuine hosts.
- domain assumption All MeerKLASS detections are real radio sources, so the unassociated fraction estimates completeness directly.
- domain assumption The photometric redshifts and stellar masses used to populate the bins are sufficiently accurate, aside from the documented biases.
Cite this review
Pith. "Pith review of Optical Counterparts of MeerKLASS L-band and UHF-band surveys." pith.science (2026). https://pith.science/paper/UMI6FOYU
@misc{pith2026260805923,
  author       = {Pith},
  title        = {Pith review of: Optical Counterparts of MeerKLASS L-band and UHF-band surveys},
  year         = {2026},
  howpublished = {\url{https://pith.science/paper/UMI6FOYU}},
  note         = {Machine review of arXiv:2608.05923}
}
abstract
Context: Wide-area radio continuum surveys require reliable optical and infrared counterpart identification, but high optical source densities and extended or multi-component radio morphologies make this challenging. Aims: We present optical and infrared counterpart catalogs for MeerKLASS L-band and UHF-band on-the-fly continuum sources using KiDS DR5 and DESI Legacy Imaging Surveys DR10 (LS DR10), including counterpart probabilities, redshifts, and host-galaxy properties. Methods: We developed the Stellar-mass Enhanced Density Association (SEDA) method, an empirical framework that compares candidate densities around radio positions with those in a position-displaced control catalog. For galaxies we use positional offset, stellar mass, and redshift; quasar candidates are treated separately using offset and mid-infrared selection. A second-pass search associates multi-component radio sources with common hosts. Results: In the L-band survey, we identify 20,400 KiDS-based counterparts with $P_{\rm true}>0.5$, corresponding to 66% of L-band sources within the KiDS footprint. In the UHF-band survey, we identify 61,633 LS DR10 counterparts, corresponding to 81% of the radio sources. Spectroscopic redshifts are available for 22% and 44% of the L-band and UHF-band counterparts, respectively. The redshift distributions show low-redshift star-forming galaxies, intermediate-redshift radio galaxies, and a high-redshift tail dominated by quasars. SEDA also recovers rare radio-loud quasars, including QSO J2318-3113 at $z=6.44$ and UHF_DR1 J+111111.8+053626.6 at $z=5.24$. Conclusions: SEDA provides a data-driven route to counterpart identification for wide-area radio surveys with complex source morphologies. The catalogs enable future MeerKLASS studies of radio source populations, host-galaxy demographics, and rare high-redshift radio quasars.
Figures


Figures from the paper (11 more)


Reference graph
Works this paper leans on
-
[1]
F., Argudo-Fernández, M., et al
Almeida, A., Anderson, S. F., Argudo-Fernández, M., et al. 2023, ApJS, 267, 44
2023
-
[2]
H., White, R
Becker, R. H., White, R. L., & Helfand, D. J. 1995, ApJ, 450, 559
1995
-
[3]
Best, P. N., Kauffmann, G., Heckman, T. M., & Ivezi´c, Ž. 2005, MNRAS, 362, 9
work page 2005
-
[4]
2000, A&AS, 143, 33
Bonnarel, F., Fernique, P., Bienaymé, O., et al. 2000, A&AS, 143, 33
2000
-
[5]
Chatterjee, S., Santos, M. G., Rozgonyi, K., et al. 2025, MNRAS, submitted [arXiv:2512.11978]
arXiv 2025
-
[6]
Condon, J. J., Cotton, W. D., Greisen, E. W., et al. 1998, AJ, 115, 1693 DESI Collaboration, Abdul Karim, M., Adame, A. G., et al. 2025, arXiv e-prints, arXiv:2503.14745
arXiv 1998
-
[7]
J., Lang, D., et al
Dey, A., Schlegel, D. J., Lang, D., et al. 2019, AJ, 157, 168
2019
- [8]
Show all 38 references
-
[9]
Hale, C. L. et al. 2021, PASA, 38, e058
2021
-
[10]
Hardcastle, M. J. et al. 2023, A&A
2023
-
[11]
Heywood, I. et al. 2022, MNRAS, 509, 2150
2022
-
[12]
2025, PASA, 42, e071
Hopkins, A., Kapinska, A., Marvil, J., et al. 2025, PASA, 42, e071
2025
-
[13]
2021, A&A, 647, L11
Ighina, L., Belladitta, S., Caccianiga, A., et al. 2021, A&A, 647, L11
2021
-
[14]
Lacy, M. et al. 2020, PASP, 132, 035001
2020
-
[15]
Laigle, C. et al. 2016, ApJS, 224, 24
2016
-
[16]
W., & Mykytyn, D
Lang, D., Hogg, D. W., & Mykytyn, D. 2016, The Tractor: Probabilistic astro- nomical source detection and measurement, Astrophysics Source Code Li- brary, record ascl:1604.008
2016
-
[17]
W., Higley, A
Lyke, B. W., Higley, A. N., McLane, J. N., et al. 2020, ApJS, 250, 8
2020
-
[18]
J., Rozgonyi, K., et al
Mangla, S., Mohr, J. J., Rozgonyi, K., et al. 2025, MNRAS, submitted [arXiv:2512.17685]
2025
-
[19]
McAlpine, K., Smith, D. J. B., Jarvis, M. J., Bonfield, D. G., & Fleuren, S. 2012, MNRAS, 423, 132
2012
-
[20]
& Rafferty, D
Mohan, N. & Rafferty, D. 2015, PyBDSF: Python Blob Detection and Source
2015
-
[21]
Nakoneczny, S. et al. 2021, A&A
2021
-
[22]
G., et al
Paul, S., Grainge, K., Santos, M. G., et al. 2025, MNRAS, submitted [arXiv:2512.11964]
2025
-
[23]
Santos, M. G. et al. 2017, MeerKAT Large Survey Project proposal
2017
-
[24]
F., Meisner, A
Schlafly, E. F., Meisner, A. M., & Green, G. M. 2019, ApJS, 240, 30
2019
-
[25]
Shimwell, T. W. et al. 2019, A&A, 622, A1
2019
-
[26]
Smith, D. J. B. et al. 2011, MNRAS Smolˇci´c, V . et al. 2017, A&A, 602, A1
2011
-
[27]
& Saunders, W
Sutherland, W. & Saunders, W. 1992, MNRAS, 259, 413
1992
-
[28]
N., Hopkins, A
Taylor, E. N., Hopkins, A. M., Baldry, I. K., et al. 2011, MNRAS, 418, 1587
2011
-
[29]
Taylor, M. B. 2005, in Astronomical Society of the Pacific Conference Se- ries, V ol. 347, Astronomical Data Analysis Software and Systems XIV , ed. P. Shopbell, M. Britton, & R. Ebert, 29
2005
-
[30]
R., Kauffmann, O
Weaver, J. R., Kauffmann, O. B., Ilbert, O., et al. 2022, ApJS, 258, 11
2022
-
[31]
Williams, W. L. et al. 2019, A&A, 622, A2
2019
-
[32]
H., Kuijken, K., Hildebrandt, H., et al
Wright, A. H., Kuijken, K., Hildebrandt, H., et al. 2024, A&A, 686, A170
2024
-
[33]
Wright, E. L. et al. 2010, AJ, 140, 1868
2010
-
[34]
2023, ApJS, 269, 27
Yang, J., Fan, X., Gupta, A., et al. 2023, ApJS, 269, 27
2023
-
[35]
G., Adelman, J., Anderson, Jr., J
York, D. G., Adelman, J., Anderson, Jr., J. E., et al. 2000, AJ, 120, 1579
2000
-
[36]
2023a, J
Zhou, R., Ferraro, S., White, M., et al. 2023a, J. Cosmology Astropart. Phys., 2023, 097
2023
-
[37]
2023b, arXiv e-prints, arXiv:2309.06443
Zhou, R., Ferraro, S., White, M., et al. 2023b, arXiv e-prints, arXiv:2309.06443
-
[38]
A., Mao, Y .-Y ., et al
Zhou, R., Newman, J. A., Mao, Y .-Y ., et al. 2021, MNRAS, 501, 3309 Article number, page 15 A&A proofs:manuscript no. aa_MeerKLASS_Optfollowup_v4 Table A.1: SEDA-based columns added to the original MeerK- LASS columns for the main UHF-band counterpart catalog. Name Descriptio...
2021
Reviewed August 7, 2026 · model on record in the stance chip above.
Discussion (0). Continue with ORCID to comment.