REVIEW 4 major objections 5 minor 16 references
Extreme Value Alpha and Crash Risk: Separating Structural Tails from Lottery Tails with LLM-Extracted Disclosure Networks
T0 review · 4 major / 5 minor · reviewed 2026-08-11 · deepseek-v4-flash
Pith's one-line read The same hot return tail can signal a crash or a structural winner; this paper separates the two using the firm's disclosure-measured network, with tail heat plus network death predicting negative forward returns and tail heat with an…
desk verdict Honest, well-structured paper with a plausible conditional tail signal, but the pending extractor audit is the load-bearing test and the alpha side is not yet supported. read the letter →
The pith
A machine-rendered reading of the paper's core claim, the machinery that carries it, and where it could break.
The reading
What carries the argument
The central object is the disclosure-measured economic network: a directed, weighted, point-in-time graph of documented counterparty relationships extracted from 10-K filings by a frozen LLM prompt, with every edge grounded in quoted text. Its vintage-to-vintage rewiring decomposes exactly into birth mass B, death mass D, and continuing drift C via B + D + C = Σ|w_e,t − w_e,t−1| over directed pairs. The paper's argument is carried by the interaction between tail heat (the rolling Hill estimator ξ̂+ on the top 5% of trailing two-year daily excess returns) and death mass D; the sign of that interaction is the discriminator that separates crash tails from structural winner tails.
What would settle it
Run the frozen confirmatory P1 endpoint on the ecosystem-coherent universe after the density gate passes: if the test-period coefficient on z(ξ̂+) × z(D) in the firm-vintage collapsed regression is non-negative or has a one-sided wild-cluster p ≥ 0.05, the paper's central separation claim is refuted. A cheaper observation is the density gate itself: if a seeded 200-filing pre-test shows fewer than 30% of firm-vintages with D > 0, the universe rule fails and no confirmatory claim can be made.
Extended reading notes
Core claim
The paper claims that heavy tails come in two kinds: lottery tails, which earn the MAX discount, and structural tails, which are persistent repricing processes. The same observable tail heat sits on top of both, and only the rewiring of the firm's disclosure-measured network separates them. Concretely, in the pilot the interaction of the rolling Hill tail index with death mass—the sum of lapsed edge weights between filing vintages—predicts forward six-month abnormal returns negatively (monthly t ≈ -2.9; collapsed to firm-vintages t ≈ -3.9; wild-cluster p = 0.04), while the interaction with birth mass is statistically indistinguishable from zero. The paper presents this as support for the crash side and as a danger flag today, while the winner side—heat with births, without deaths—is held to the stricter confirmatory standard.
Load-bearing premise
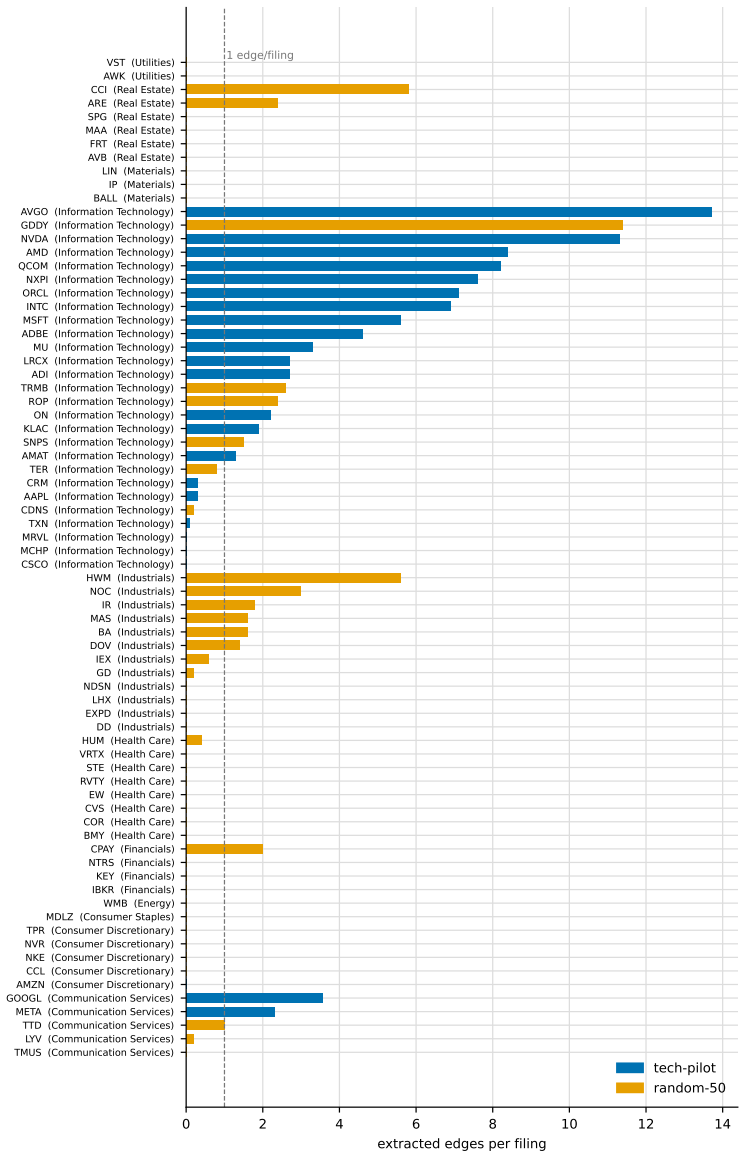
The load-bearing premise is that the disclosure-measured network is a valid, point-in-time representation of the firm's actual economic configuration, so edge births and deaths correctly capture real relationship changes. That requires accurate LLM extraction and complete counterparty coverage; the paper's own audits show 2 of 12 zero-edge filings were extraction failures, a cutoff-matched extractor audit is still pending, and the panel-interior restriction attenuates death detection for counterparts outside the universe.
Editorial extensions
If this is right
- If the confirmatory endpoint P1 confirms, the MAX anomaly is revealed as a pooled price on two objects: correctly applied to lottery tails, misapplied to structural tails.
- The death-side interaction is immediately usable as a risk-monitoring danger flag even before confirmation, because a missed crash costs more than a false alarm.
- If the confirmatory endpoint P2 confirms, a screen of tail heat plus birth-dominated rewiring would identify forward extreme winners at higher precision than MAX, momentum, or volatility screens.
- Both effects should concentrate where tail heat is high and decay as configuration information becomes cheap to observe.
- All claims are bounded by the scope condition: the discriminator exists only where disclosure is dense, such as coherent supply-chain and platform ecosystems.
Reading between the lines
- As an extension of the paper's mechanism, the same measurement could be applied to more frequent disclosures such as 8-K filings or earnings-call transcripts to sharpen the timing of the danger flag, which the annual filing grid currently blurs.
- If the slow-diffusion mechanism is right, the alpha from reading filings before the category error corrects should shrink over time as machine-readable extraction becomes widespread; this could be tested by estimating whether the interaction's predictive power declines across later vintages.
- The density-boundary finding suggests the discriminator may generalize beyond technology into other hub-centered ecosystems such as aerospace-defense primes and telecom infrastructure, where the replication map shows unexpected pockets of dense disclosure.
Editorial analysis
A structured set of objections, weighed in public.
Referee Report
Summary. The paper proposes separating heavy upper-tail return processes into "lottery tails" and "structural tails" using an LLM-extracted 10-K disclosure network. It defines a tail-heat signal from the Hill index and decomposes network rewiring into birth, death, and drift. The central empirical claim is a sign pattern: the interaction of tail heat with death mass predicts negative forward abnormal returns (crash side), while tail heat with birth mass or an intact network is where structural winners live. The pilot uses 24 technology firms (2014--2025) and reports a significant negative death-side interaction with descriptive, not confirmatory, status. A pre-registered replication on 50 random S&P 500 firms failed, with 83% of firm-vintages having zero death mass, which the paper interprets as a scope condition: the discriminator is only defined where firms densely document counterparties. The manuscript then presents a fully pre-specified confirmatory design with a density gate, a gatekept primary pair, archived power simulations, and pending audits, and it explicitly labels the alpha side as still unresolved.
Significance. If the mechanism is confirmed, the contribution is substantial: it would condition the MAX anomaly on an observable, text-measured network state and provide a crash-risk flag that return-based screens cannot produce. The paper is unusually careful in several ways: pilot results are labeled descriptive; the pre-registered replication failure is reported verbatim; inference includes wild-cluster bootstrap and leave-one-firm-out checks; and the confirmatory design freezes thresholds, winsorization, and power analyses before estimation. These features are real strengths and should be preserved. However, the current evidence for the central sign pattern rests on one pilot coefficient in a 24-firm convenience panel, the death-mass measurement is not yet validated for the specific quantity the interaction needs, and the abstract's risk-monitoring claim goes beyond what the pilot can support. The paper is best read as a credible, well-scoped research design with promising descriptive results, not as an established empirical finding.
major comments (4)
- [§4.2, Table 1, §6(i)] The death-side interaction is load-bearing, but the death mass D is measured with single-pass extraction and the cutoff-matched extractor audit is still pending. The executed recall audit (2 of 12 zero-edge filings gained edges under re-extraction) validates absent edges, not edge disappearances. Since D is computed from edge-weight decreases between vintages, an extraction false negative at the later vintage is algebraically indistinguishable from a real death. If extraction quality deteriorates when a firm is under stress, or when filing language changes, D will be spuriously elevated precisely in the periods where the interaction is claimed to matter. This is not a minor measurement concern; it is a plausible mechanical generator of the paper's headline interaction. The confirmatory stage must include an explicit "death recall" audit on a sample of edges present in one vintage and absent in the next, and the authors should report whether extraction false negatives are correlated with tail heat or with disclosure-language change. This audit should be completed before any claim of practical risk-monitoring utility is made.
- [§5.3, §5.5, §7] The evidential basis for the abstract's claim that the death-side signal is "immediately useful as a risk-monitoring danger flag" is one interaction coefficient in a 24-firm pilot (wild-cluster p = 0.04), with the leave-one-firm-out analysis showing that the coefficient roughly halves when NVIDIA is dropped. The pre-registered replication failed under its frozen criterion, and the dense-subset check inside the replication is explicitly uninformative (coefficient -0.001 with SE 0.057). The paper is honest about these facts, but Section 7 nevertheless asserts that the death-side flag "already meets the risk-pool standard on the pilot record." Given the failed replication and the pending extractor audit, this practical-readiness claim is not proportionate to the evidence. The revised manuscript should either weaken the risk-pool claim to a hypothesis-generation statement, or support it with an out-of-sample validation that does not rely on the pilot firms.
- [§6(d), §6(g)] The confirmatory P1 endpoint is powered using the pilot's collapsed coefficient (-0.028) as the effect-size anchor, and the archived simulation claims near-certain detection at magnitudes down to 0.010. But the pilot anchor is estimated on 200 firm-vintages with pooled standardizations, overlapping horizons, and a graph state that varies only annually. The design should specify how the firm-vintage collapsed regression will handle vintage overlap, staleness, and the panel-interior restriction acknowledged in Section 7, where deaths of counterparties outside the universe are unmeasured. Without such specifications, P1 may reproduce a partial-death-mass artifact rather than test the economic mechanism. I ask the authors to add explicit measurement-error language to the P1 specification and to the archived power simulation.
- [§3.2, Remark 3.1] The two-component tail decomposition in Definition 3.1 is definitional rather than identified from returns, and Proposition 3.2 is explicitly described as a pricing argument rather than a theorem. This is acceptable for hypothesis generation, but the paper should be more careful in the summary and abstract to distinguish the definitional decomposition from the empirical discriminability claim. As written, the abstract presents the decomposition as an established fact ("decomposes exactly into edge birth, death, and drift") when the exactness is only about the accounting identity; the economic claim that network state discriminates lottery from structural tails remains to be established.
minor comments (5)
- [Figure 3] The acronym LSG is used in the figure and caption but is not defined in the text; please define it at first use, and clarify whether it denotes total rewiring, birth mass, or a normalized graph-change statistic.
- [§5.3, Table 2] The collapsed regression omits momentum and volatility coefficients for space, and the MAX coefficient changes sign on collapsing. Since the collapsed regression is the stated honest unit of identification, please include the full coefficient table in an appendix or online supplement.
- [§5.3, §5.5] The pilot reports 73% of firm-vintages with D > 0 and the replication reports 83% with zero death mass; the two statements are consistent but easy to misread. Please state the pilot's zero-death share directly and use identical denominators in both sections.
- [§4.2] The companion protocol and its archived deviations are cited as "companion v0.5" and "arXiv:2607.15640," but no direct link to the archived hashes or to the deviation log is provided. Please include an availability statement with the archive location for the frozen prompts, the SHA-256 hash, and the v0.5 deviation log.
- [§5.2] Figure 1 would benefit from explicit shading of the 2018 and 2022 drawdown windows and a marked scale for the panel Q80 series, since the text refers to specific threshold-crossing months that are hard to read from the figure.
Circularity Check
No significant circularity: the central tail-heat × death-mass interaction is estimated on forward returns that are not used to construct the network, and the only self-citation is the companion measurement paper, which is not load-bearing for the pricing claim.
full rationale
Walking the derivation chain: tail heat is a trailing Hill/GPD estimate on past returns; the network birth/death/drift decomposition is computed from 10-K text via the companion pipeline; forward abnormal returns are constructed from subsequent returns and a trailing beta. The central interaction (ξ̂+×D) is therefore not definitionally equal to any input: D is not fitted to forward returns, and none of Eq. (1), Definition 3.1, or the pilot regressions calibrates the network state to the outcome it predicts. Proposition 3.2 is explicitly labeled a pricing argument that fixes signs ex ante, not a theorem about the data-generating process, and the hypotheses are tested on forward returns not used in graph construction. The only self-citation is the companion measurement paper (Yang and Zhang 2026) for the graph layer and for descriptive intensity evidence in Section 5.3; that evidence is not load-bearing for the central interaction, which is computed independently in this paper and benchmarked against MAX, momentum, and volatility screens. The paper also reports an adverse pre-registered replication (Section 5.5) and a completed recall audit with binding findings (Section 6(i)), both of which show the empirical claims are falsifiable rather than tautological. The pending cutoff-matched extractor audit and the recall-audit extraction failures are measurement-validity risks, not circularity: they concern whether D faithfully measures economic relationship dissolution, but they do not make the prediction equivalent to its inputs by construction. No load-bearing step reduces to its own inputs by definition or by self-citation. Score 1 reflects a minor, non-load-bearing self-citation of the companion measurement, consistent with the paper being otherwise self-contained against external benchmarks.
Assumptions & free parameters
free parameters (3)
- Hill tail estimation window and order statistics (W=504 days, k=26) =
W=504, k=26
- Primary forward return horizon =
h=6 months
- Winsorization bounds for forward abnormal returns =
1st and 99th percentiles
assumptions (5)
- standard math Daily excess returns have an upper tail in the maximum domain of attraction, so the Hill estimator is a valid tail index.
- domain assumption Investors with skewness preference discount observed tail heat (lottery demand).
- domain assumption Filing-text information diffuses slowly into stock prices.
- domain assumption The LLM-extracted graph is a valid point-in-time measurement of the firm's disclosed economic relationships.
- ad hoc to paper The two-component tail decomposition (lambda = lambda_L + lambda_S) is well-defined and the components can be discriminated by network state.
invented entities (2)
-
Structural tail (as opposed to lottery tail)
-
Disclosure-measured economic network state (edge births B, deaths D, drift C)
independent evidence
Cite this review
Pith. "Pith review of Extreme Value Alpha and Crash Risk: Separating Structural Tails from Lottery Tails with LLM-Extracted Disclosure Networks." pith.science (2026). https://pith.science/paper/C47G73EI
@misc{pith2026260809089,
  author       = {Pith},
  title        = {Pith review of: Extreme Value Alpha and Crash Risk: Separating Structural Tails from Lottery Tails with LLM-Extracted Disclosure Networks},
  year         = {2026},
  howpublished = {\url{https://pith.science/paper/C47G73EI}},
  note         = {Machine review of arXiv:2608.09089}
}
read the original abstract
A heavy upper tail in a stock's returns is ambiguous: it can be a lottery tail, transient jump risk that investors overpay for (the MAX discount), or a structural tail, the statistical shadow of an economic reconfiguration that precedes extreme winners. Returns alone cannot separate them, so tail heat alone is not an alpha signal. Our discriminator is the firm's disclosure-measured network: a directed, span-grounded graph from 10-K filings via an auditable LLM pipeline, whose rewiring decomposes into edge birth, death, and drift. The central sign pattern: tail heat with network death is the crash side; tail heat with an intact or forming network is where structural tails and historical winners live. Pilot evidence from 24 technology firms (2014-2025) supports the crash side: upper-tail heat interacted with death mass predicts negative forward abnormal returns (monthly t = -2.9; firm-vintage t = -3.9; wild-cluster p = 0.04; robust to two-way clustering and controls), and the same configuration preceded NVIDIA's 2018 and 2022 drawdowns. This death-side signal is immediately useful as a risk-monitoring danger flag. The alpha side is directionally positive but not significant in the pilot and awaits the confirmatory test. A pre-registered replication on 50 random S&P 500 firms failed, defining the boundary: outside coherent ecosystems the disclosure graph nearly vanishes (83% of firm-vintages have zero death mass), so the discriminator exists only where firms densely document counterparties. The confirmatory design is fully pre-specified, with a gatekept primary pair, archived power simulations, positive-only winner labels, selection-corrected benchmarks, and a frozen ecosystem-coherent universe with a density gate; it activates only if the gate passes. If confirmed, tail heat becomes a conditional signal separating crash risk from structural winners.
Figures


Figures from the paper (2 more)

Reference graph
Works this paper leans on
-
[1]
Bali, T. G., N. Cakici, and R. F. Whitelaw (2011). Maxing out: Stocks as lotteries and the cross-section of expected returns.Journal of Financial Economics99(2), 427–446
work page 2011
- [2]
-
[3]
Barberis, N., and M. Huang (2008). Stocks as lotteries: The implications of probability weighting for security prices.American Economic Review98(5), 2066–2100
work page 2008
-
[4]
Chavez-Demoulin, V., and A. C. Davison (2005). Generalized additive modelling of sample extremes.Journal of the Royal Statistical Society: Series C54(1), 207–222
work page 2005
-
[5]
Chen, J., H. Hong, and J. C. Stein (2001). Forecasting crashes: Trading volume, past returns, and conditional skewness in stock prices.Journal of Financial Economics61(3), 345–381
work page 2001
-
[6]
Cohen, L., and A. Frazzini (2008). Economic links and predictable returns.Journal of Finance 63(4), 1977–2011
work page 2008
-
[7]
Cohen, L., C. Malloy, and Q. Nguyen (2020). Lazy prices.Journal of Finance75(3), 1371–1415
work page 2020
- [8]
Show all 16 references
-
[9]
Phillips (2016)
Hoberg, G., and G. Phillips (2016). Text-based network industries and endogenous product differentiation.Journal of Political Economy124(5), 1423–1465
2016
-
[10]
Hutton, A. P., A. J. Marcus, and H. Tehranian (2009). Opaque financial reports, R2, and crash risk.Journal of Financial Economics94(1), 67–86
2009
-
[11]
Ke, Z. T., B. T. Kelly, and D. Xiu (2020). Predicting returns with text data. Working paper, NBER No. 26186
2020
-
[12]
Jiang (2014)
Kelly, B., and H. Jiang (2014). Tail risk and asset prices.Review of Financial Studies27(10), 2841–2871
2014
-
[13]
Tang (2023)
Lopez-Lira, A., and Y. Tang (2023). Can ChatGPT forecast stock price movements? Return predictability and large language models. Working paper, arXiv:2304.07619
2023
-
[14]
J., and R
McNeil, A. J., and R. Frey (2000). Estimation of tail-related risk measures for heteroscedastic financial time series: An extreme value approach.Journal of Empirical Finance7(3–4), 271–300
2000
-
[15]
Pickands, J. (1975). Statistical inference using extreme order statistics.Annals of Statistics3(1), 119–131
1975
-
[16]
Zhang (2026)
Yang, F., and L. Zhang (2026). LLM latent edge measurement: Point-in-time economic graphs for quantitative investing from corporate disclosures. Working paper, arXiv:2607.15640. 19
2026 arXiv
Reviewed August 11, 2026 · model on record in the stance chip above.
Discussion (0). Continue with ORCID to comment.