REVIEW 4 major objections 5 minor 12 references
An examination of large-scale galactic effects on molecular cloud properties in NGC 628 : The significant impact of tidal effects from neighboring material on the evolution of molecular clouds
T0 review · 4 major / 5 minor · reviewed 2026-08-10 · deepseek-v4-flash
Pith's one-line read In NGC 628, the tidal pull of neighboring gas and stars—not galactic rotation—sets the density contrast of molecular clouds and suppresses star formation in the galaxy's center.
desk verdict A careful, transparent case study that overclaims a causal tidal effect from a radial trend match, but the method and data work are worth refereeing. read the letter →
The pith
A machine-rendered reading of the paper's core claim, the machinery that carries it, and where it could break.
The reading
What carries the argument
The argument rests on two complementary tidal estimators plus the density contrast itself. The density contrast $C$ is the ratio of hub to surrounding diffuse-gas density in hub-filament structures, identified from the PHANGS-ALMA CO(2-1) map. The tidal tensor analysis computes the gravitational potential from a surface density map in Fourier space (using the thin-layer formula from Gong & Ostriker 2011) and takes its Hessian; the eigenvalues decompose external from internal tides. The pixel-by-pixel computation directly sums the tidal acceleration per unit distance from every nearby pixel of external material using $T \approx 2 G m / R'^3$, with scalar and vector superpositions, and shows that material beyond four effective cloud radii contributes negligibly. Both methods are applied to a total baryonic surface density map that combines molecular gas, atomic gas, and stellar mass (dominated by stars), which is essential because the stellar component produces the central tidal peak.
What would settle it
Recompute the high-to-low density-contrast ratio using only clouds detected above a fixed signal-to-noise threshold in the full PHANGS-ALMA map, or from a higher-resolution CO map, and check whether the ratio still flattens beyond 4 kpc; if it rises instead, the central correlation with tidal strength fails. Alternatively, in a galaxy with a uniform stellar distribution, the prediction is no radial trend in density contrast, which is testable with existing PHANGS data.
Extended reading notes
Core claim
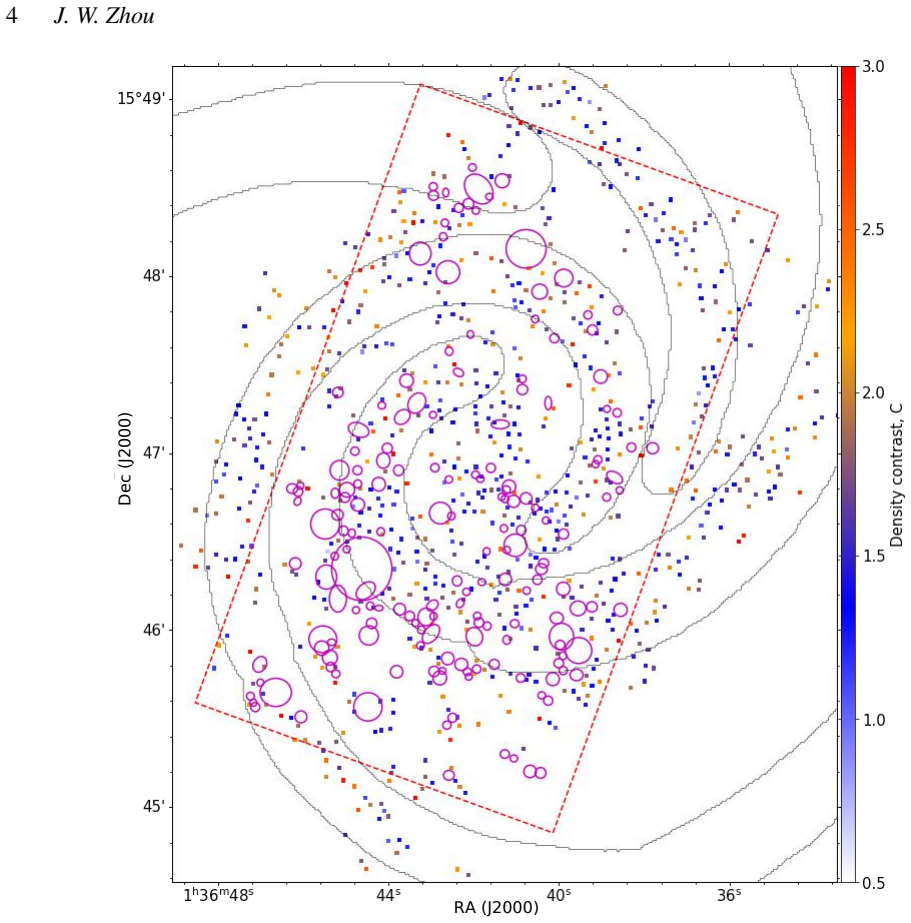
The central discovery is that the radial variation of molecular-cloud density contrast in NGC 628 is set by the tidal field of the surrounding baryonic material, not by the large-scale galactic potential. Using the hub-filament decomposition of Zhou et al. (2024a), the paper defines density contrast $C$ as the ratio of hub to surrounding diffuse gas and classifies clouds into high- and low-density contrast groups. The proportion of high- to low-density contrast clouds increases with galactocentric radius $R_G$ until about 3–4 kpc and then remains stable, while shear and rotation-curve tidal strength decrease monotonically and thus cannot explain the plateau. In contrast, tidal strengths computed pixel-by-pixel from the combined CO, HI, and stellar mass surface density maps, using the point-mass approximation $T \approx 2 G M' / R'^3$, decrease with $R_G$ for $R_G < 4$ kpc and stay constant beyond, matching the density-contrast trend. The paper concludes that strong tidal forces from neighboring material in the galactic center prevent molecular clouds from developing high density contrasts, and that this is a key reason for the low star formation rate in NGC 628's center.
Load-bearing premise
The load-bearing assumption is that the measured radial trend in the ratio of high- to low-density-contrast clouds is a real physical trend and not a completeness artifact of cloud detection or contrast measurement that varies with galactocentric radius.
Editorial extensions
If this is right
- If local tidal effects govern density contrast, then the low star formation rates observed in many galactic centers may be caused by gravitational confinement by neighboring material rather than by gas exhaustion or feedback alone.
- Shear and rotation-curve tides can be safely neglected as dominant cloud-shaping mechanisms in NGC 628, simplifying models of cloud evolution there.
- The tidal influence of neighboring material is negligible beyond about four effective cloud radii, so local, not global, mass distribution sets each cloud's tidal environment.
- The same tidal suppression may explain why observed velocity gradients of collapsing structures (slope ≈ −0.9) are shallower than the free-fall prediction (−1.5), as the paper notes for NGC 628 and similar galaxies.
Reading between the lines
- A natural test would be to apply the pixel-by-pixel tidal computation to other PHANGS galaxies with complete cloud catalogs; if the density-contrast–tidal-strength correlation holds across galaxies with different central mass concentrations, the mechanism is general.
- The paper's own completeness caveat means the flat outer trend ($R_G > 4$ kpc) is the least secure part of the match; a completeness-corrected cloud catalog would determine whether the plateau is physical.
- If the mechanism is general, galaxies with a shallow or flat baryonic surface-density profile should show little radial variation in cloud density contrast, while galaxies with strong central concentrations should show a pronounced central deficit of high-contrast clouds.
Editorial analysis
A structured set of objections, weighed in public.
Referee Report
Summary. The paper studies what sets the density contrast of molecular clouds in the spiral galaxy NGC 628, using PHANGS-ALMA CO(2-1), THINGS HI, and Spitzer 3.6 micron data. It classifies clouds from a previous hub-filament decomposition by their density contrast relative to the median value C=1.63, tabulates the ratio of high- to low-density-contrast clouds as a function of galactocentric radius, and reports that this ratio rises to about 4 kpc and then flattens. It argues that spiral arms, bubbles, and magnetic fields do not explain the trend, that galactic shear is negligible, and that rotation-curve tides decrease monotonically with radius and therefore also do not match. The paper then computes tidal strengths from the observed surface density maps using both tidal-tensor analysis and a pixel-by-pixel scalar/vector superposition of point-mass tidal accelerations. When the total baryonic map (molecular gas, atomic gas, and stars) is used, the pixel-by-pixel tidal strength declines inside 4 kpc and flattens beyond, which the authors claim aligns with the cloud density-contrast ratio. They conclude that tidal effects from neighboring material significantly influence cloud density contrast and that strong central tides suppress gravitational collapse, contributing to the low star formation rate in the galactic center.
Significance. If the central claim is established, the paper would provide an observationally grounded mechanism linking galactic environment to molecular cloud evolution and to the suppressed star formation in galactic centers. The study has clear strengths: the computations are transparent and reproducible from public data; the authors test several tidal estimators and explicitly report their degeneracies; and their conclusion is falsifiable through cloud-by-cloud tests. The main weakness is that the causal inference rests on a qualitative alignment of two radially averaged trends, without error bars, significance tests, radius control, or a cloud-by-cloud regression. The manuscript is therefore a promising and honest case study, but it does not yet deliver the quantitative evidence needed to support the strong causal conclusion in the abstract and Section 4.
major comments (4)
- [Sec. 3.1, Table 1] The completeness caveat is load-bearing. The paper states that only rings with RG <= 4 kpc are complete, yet Table 1 lists ratios for 4-5, 5-6, and 6-7 kpc bins, with the outermost bin containing only 20 high- and 18 low-density-contrast clouds. The reported plateau beyond 4 kpc therefore rests on small, potentially incomplete samples, and no Poisson or selection uncertainties are given. Because the claimed match with the tidal trend in Fig. 9(b) uses the flat outer part, the conclusion would be undermined if the outer ratios are biased by completeness or by small-number fluctuations. I request completeness corrections or a restriction of the main claim to RG <= 4 kpc, together with error bars on all reported ratios.
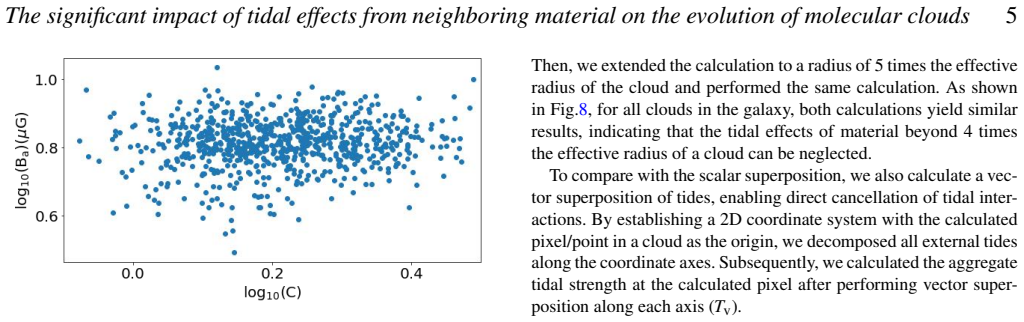
- [Sec. 3.5.2, Fig. 9(b)] The central inference is a qualitative alignment between two radial trends: the cloud density-contrast ratio in Table 1 and the pixel-by-pixel tidal strength from the total baryonic map. No quantitative measure of agreement is reported, and both quantities vary with RG, so the match may reflect a common radial driver (e.g., higher stellar/gas surface density and pressure in the center) rather than a tidal mechanism. Moreover, among several tidal estimators, the pixel-by-pixel one was selected after the comparison was made, so the match is not a pre-specified prediction. To support a causal claim, the paper should present a cloud-by-cloud analysis of density contrast against tidal strength at fixed RG, or at least a partial correlation controlling for surface density and other local gas properties, and it should show that the conclusion is robust to the choice of tidal estimator.
- [Sec. 3.4.2, Eq. (8), Sec. 3.5.4] The manuscript acknowledges that the pixel-by-pixel 2D computation overestimates tidal strength because it underestimates distances, and that this method cannot provide a correct magnitude estimate. Yet the physical conclusion that tides 'hinder gravitational collapse' in the center requires a comparison of tidal energy with the cloud's self-gravity (Eg). The energy comparison in Fig. 6 is made for the CO-based tidal tensor, not for the total baryonic map used to establish the main radial trend. Please show, for the total map, whether Tmax,tot and Tv,tot yield energies comparable to Eg, and whether the conclusion survives if the acknowledged 2D overestimate is corrected.
- [Sec. 3.2] The paper dismisses spiral arms, bubbles, and magnetic fields as drivers of the density-contrast variation based on visual inspection of Fig. 2 and a rough average in Fig. 3. These are the main alternative mechanisms, so the exclusion should be quantified, for example with two-sample tests of density contrast inside versus outside arms, correlation coefficients with magnetic field strength and their significance, and a comparison of cloud properties near and away from bubbles. The current evidence is too weak to support the strong statement that these factors are 'not responsible' for the radial trend.
minor comments (5)
- [Section 1] NGC 628 is called 'M47' in the first paragraph of the Introduction but 'M74' elsewhere; the correct designation is M74.
- [Sec. 3.1] The statement that high- and low-density-contrast clouds are 'relatively uniform within each ring' is not supported by any figure or statistic in the text; please point to the relevant map or add a quantification.
- [Eq. (3)] Please specify whether R in the finite-difference approximation is the cloud effective radius and how V(RG +/- R) is evaluated from the analytic rotation curve in Eq. (4); the current notation is ambiguous.
- [Table 1] Please add the number of clouds in each bin and the Poisson or confidence intervals for the proportions, and state the radial bin widths consistently.
- [Figures 5 and 9] In panels (b) and (d), the RG ≈ 4 kpc boundary discussed in the text is not marked; adding a vertical line would help the reader verify the claimed change in trend.
Circularity Check
No circular derivation: tidal strengths are computed directly from observed surface density maps, not fitted to the cloud density-contrast ratios.
full rationale
The paper's central claim is that the radial trend in the ratio of high- to low-density-contrast clouds (Table 1) aligns with the radial trend of pixel-by-pixel tidal strengths computed from the total baryonic surface density map (Fig. 9b). The tidal strengths are direct calculations from observed CO, HI, and 3.6 micron maps using Eq. 8 for point-mass tidal acceleration, with no parameter fitted to the density-contrast data. The cloud density contrast C comes from a separate decomposition of the CO map (Zhou et al. 2024a) and is not an input to the tidal calculation; the tidal calculation explicitly excludes the cloud's own mass by masking it out. Thus the comparison is between two independent measurements, and the conclusion is an interpretation of a correlation, not a reduction of the prediction to its inputs. The self-citations provide the cloud catalog, density-contrast definitions, and tidal-tensor decomposition, but these are published observational products and mathematical methods, not the conclusion itself; the main tidal trend used for the claim is from the original pixel-by-pixel computation. The paper itself flags limitations—only rings within 4 kpc are complete, the 2D computation overestimates magnitudes, and it is 'merely a case study'—which concern sample completeness and external validity, not circular reasoning. No equation in the paper defines the density-contrast ratio in terms of tidal strength or fits tidal parameters to the ratio, so no circular step can be exhibited with the precision required by the review rules.
Assumptions & free parameters
free parameters (4)
- Galaxy half-thickness H =
0 pc and 50 pc
- Stellar mass-to-light ratio at 3.4 um =
0.5 M_sun/L_sun
- Tidal cutoff radius =
4 effective radii, with 5 for check
- Density contrast threshold =
C = 1.63
assumptions (6)
- domain assumption The 2D Fourier potential of a thin layer (Eq. 6) approximates the galactic gravitational potential.
- domain assumption External tidal strengths can be estimated from eigenvalues of the 2D tidal tensor as T_d1 = lambda1, T_d2 = lambda2, T_d3 = (lambda2 - lambda1)/2.
- domain assumption The cloud mask and density contrast catalog from Zhou et al. 2024a are complete and reliable within each ring.
- domain assumption Each pixel of the surface density map can be treated as a point mass in Eq. 8 for the pixel-by-pixel tidal computation.
- domain assumption The 2D tidal field with H = 0 roughly represents the real 3D tidal field.
- ad hoc to paper Radial trend matching is sufficient evidence for a causal influence of tides on density contrast.
Cite this review
Pith. "Pith review of An examination of large-scale galactic effects on molecular cloud properties in NGC 628 : The significant impact of tidal effects from neighboring material on the evolution of molecular clouds." pith.science (2026). https://pith.science/paper/4S56ATRZ
@misc{pith2026250118249,
  author       = {Pith},
  title        = {Pith review of: An examination of large-scale galactic effects on molecular cloud properties in NGC 628 : The significant impact of tidal effects from neighboring material on the evolution of molecular clouds},
  year         = {2026},
  howpublished = {\url{https://pith.science/paper/4S56ATRZ}},
  note         = {Machine review of arXiv:2501.18249}
}
abstract
The physical factors that influence the development of molecular cloud's density contrast are connected to those that affect star formation in the galaxy. For NGC 628 (M74), the proportion of high- and low-density contrast clouds initially increases with the distance to the galactic center ($R_{G}$) and then keeps relatively stable. Spiral arms, bubbles and magnetic fields are not responsible for the variations in density contrast observed among molecular clouds. The effects of shear and tides calculated from the galactic rotation curve consistently decrease as $R_{G}$ increases, and the shear effect can be neglected. We further studied the tidal effects of the neighboring material on each cloud using the tidal tensor analysis and the pixel-by-pixel computation, after combining molecular gas, atomic gas and stellar mass surface density maps. When $R_{\rm G} <$ 4 kpc, the tidal strengths derived from the pixel-by-pixel computation decrease as $R_{\rm G}$ increases, and then remains relatively constant when $R_{\rm G} >$ 4 kpc. This aligns well with the dependence of the proportion of high- and low-density contrast clouds on $R_{\rm G}$. Therefore, the tidal effects of neighboring material have a significant impact on the development of molecular cloud's density contrast. A key factor contributing to the low star formation rate in the galactic center is the excessive tidal influences from neighboring material on molecular clouds, which hinder the gravitational collapse within these clouds, resulting in low density contrasts. The tidal effects from neighboring material may also be a significant contributing factor to the slowing down of a pure free-fall gravitational collapse for gas structures on galaxy-cloud scales revealed in our previous works by velocity gradient measurements.
Figures

Figures from the paper (6 more)


Reference graph
Works this paper leans on
-
[1]
Aouad, C. J., James, P. A., & Chilingarian, I. V . 2020, MNRAS, 496, 5211, doi: 10.1093/mnras/staa1945 Ballesteros-Paredes, J., Gómez, G. C., Loinard, L., Torres, R. M., & Pichardo, B. 2009, MNRAS, 395, L81, doi: 10.1111/j. 1745-3933.2009.00647.x Barnes, A. T., Chandar, R., Kreckel, K., et al. 2022, A&A, 662, L6, doi:10. 1051/0004-6361/202243766 Beck, R.,...
arXiv 2020
-
[3]
1093/mnrasl/slad104 Hughes, A., Meidt, S. E., Colombo, D., et al. 2013, ApJ, 779, 46, doi:
work page 2013
-
[4]
1088/0004-637X/779/1/46 Hunter, D. A., Elmegreen, B. G., & Baker, A. L. 1998, ApJ, 493, 595, doi: 10.1086/305158 Ibáñez-Mejía, J. C., Mac Low, M.-M., & Klessen, R. S. 2022, ApJ, 925, 196, doi: 10.3847/1538-4357/ac3b58 Jeffreson, S. M. R., Kruijssen, J. M. D., Keller, B. W., Chevance, M., & Glover, S. C. O. 2020, MNRAS, 498, 385, doi: 10.1093/mnras/ staa21...
-
[5]
K., Schinnerer, E., Hughes, A., et al
3847/1538-4357/ab9953 Leroy, A. K., Schinnerer, E., Hughes, A., et al. 2021a, ApJS, 257, 43, doi: 10.3847/1538-4365/ac17f3 Leroy, A. K., Hughes, A., Liu, D., et al. 2021b, ApJS, 255, 19, doi:
-
[6]
2011, Nature, 479, 499, doi: 10.1038/ nature10551 Liu, L., Bureau, M., Blitz, L., et al
3847/1538-4365/abec80 Li, H.-B., & Henning, T. 2011, Nature, 479, 499, doi: 10.1038/ nature10551 Liu, L., Bureau, M., Blitz, L., et al. 2021, MNRAS, 505, 4048, doi:
work page 2011
-
[7]
E., Schinnerer, E., García-Burillo, S., et al
1093/mnras/stab1537 Meidt, S. E., Schinnerer, E., García-Burillo, S., et al. 2013, ApJ, 779, 45, doi: 10.1088/0004-637X/779/1/45 Meidt, S. E., Glover, S. C. O., Kruijssen, J. M. D., et al. 2020, ApJ, 892, 73, doi: 10.3847/1538-4357/ab7000 Miville-Deschênes, M.-A., Murray, N., & Lee, E. J. 2017, ApJ, 834, 57, doi: 10.3847/1538-4357/834/1/57 Mulcahy, D. D.,...
-
[8]
1051/0004-6361/201629907 Pessa, I., Schinnerer, E., Leroy, A. K., et al. 2022, A&A, 663, A61, doi:10. 1051/0004-6361/202142832 Querejeta, M., Schinnerer, E., Meidt, S., et al. 2021, A&A, 656, A133, doi: 10.1051/0004-6361/202140695 Querejeta, M., Leroy, A. K., Meidt, S. E., et al. 2024, A&A, 687, A293, doi: 10.1051/0004-6361/202449733 Ramírez-Galeano, L., ...
-
[9]
3847/1538-3881/ac74bd Tasker, E. J., & Tan, J. C. 2009, ApJ, 700, 358, doi: 10.1088/ 0004-637X/700/1/358 Thilliez, E., Maddison, S. T., Hughes, A., & Wong, T. 2014, Publ. Astron. Soc. Australia, 31, e003, doi: 10.1017/pasa.2013.40 Utreras, J., Blanc, G. A., Escala, A., et al. 2020, ApJ, 892, 94, doi:
Show all 12 references
-
[10]
1088/0004-637X/784/1/3 Cox, D. P. 2005, ARA&A, 43, 337, doi: 10.1146/annurev.astro. 43.072103.150615 Crutcher, R. M. 2012, ARA&A, 50, 29, doi: 10.1146/ annurev-astro-081811-125514 Dale, D. A., Smith, J. D. T., Schlawin, E. A., et al. 2009, ApJ, 693, 1821, doi: 10.1088/0004-637...
2005 arXiv
- [11]
-
[12]
2023, MNRAS, 519, 2391, doi:
1051/0004-6361/202449514 Zhou, J.-W., Li, S., Liu, H.-L., et al. 2023, MNRAS, 519, 2391, doi:
2023
-
[13]
1093/mnras/stac3559 MNRAS 000, 000–000 (2024) 10 J. W. Zhou APPENDIX A: SUPPLEMENTARY MAPS MNRAS 000, 000–000 (2024) The significant impact of tidal effects from neighboring material on the evolution of molecular clouds 11 RA (J2000) Dec (J2000) Figure A1. Different components...
2024
Reviewed August 10, 2026 · model on record in the stance chip above.
Discussion (0). Continue with ORCID to comment.