REVIEW 3 major objections 6 minor 1 cited by
Diverse pathways for supermassive black hole-galaxy coevolution
T0 review · 3 major / 6 minor · reviewed 2026-08-12 · deepseek-v4-flash
Pith's one-line read The paper finds that the most massive supermassive black holes in the local universe assembled most of their mass before redshift z=2, while lower-mass black holes grew gradually between z=0 and z=2.
desk verdict Useful empirical reconstruction of SMBH growth histories, but the headline result is conditional on an untested Mstar-normalized accretion prescription. read the letter →
The pith
A machine-rendered reading of the paper's core claim, the machinery that carries it, and where it could break.
The reading
What carries the argument
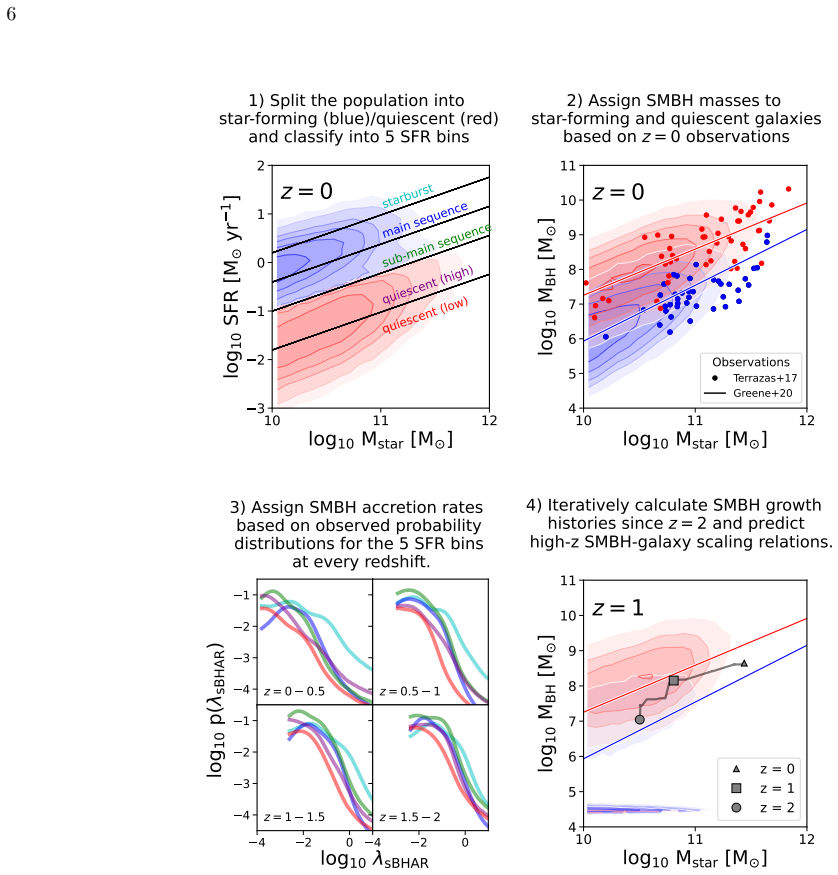
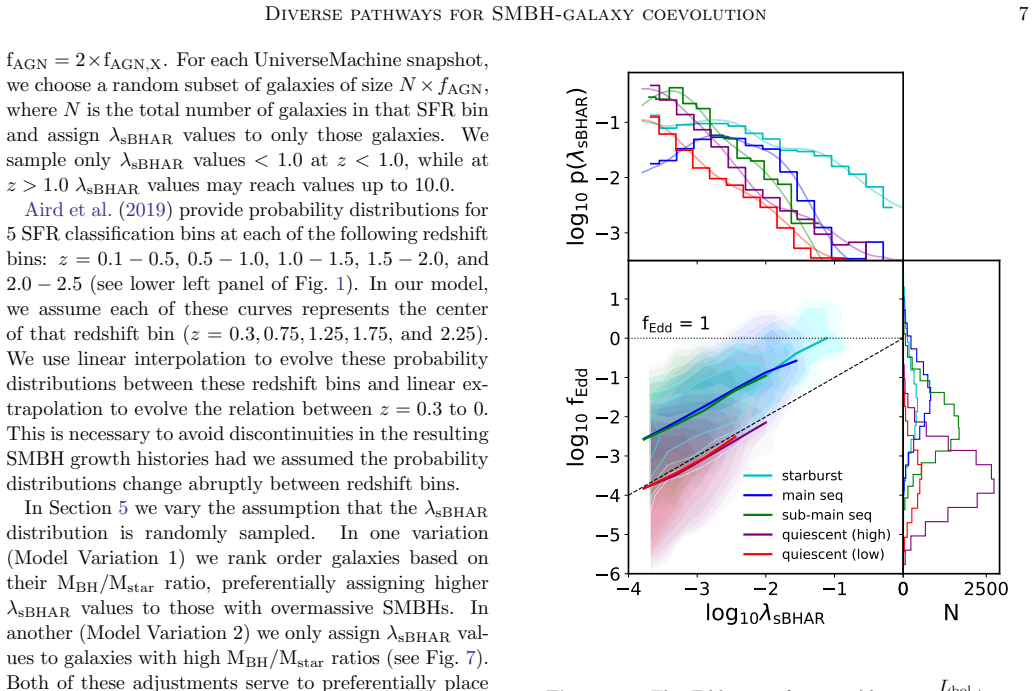
The engine is a backward-time empirical growth model. Starting from z=0, each galaxy in a dark-matter-based empirical galaxy-formation model is assigned a black hole mass from one of two observed $M_\mathrm{BH}$–$M_\mathrm{star}$ relations (quiescent hosts get more massive black holes; scatter 0.65 dex). At every $\sim0.1$ Gyr step back to z=2, the model samples a specific black hole accretion rate ($\lambda_\mathrm{sBHAR}$, the ratio $L_\mathrm{bol}/(1.3\times10^{38}\,\mathrm{erg\,s^{-1}}\times0.002\,M_\mathrm{star}/M_\odot)$) from observed probability distributions binned by distance from the star-forming main sequence, multiplies by two to account for obscured active nuclei, converts the sampled luminosity to a mass accretion rate via $\dot{M}_\mathrm{BH}=(1-\eta)L_\mathrm{bol}/(\eta c^2)$ with $\eta=0.1$, and subtracts that mass from the descendant, apportioning mergers by stellar-mass ratio. The sBHAR distributions plus the z=0 boundary relations are what carry the conclusion: the observed late-time accretion budget is simply too small, relative to their masses, to have built the high-mass end after z=2.
What would settle it
Measure the black hole masses of a representative sample of massive ($M_\mathrm{star}\gtrsim10^{11}\,M_\odot$) quiescent galaxies at z≈2 using dynamical tracers such as ALMA molecular-gas kinematics or JWST IFU stellar kinematics. If typical masses come out well below $10^9\,M_\odot$, the local high-mass population must have grown substantially after z=2, contradicting the paper's central claim; if they already cluster near $10^9$–$10^{10}\,M_\odot$, the early-assembly conclusion is supported.
Extended reading notes
Core claim
The paper's central discovery is that SMBH assembly is not a single process but is split by mass and star-formation phase. Working backward from the observed z=0 relations, the authors show that the most massive black holes found today — roughly above $10^8\,M_\odot$ — cannot be grown with the accretion rates observed at $z<2$, even when the model is deliberately biased to dump all available accretion onto the most overmassive black holes. Their growth tracks on the $M_\mathrm{BH}$–$M_\mathrm{star}$ plane are flat, meaning stellar mass grows around an already-built black hole. In contrast, lower-mass SMBHs show steep vertical tracks: their entire z=0 mass can be accrued after z=2. The unavoidable consequence is that the $M_\mathrm{BH}$–$M_\mathrm{star}$ relation evolves with redshift, shifting to higher normalization and a shallower slope by z=2, and that the high-redshift relation is dominated by the progenitors of today's quiescent galaxies.
Load-bearing premise
The load-bearing premise is that the factor-of-two correction for black holes hidden from X-ray surveys is accurate — hidden active galaxies are assumed to have the same accretion-rate distribution and live in the same host galaxy types as the X-ray-selected ones — because if hidden accretion is concentrated in the most massive quiet galaxies, the biggest black holes could have grown substantially after z=2.
Editorial extensions
If this is right
- The high-mass end of the local SMBH population was essentially in place by z=2; successful galaxy-formation models must therefore produce $>10^8\,M_\odot$ black holes before cosmic noon, either through rapid early accretion or heavy seeds.
- The $M_\mathrm{BH}$–$M_\mathrm{star}$ relation evolves with redshift: by z=2 it has a higher normalization and a shallower slope, and for $M_\mathrm{star}>10^{10}\,M_\odot$ it is populated almost entirely by the ancestors of today's quiescent galaxies.
- The substantial scatter in the z=0 relation is physically informative; models that assume a single tight $M_\mathrm{BH}$–$M_\mathrm{star}$ relation will miss the diversity of coevolutionary trajectories and under-predict the range of black hole masses at fixed stellar mass at high redshift.
- A significant fraction of low-mass SMBHs (26% of $M_\mathrm{star}>10^{10}\,M_\odot$ galaxies have zero implied black hole mass at z=2 in the fiducial model) have z=0 masses that can be fully explained by z=0–2 accretion, implying ongoing late-time black hole seeding and growth.
- Most SMBH mass growth in the model occurs in main-sequence and sub-main-sequence galaxies, with the relatively quiescent phase contributing more total growth than starbursts; this matches X-ray measurements of the declining accretion rate density toward z=0.
Reading between the lines
- If the early-assembly claim is right, dynamical mass measurements of a representative sample of massive quiescent galaxies at z≈2 should already find black holes near $10^9$–$10^{10}\,M_\odot$; the current AGN-selected samples cannot test this because they favor accreting, lower-mass systems.
- The factor-of-two obscured-AGN correction is the least constrained input; testing it with mid-infrared or radio AGN selection in massive quiescent galaxies would reveal whether hidden accretion could have grown the high-mass end after z=2, which would weaken the central conclusion.
- The model's population of galaxies with zero reconstructed black hole mass at z=2 suggests that entirely new black holes can form at late times; a targeted search for low-mass active black holes in $z\sim1$–2 star-forming galaxies would test whether this late-seeding channel is real.
- Because the empirical construction has few physical priors, re-running it with updated accretion-rate distributions from deeper X-ray surveys is a direct route to seeing whether the flat high-mass tracks persist.
Editorial analysis
A structured set of objections, weighed in public.
Referee Report
Summary. The paper presents an empirical, post-processing model for SMBH-galaxy coevolution. Using UniverseMachine galaxy catalogs, the authors assign z=0 SMBH masses from the Greene et al. (2020) scaling relations for quiescent and star-forming galaxies, then assign specific accretion rates by randomly sampling the Aird et al. (2019) sBHAR probability distributions in SFR bins at each snapshot, and integrate the growth histories backward in time to z=2. The main findings are that the most massive z=0 SMBHs grow very little of their mass between z=0 and z=2, implying early assembly; lower-mass SMBHs grow more gradually; the MBH-Mstar relation evolves toward higher normalization and shallower slope with redshift; and the scatter in the z=0 relation maps onto diverse growth pathways. Four model variations are presented to test alternative assignments of accretion rates and z=0 boundary conditions.
Significance. If the central conclusion is robust, the paper provides an observationally grounded constraint on SMBH assembly that connects local scaling relations to high-redshift JWST discoveries of overmassive black holes. The framework is transparent and computationally inexpensive, and the paper is explicit that the z=0 relations and sBHAR distributions are reproduced by construction, with the high-z predictions being genuine outputs. The use of observational probability distributions rather than ad hoc subgrid physics is a strength, as is the systematic exploration of model variations. However, the headline result depends on an untested degeneracy in the accretion-rate normalization, so the significance is conditional on whether that degeneracy is resolved.
major comments (3)
- [§2.4.2, Eq. (1), Eq. (7)] The central claim that the most massive z=0 SMBHs grew little since z=2 is partly baked into the accretion-rate normalization. In Eq. (1), λ_sBHAR is defined relative to 0.002 Mstar, so for a sampled λ_sBHAR the luminosity, and hence Ṁ_BH in Eq. (7), scales with Mstar. Because the λ_sBHAR probability distributions are sampled independently of MBH, the model imposes Ṁ_BH ∝ Mstar and therefore a fractional growth rate Ṁ_BH/MBH ∝ Mstar/MBH. The galaxies identified as overmassive at z=0 are exactly those with high MBH/Mstar, so their suppressed late growth is a direct consequence of the choice to tie absolute accretion to Mstar rather than to MBH. The observed Aird et al. (2019) constraints are on p(λ_sBHAR), not on p(fEdd); the mapping between the two involves the (evolving) MBH/Mstar distribution, so the same data may be consistent with Eddington-normalized growth that gives overmassive SMBHs substantially more late-time accretion. Model Variations 1 and 2 (§5) only re-rank which galaxies receive the same λ_sBHAR values and leave the Mstar scaling of Ṁ_BH unchanged, so they cannot test this degeneracy. The f0 ≈ 26% population at z=2, whose entire z=0 mass is removed when integrating backward, is a symptom of this choice: low-MBH/Mstar galaxies are assigned effective Eddington ratios far above unity by construction. I request a model variation that instead samples an Eddington-ratio distribution (e.g., using p(λ_sBHAR) with a fixed MBH/Mstar only to derive p(fEdd), then assigning Ṁ_BH ∝ MBH fEdd) to determine whether the early-assembly conclusion survives an alternative, equally plausible normalization.
- [§2.4.2, §7.4] The factor-of-two correction for obscured AGN, f_AGN = 2 f_AGN,X, assumes the hidden population has the same sBHAR distribution and occupies the same SFR bins as X-ray-selected AGN. This assumption is load-bearing for the conclusion about massive SMBHs: if obscured accretion is preferentially hosted by massive, quiescent (high) galaxies or has a different λ_sBHAR distribution, the total growth assigned to the most massive SMBHs could increase substantially. The caveat in §7.4 is appropriately explicit, but the paper does not quantify the effect. I suggest adding an extreme model variation that concentrates the factor-of-two hidden population in the quiescent (high) bin or in the highest-MBH/Mstar galaxies, to show the claimed early assembly is not sensitive to this correction.
- [§7.4, Fig. 5] The individual growth histories that motivate the 'diverse pathways' conclusion are built on UniverseMachine star formation histories that the authors state are bursty, with ~97% of galaxies switching between star-forming and quiescent classifications multiple times between z=0 and z=2. While coloring by z=0 classification in Fig. 4 mitigates the population mixing, the individual tracks in Fig. 5 still use these unphysical SFHs, so the specific diversity of coevolutionary pathways is not robustly established at the level of individual galaxies. The authors should either test the diversity claim with smoothed or physically motivated SFHs, or explicitly restrict it to ensemble properties.
minor comments (6)
- [§1] There is a typo in the Introduction: 'distrubiton' should be 'distribution'.
- [§8] In the Conclusions, 'has shown this approach to be a provide a powerful tool' is ungrammatical; it should read 'has shown this approach to provide a powerful tool'.
- [§8] The phrase 'serves as a complimentary approach' should be 'complementary approach'.
- [§5, Fig. 9] The caption for Fig. 9 says 'similar to Figure 9', which should likely refer to Fig. 4 or another appropriate figure.
- [§5, Fig. 5 caption] The sentence 'The black circles are the initial (M_BH, M_star) values that these galaxies have at z=0 before tracking their growth histories backwards in time to lower masses' is confusing because the tracks start at z=0; please rephrase to clarify that the circles mark the z=0 endpoints from which the histories are integrated backward.
- [§2.4.2] The truncation of λ_sBHAR sampling to values < 1.0 at z < 1.0 and < 10.0 at z > 1.0 is stated without justification; since the Aird et al. distributions extend beyond these limits, the authors should quantify the resulting bias or explain why the truncation is negligible.
Circularity Check
Mstar-normalized sBHAR prescription partially encodes the headline result; the rest of the paper is transparent about its by-construction inputs.
-
self definitional
[Sec. 2.2 Eq. (1); Sec. 2.4.3 Eqs. (7)-(8); Fig. 2 caption; Secs. 5, 7.3]
"The calculated L bol values are directly proportional to Mstar, meaning more massive galaxies will host SMBHs with higher L bol for the same λsBHAR. ... The systematic offset in fEdd between quiescent and star-forming galaxies is due to the initial conditions that assign quiescent galaxies more massive SMBHs, and therefore systematically lower Eddington fractions, than star-forming galaxies."
Eq. (1) defines λ_sBHAR with Lbol normalized by 0.002 Mstar, so Lbol ∝ Mstar. Eq. (7) then makes Mdot_BH ∝ Lbol ∝ Mstar, independent of MBH, and Eq. (8) makes the fractional growth Mdot_BH/MBH ∝ Mstar/MBH. The z=0 boundary (Eq. 2) assigns the most massive BHs to quiescent galaxies with high MBH/Mstar, so their Eddington ratios and fractional growth rates are low by construction, as the Fig. 2 caption concedes. The headline that the most massive z=0 SMBHs grew very little since z=2 is thus largely a restatement of this Mstar-normalized accretion choice rather than an independent measurement of early assembly.
full rationale
The paper is unusually transparent that the z=0 MBH–Mstar relations and the Aird et al. (2019) λ_sBHAR distributions are inputs and that all model variations reproduce them by construction (Secs. 2.4.2, 6, and 8; Fig. 2). Agreement with those constraints is therefore not independent validation, and I do not count that as a hidden circular step. The backward integration from z=0 to z=2 is a genuine forward-calculation using UniverseMachine SFR histories, and the quantitative conclusion does depend on the observed shape of p(λ_sBHAR), the duty cycle fAGN, and the assumed factor-two obscuration correction. However, the qualitative headline ('most massive SMBHs grew very little since z=2') is substantially predetermined by the decision to draw accretion rates from Mstar-normalized λ_sBHAR distributions after assigning high MBH/Mstar to quiescent galaxies at z=0; Eq. (1) plus Eqs. (7)–(8) make Mdot/MBH ∝ Mstar/MBH. The robustness tests reorder λ values but keep the same normalization, so they do not exercise the main alternative where the physical Eddington-ratio distribution is tied to host SFR. The score reflects this partial, disclosed construction rather than a hidden fit or a load-bearing self-citation chain.
Assumptions & free parameters
free parameters (5)
- Obscured AGN correction factor =
2.0 (f_AGN = 2 x f_AGN,X)
- Star-forming main sequence fit =
log10 SFR_MS = -7.9 + 0.78 log10 Mstar + 3 log10(1+z)
- Intrinsic scatter in z=0 M_BH-M_star relations =
epsilon = 0.65 dex
- Radiative efficiency =
eta = 0.1
- sBHAR sampling cutoffs =
lambda < 1.0 at z<1, <10 at z>1
assumptions (5)
- domain assumption UniverseMachine provides accurate galaxy stellar masses, SFRs, and assembly histories over z=0-2.
- domain assumption sBHAR probability distributions from Aird et al. (2019) are representative of all galaxies, after the factor-of-two obscuration correction.
- domain assumption The z=0 M_BH-M_star relations from Greene et al. (2020) apply to the full galaxy population at z=0.
- ad hoc to paper Black hole growth is fully described by the assigned accretion (Eq. 8) and mergers with mass proportional to stellar mass (Eq. 9).
- standard math The bolometric correction kbol = 25 and the Eddington-normalized definition of lambda (Eq. 1) apply to all AGN.
Cite this review
Pith. "Pith review of Diverse pathways for supermassive black hole-galaxy coevolution." pith.science (2026). https://pith.science/paper/4WW2KWLP
@misc{pith2026241108838,
  author       = {Pith},
  title        = {Pith review of: Diverse pathways for supermassive black hole-galaxy coevolution},
  year         = {2026},
  howpublished = {\url{https://pith.science/paper/4WW2KWLP}},
  note         = {Machine review of arXiv:2411.08838}
}
abstract
Supermassive black holes (SMBHs) are observed in diverse galaxy populations across time yet a clear understanding of how they coevolve with their hosts has not been reached. Physically-motivated models of SMBH accretion and feedback vary widely between galaxy formation simulations due to the difficulty of modeling the range of scales important for galactic and SMBH processes. Here we use observational data to build an empirical model for SMBH growth. We apply observed specific accretion rate probability distributions as a function of galaxy star formation rate between $z = 0-2$ to the UniverseMachine galaxy formation model to determine SMBH accretion rates based on galaxy properties. We use observed $z = 0$ SMBH-stellar mass relations for the quiescent and star-forming populations to provide the local boundary conditions for SMBH growth histories. We then track the coevolutionary histories of galaxy stellar mass and their SMBHs backwards in time to $z = 2$. We find that the most massive SMBHs at $z = 0$ have grown very little of their total mass between $z = 0-2$, indicating early SMBH mass assembly for these systems. Conversely, lower mass SMBHs at $z = 0$ assembled their mass gradually across $z = 0-2$. This results in substantial evolution of the SMBH-stellar mass relation, shifting to higher normalization and shallower slope with increasing redshift. We find that the substantial scatter observed in the $z = 0$ SMBH-stellar mass relation results in the diversity of growth pathways found in our model, with some galaxies assembling their stellar mass before their SMBHs and others doing the opposite.
Figures

Figures from the paper (10 more)


Forward citations
Cited by 1 Pith paper
-
Measurements of the z=4-10 X-ray Luminosity Function: the high space density of moderate-luminosity, obscured AGN
A 32-source X-ray sample yields a z=4-10 AGN luminosity function that is up to two orders of magnitude above model extrapolations at z=7-10.
Reference graph
Works this paper leans on
-
[1]
Aird, J., & Coil, A. L. 2021, MNRAS, 502, 5962, doi: 10.1093/mnras/stab312
-
[2]
Aird, J., Coil, A. L., & Georgakakis, A. 2018, MNRAS, 474, 1225, doi: 10.1093/mnras/stx2700 —. 2019, MNRAS, 484, 4360, doi: 10.1093/mnras/stz125
-
[3]
Aird, J., Coil, A. L., & Kocevski, D. D. 2022, MNRAS, 515, 4860, doi: 10.1093/mnras/stac2103
-
[4]
Aird, J., Coil, A. L., Moustakas, J., et al. 2012, ApJ, 746, 90, doi: 10.1088/0004-637X/746/1/90
-
[5]
2023, MNRAS, 518, 562, doi: 10.1093/mnras/stac3118
Chaves-Montero, J. 2023, MNRAS, 518, 562, doi: 10.1093/mnras/stac3118
-
[6]
1993, ARA&A, 31, 473, doi: 10.1146/annurev.aa.31.090193.002353
Antonucci, R. 1993, ARA&A, 31, 473, doi: 10.1146/annurev.aa.31.090193.002353
arXiv 1993
-
[7]
Azadi, M., Aird, J., Coil, A. L., et al. 2015, ApJ, 806, 187, doi: 10.1088/0004-637X/806/2/187
-
[8]
Azadi, M., Coil, A. L., Aird, J., et al. 2017, ApJ, 835, 27, doi: 10.3847/1538-4357/835/1/27
Show all 80 references
-
[9]
H., Hearin, A
Behroozi, P., Wechsler, R. H., Hearin, A. P., & Conroy, C. 2019, MNRAS, 488, 3143, doi: 10.1093/mnras/stz1182
2019 doi
-
[10]
L., Watson, M
Birchall, K. L., Watson, M. G., Aird, J., & Starling, R. L. C. 2022, MNRAS, 510, 4556, doi: 10.1093/mnras/stab3573 —. 2023, MNRAS, 523, 4756, doi: 10.1093/mnras/stad1723 Bogd´ an,´A., Goulding, A. D., Natarajan, P., et al. 2024, Nature Astronomy, 8, 126, doi: 10.1038/s41550-02...
2022 doi
-
[11]
G., Benson, A
Bower, R. G., Benson, A. J., Malbon, R., et al. 2006, MNRAS, 370, 645, doi: 10.1111/j.1365-2966.2006.10519.x
2006
-
[12]
S., et al
Brennan, R., Choi, E., Somerville, R. S., et al. 2018, ApJ, 860, 14, doi: 10.3847/1538-4357/aac2c4
2018 doi
-
[13]
M., Binney, J., et al
Cattaneo, A., Faber, S. M., Binney, J., et al. 2009, Nature, 460, 213, doi: 10.1038/nature08135
2009 doi
-
[14]
A., Schaye, J., Bower, R
Crain, R. A., Schaye, J., Bower, R. G., et al. 2015, MNRAS, 450, 1937, doi: 10.1093/mnras/stv725
2015 doi
-
[15]
J., Springel, V., White, S
Croton, D. J., Springel, V., White, S. D. M., et al. 2006, MNRAS, 365, 11, doi: 10.1111/j.1365-2966.2005.09675.x
2006
-
[16]
J., et al
Dattathri, S., Natarajan, P., Porras-Valverde, A. J., et al. 2024, arXiv e-prints, arXiv:2410.13958. https://arxiv.org/abs/2410.13958 Della Ceca, R., Caccianiga, A., Severgnini, P., et al. 2008, A&A, 487, 119, doi: 10.1051/0004-6361:20079319
2024 arXiv
-
[17]
2014, MNRAS, 439, 2736, doi: 10.1093/mnras/stu130 Di Matteo, T., Springel, V., & Hernquist, L
Delvecchio, I., Gruppioni, C., Pozzi, F., et al. 2014, MNRAS, 439, 2736, doi: 10.1093/mnras/stu130 Di Matteo, T., Springel, V., & Hernquist, L. 2005, Nature, 433, 604, doi: 10.1038/nature03335
2014 doi
-
[18]
Fabian, A. C. 2012, ARA&A, 50, 455, doi: 10.1146/annurev-astro-081811-125521
2012 doi
-
[19]
2000, ApJ, 539, L9, doi: 10.1086/312838
Ferrarese, L., & Merritt, D. 2000, ApJ, 539, L9, doi: 10.1086/312838
2000 doi
-
[20]
M., Civano, F., Fabbiano, G., et al
Fornasini, F. M., Civano, F., Fabbiano, G., et al. 2018, ApJ, 865, 43, doi: 10.3847/1538-4357/aada4e
2018 doi
-
[21]
P., Mather, J
Gardner, J. P., Mather, J. C., Abbott, R., et al. 2023, PASP, 135, 068001, doi: 10.1088/1538-3873/acd1b5
2023 doi
-
[22]
2000, ApJ, 539, L13, doi: 10.1086/312840
Gebhardt, K., Bender, R., Bower, G., et al. 2000, ApJ, 539, L13, doi: 10.1086/312840
2000 doi
-
[23]
2017, MNRAS, 471, 1976, doi: 10.1093/mnras/stx1602 Diverse pathways for SMBH-galaxy coevolution 23
Georgakakis, A., Aird, J., Schulze, A., et al. 2017, MNRAS, 471, 1976, doi: 10.1093/mnras/stx1602 Diverse pathways for SMBH-galaxy coevolution 23
2017 doi
-
[24]
D., Greene, J
Goulding, A. D., Greene, J. E., Setton, D. J., et al. 2023, ApJ, 955, L24, doi: 10.3847/2041-8213/acf7c5
2023 doi
-
[25]
E., Strader, J., & Ho, L
Greene, J. E., Strader, J., & Ho, L. C. 2020, ARA&A, 58, 257, doi: 10.1146/annurev-astro-032620-021835
2020 doi
-
[26]
E., Labbe, I., Goulding, A
Greene, J. E., Labbe, I., Goulding, A. D., et al. 2024, ApJ, 964, 39, doi: 10.3847/1538-4357/ad1e5f
2024 doi
-
[27]
2024, arXiv e-prints, arXiv:2408.14297, doi: 10.48550/arXiv.2408.14297 G¨ ultekin, K., Richstone, D
Guetzoyan, P., Aird, J., Georgakakis, A., et al. 2024, arXiv e-prints, arXiv:2408.14297, doi: 10.48550/arXiv.2408.14297 G¨ ultekin, K., Richstone, D. O., Gebhardt, K., et al. 2009, ApJ, 698, 198, doi: 10.1088/0004-637X/698/1/198
-
[28]
S., et al
Habouzit, M., Li, Y., Somerville, R. S., et al. 2021, MNRAS, 503, 1940, doi: 10.1093/mnras/stab496
2021 doi
-
[29]
2023, ApJ, 959, 39, doi: 10.3847/1538-4357/ad029e H¨ aring, N., & Rix, H.-W
Harikane, Y., Zhang, Y., Nakajima, K., et al. 2023, ApJ, 959, 39, doi: 10.3847/1538-4357/ad029e H¨ aring, N., & Rix, H.-W. 2004, ApJ, 604, L89, doi: 10.1086/383567
2023 doi
-
[30]
M., Costa, T., Tadhunter, C
Harrison, C. M., Costa, T., Tadhunter, C. N., et al. 2018, Nature Astronomy, 2, 198, doi: 10.1038/s41550-018-0403-6
2018 doi
-
[31]
M., Alexander, D
Harrison, C. M., Alexander, D. M., Mullaney, J. R., et al. 2012, ApJ, 760, L15, doi: 10.1088/2041-8205/760/1/L15
2012 doi
-
[32]
Henriques, B. M. B., White, S. D. M., Thomas, P. A., et al. 2015, MNRAS, 451, 2663, doi: 10.1093/mnras/stv705
2015 doi
-
[33]
C., Mullaney, J
Hickox, R. C., Mullaney, J. R., Alexander, D. M., et al. 2014, ApJ, 782, 9, doi: 10.1088/0004-637X/782/1/9
2014 doi
-
[34]
2014, MNRAS, 442, 2304, doi: 10.1093/mnras/stu1023
Hirschmann, M., Dolag, K., Saro, A., et al. 2014, MNRAS, 442, 2304, doi: 10.1093/mnras/stu1023
2014 doi
-
[35]
G., Tacchella, S., Genel, S., et al
Iyer, K. G., Tacchella, S., Genel, S., et al. 2020, MNRAS, 498, 430, doi: 10.1093/mnras/staa2150
2020 doi
-
[36]
M., Tremonti, C., et al
Kauffmann, G., Heckman, T. M., Tremonti, C., et al. 2003, MNRAS, 346, 1055, doi: 10.1111/j.1365-2966.2003.07154.x
2003
-
[37]
A., Trujillo-Gomez, S., & Primack, J
Klypin, A. A., Trujillo-Gomez, S., & Primack, J. 2011, ApJ, 740, 102, doi: 10.1088/0004-637X/740/2/102
2011 doi
-
[38]
Kormendy, J., & Ho, L. C. 2013, ARA&A, 51, 511, doi: 10.1146/annurev-astro-082708-101811
2013 doi
- [39]
-
[40]
Li, J. I. H., Shen, Y., Ho, L. C., et al. 2023, ApJ, 954, 173, doi: 10.3847/1538-4357/acddda
2023 doi
-
[41]
1969, Nature, 223, 690, doi: 10.1038/223690a0
Lynden-Bell, D. 1969, Nature, 223, 690, doi: 10.1038/223690a0
1969 doi
- [42]
-
[43]
2018, Nature, 553, 307, doi: 10.1038/nature24999
Ruiz-Lara, T., & van de Ven, G. 2018, Nature, 553, 307, doi: 10.1038/nature24999
2018 doi
-
[44]
C., Carroll, C
Masini, A., Hickox, R. C., Carroll, C. M., et al. 2020, ApJS, 251, 2, doi: 10.3847/1538-4365/abb607
2020 doi
-
[45]
P., Brammer, G., et al
Matthee, J., Naidu, R. P., Brammer, G., et al. 2024, ApJ, 963, 129, doi: 10.3847/1538-4357/ad2345
2024 doi
-
[46]
J., & Ma, C.-P
McConnell, N. J., & Ma, C.-P. 2013, ApJ, 764, 184, doi: 10.1088/0004-637X/764/2/184
2013 doi
-
[47]
2013, in Planets, Stars and Stellar Systems
Merloni, A., & Heinz, S. 2013, in Planets, Stars and Stellar Systems. Volume 6: Extragalactic Astronomy and Cosmology, ed. T. D. Oswalt & W. C. Keel, Vol. 6, 503, doi: 10.1007/978-94-007-5609-0 11
2013 doi
-
[48]
2017, Frontiers in Astronomy and Space Sciences, 4, 42, doi: 10.3389/fspas.2017.00042
Morganti, R. 2017, Frontiers in Astronomy and Space Sciences, 4, 42, doi: 10.3389/fspas.2017.00042
2017
-
[49]
2023, A&A, 672, A98, doi: 10.1051/0004-6361/202345924
Mountrichas, G. 2023, A&A, 672, A98, doi: 10.1051/0004-6361/202345924
2023 doi
-
[50]
J., van Duinen, R., et al
Neugebauer, G., Habing, H. J., van Duinen, R., et al. 1984, ApJ, 278, L1, doi: 10.1086/184209
1984 doi
-
[51]
M., Bluck, A
Piotrowska, J. M., Bluck, A. F. L., Maiolino, R., & Peng, Y. 2022, MNRAS, 512, 1052, doi: 10.1093/mnras/stab3673
2022 doi
-
[52]
Ramasawmy, J., Stevens, J., Martin, G., & Geach, J. E. 2019, MNRAS, 486, 4320, doi: 10.1093/mnras/stz1093
2019 doi
-
[53]
Rees, M. J. 1984, ARA&A, 22, 471, doi: 10.1146/annurev.aa.22.090184.002351
1984
-
[54]
E., & Volonteri, M
Reines, A. E., & Volonteri, M. 2015, ApJ, 813, 82, doi: 10.1088/0004-637X/813/2/82
2015 doi
-
[55]
2023, PASP, 135, 048001, doi: 10.1088/1538-3873/acb293 Rodr ´ ıguez-Puebla, A., Behroozi, P., Primack, J., et al
Rigby, J., Perrin, M., McElwain, M., et al. 2023, PASP, 135, 048001, doi: 10.1088/1538-3873/acb293 Rodr ´ ıguez-Puebla, A., Behroozi, P., Primack, J., et al. 2016, MNRAS, 462, 893, doi: 10.1093/mnras/stw1705
2023 doi
-
[56]
P., Opitsch, M., Erwin, P., et al
Saglia, R. P., Opitsch, M., Erwin, P., et al. 2016, ApJ, 818, 47, doi: 10.3847/0004-637X/818/1/47
2016 doi
-
[57]
Salpeter, E. E. 1964, ApJ, 140, 796, doi: 10.1086/147973
1964 doi
-
[58]
J., Shao, L., et al
Santini, P., Rosario, D. J., Shao, L., et al. 2012, A&A, 540, A109, doi: 10.1051/0004-6361/201118266
2012 doi
-
[59]
A., Bower, R
Schaye, J., Crain, R. A., Bower, R. G., et al. 2015, MNRAS, 446, 521, doi: 10.1093/mnras/stu2058
2015 doi
-
[60]
K., et al
Shankar, F., Bernardi, M., Sheth, R. K., et al. 2016, MNRAS, 460, 3119, doi: 10.1093/mnras/stw678
2016 doi
-
[61]
2019, MNRAS, 485, 1278, doi: 10.1093/mnras/stz376
Shankar, F., Bernardi, M., Richardson, K., et al. 2019, MNRAS, 485, 1278, doi: 10.1093/mnras/stz376
2019 doi
-
[62]
2022, ApJ, 927, 189, doi: 10.3847/1538-4357/ac51d5
Shi, J., Peng, Y., Diemer, B., et al. 2022, ApJ, 927, 189, doi: 10.3847/1538-4357/ac51d5
2022 doi
-
[63]
2015, MNRAS, 452, 575, doi: 10.1093/mnras/stv1340
Sijacki, D., Vogelsberger, M., Genel, S., et al. 2015, MNRAS, 452, 575, doi: 10.1093/mnras/stv1340
2015 doi
-
[64]
D., Smethurst, R
Simmons, B. D., Smethurst, R. J., & Lintott, C. 2017, MNRAS, 470, 1559, doi: 10.1093/mnras/stx1340
2017 doi
-
[65]
D., Lintott, C., Schawinski, K., et al
Simmons, B. D., Lintott, C., Schawinski, K., et al. 2013, MNRAS, 429, 2199, doi: 10.1093/mnras/sts491
2013 doi
-
[66]
S., & Dav´ e, R
Somerville, R. S., & Dav´ e, R. 2015, ARA&A, 53, 51, doi: 10.1146/annurev-astro-082812-140951 24
2015 doi
-
[67]
S., Hopkins, P
Somerville, R. S., Hopkins, P. F., Cox, T. J., Robertson, B. E., & Hernquist, L. 2008, MNRAS, 391, 481, doi: 10.1111/j.1365-2966.2008.13805.x
2008
-
[68]
K., Dolag, K., Hirschmann, M., Prieto, M
Steinborn, L. K., Dolag, K., Hirschmann, M., Prieto, M. A., & Remus, R.-S. 2015, MNRAS, 448, 1504, doi: 10.1093/mnras/stv072
2015 doi
-
[69]
A., Lyu, J., Rieke, G
Stone, M. A., Lyu, J., Rieke, G. H., Alberts, S., & Hainline, K. N. 2024, ApJ, 964, 90, doi: 10.3847/1538-4357/ad2a57
2024 doi
-
[70]
2020, ApJ, 889, 32, doi: 10.3847/1538-4357/ab5f5f
Suh, H., Civano, F., Trakhtenbrot, B., et al. 2020, ApJ, 889, 32, doi: 10.3847/1538-4357/ab5f5f
2020 doi
- [71]
-
[72]
A., Bell, E
Terrazas, B. A., Bell, E. F., Henriques, B. M. B., et al. 2016, ApJ, 830, L12, doi: 10.3847/2041-8205/830/1/L12
2016 doi
-
[73]
A., Bell, E
Terrazas, B. A., Bell, E. F., Woo, J., & Henriques, B. M. B. 2017, ApJ, 844, 170, doi: 10.3847/1538-4357/aa7d07
2017 doi
-
[74]
A., Bell, E
Terrazas, B. A., Bell, E. F., Pillepich, A., et al. 2020, MNRAS, 493, 1888, doi: 10.1093/mnras/staa374 van den Bosch, R. C. E. 2016, ApJ, 831, 134, doi: 10.3847/0004-637X/831/2/134
2020 doi
-
[75]
2016, MNRAS, 460, 2979, doi: 10.1093/mnras/stw1123
Volonteri, M., Dubois, Y., Pichon, C., & Devriendt, J. 2016, MNRAS, 460, 2979, doi: 10.1093/mnras/stw1123
2016 doi
-
[76]
2018, MNRAS, 479, 4056, doi: 10.1093/mnras/sty1733
Weinberger, R., Springel, V., Pakmor, R., et al. 2018, MNRAS, 479, 4056, doi: 10.1093/mnras/sty1733
2018 doi
-
[77]
N., Vito, F., et al
Yang, G., Brandt, W. N., Vito, F., et al. 2018, MNRAS, 475, 1887, doi: 10.1093/mnras/stx2805
2018 doi
-
[78]
A., et al
Yue, M., Eilers, A.-C., Simcoe, R. A., et al. 2024, ApJ, 966, 176, doi: 10.3847/1538-4357/ad3914
2024 doi
-
[79]
2023, MNRAS, 518, 2123, doi: 10.1093/mnras/stac2633 —
Zhang, H., Behroozi, P., Volonteri, M., et al. 2023, MNRAS, 518, 2123, doi: 10.1093/mnras/stac2633 —. 2024, MNRAS, 531, 4974, doi: 10.1093/mnras/stae1447
2023 doi
-
[80]
Zhuang, M.-Y., & Ho, L. C. 2023, Nature Astronomy, 7, 1376, doi: 10.1038/s41550-023-02051-4
2023 doi
Reviewed August 12, 2026 · model on record in the stance chip above.
Discussion (0). Continue with ORCID to comment.