REVIEW 3 major objections 4 minor 115 references
Deep Extragalactic VIsible Legacy Survey (DEVILS): The sSFR-M$_{\star}$plane part I: The recent SFH of galaxies and movement through the plane
T0 review · 3 major / 4 minor · reviewed 2026-08-07 · deepseek-v4-flash
Pith's one-line read A galaxy's position relative to the star-forming sequence does not reveal whether its star formation is rising, steady, or falling; a new 200-megayear metric does.
desk verdict Promising new SFH-based selection regions, but the metric's biases cut in the direction of the paper's central claim. read the letter →
The pith
A machine-rendered reading of the paper's core claim, the machinery that carries it, and where it could break.
The reading
What carries the argument
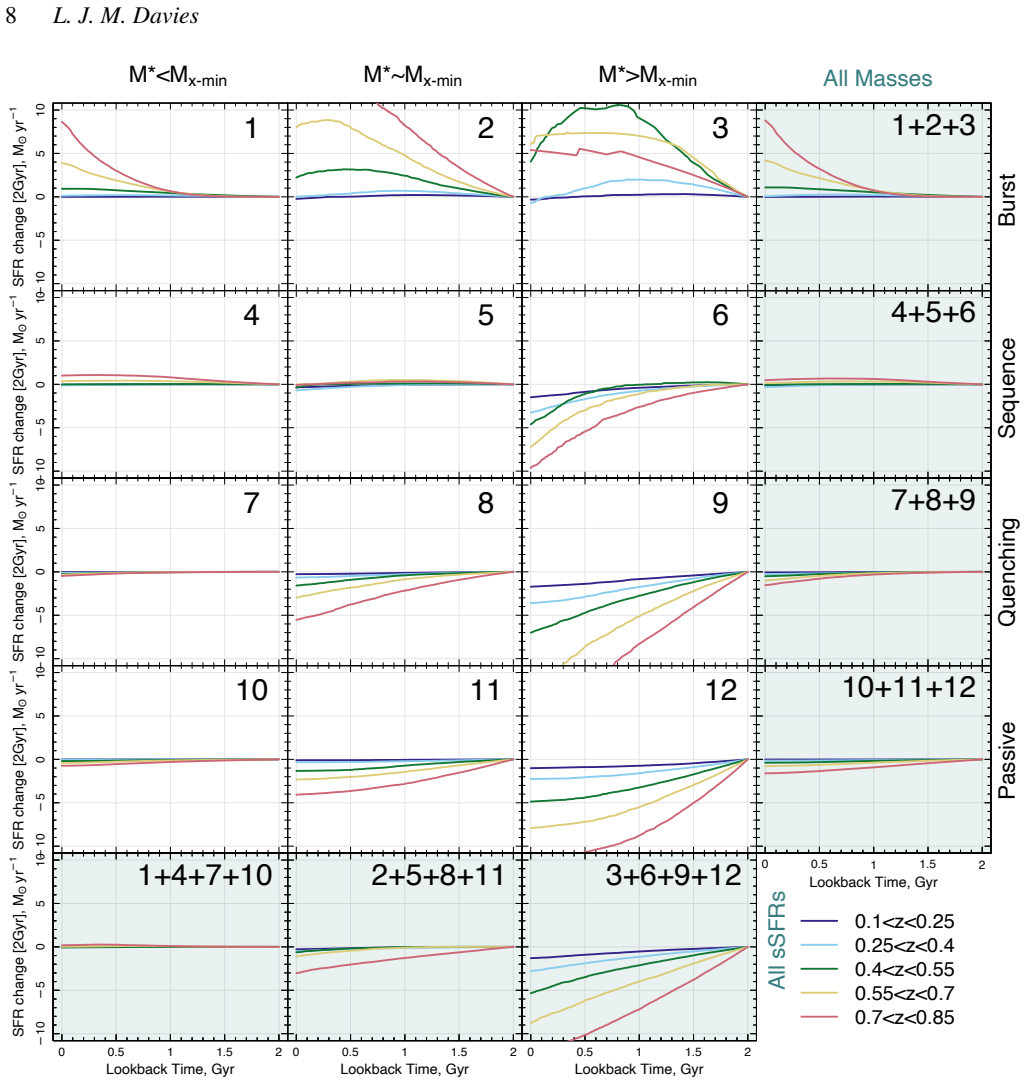
The central object is ΔSFH200Myr, a single scalar that reduces a galaxy's recent star-formation history to the change in star-formation rate between today and 200 Myr ago, taken from the ProSpect skew log-normal parametric SFH fits. It carries the argument by classifying galaxies as increasing, constant, or declining in star formation, and by demonstrating that these classes occupy distinct, approximately epoch-independent regions of the sSFR-M* plane. The minimum-dispersion mass M*_σ-min serves as the dividing line between constant and declining populations along the sequence, and the paper uses these classes to construct six new selection regions and to decompose the SFS's evolving slope and normalisation into population fractions.
What would settle it
The classification could be tested by comparing ΔSFH200Myr from the parametric fits against non-parametric star-formation-history reconstructions (or Hα/UV-based recent SFR tracers) for the same galaxies; if the increasing/constant/declining labels do not reproduce, the proposed selection regions and the decomposition of star-forming-sequence evolution lose their foundation.
Extended reading notes
Core claim
The paper's central claim is that the observed evolution of the sSFR-M* plane, and of the star-forming sequence within it, is produced by the varying contributions of galaxies with different recent star-formation histories, rather than by a single population evolving self-similarly. The load-bearing quantity is ΔSFH200Myr = SFR(t_LB=0) − SFR(t_LB=200Myr), derived from the ProSpect parametric SFH fits. Galaxies with increasing, constant, and declining ΔSFH200Myr populate separate parts of the plane, and the minimum SFR dispersion point M*_σ-min marks the transition along the sequence from constant to declining star-formation. The paper uses this decomposition to show that the changing fractions of increasing, constant, and declining populations drive the flattening, normalisation decline, and turnover-mass evolution of the star-forming sequence.
Load-bearing premise
The study assumes that ProSpect's parametric skew log-normal star-formation histories recover the true recent star-formation change of galaxies well enough for population-level trends, even though the paper's own Appendix C shows that this method misses some increasing-SFH galaxies and biases some constant-SFH galaxies to appear declining.
Editorial extensions
If this is right
- Galaxies selected by traditional 'quenching' cuts below the star-forming sequence include a substantial fraction with constant recent SFHs; the new selections reduce this contamination.
- The turnover mass of the star-forming sequence traces the stellar mass where the population shifts from constant to declining SFHs, tying it to M*_σ-min.
- Galaxies with increasing SFHs are found almost exclusively at low stellar masses, and their numbers drop sharply with time, while constant-SFH galaxies become the dominant population.
- The flattening and declining normalisation of the SFS from z~1 to the present follows from the changing mix of increasing, constant, and declining populations, each with its own slope and normalisation evolution.
Reading between the lines
- If ΔSFH200Myr robustly separates SFH classes, then position in the sSFR-M* plane could be modelled as a mixture of a few discrete classes, simplifying how simulations are compared with observations.
- Because the same ProSpect-based metric could be computed for any SED-fitted survey, the six selection regions could be tested for universality across environments and wavelengths.
- Since Appendix C shows ProSpect systematically misses some recently-starbursting low-mass galaxies, the true size of the 'SF increasing' population is likely larger than observed; the qualitative trends with mass and time should survive, but the fractions would shift.
- The 'low-mass passive' region 5, which appears to merge into the SFS at later epochs, hints at a distinct evolutionary pathway that the authors defer to paper II.
Editorial analysis
A structured set of objections, weighed in public.
Referee Report
Summary. The paper uses the DEVILS D10 spectroscopic sample (0.1 < z < 0.85) with ProSpect SED-derived parametric SFHs to investigate how recent star-formation histories vary across the sSFR-M* plane. The authors define a metric DeltaSFH200Myr (Eq. 2), show that it separates galaxies into increasing, constant, and declining recent-SFH populations that occupy distinct regions of the plane, and propose six new selection regions intended to isolate galaxies with common recent SFHs. They argue that the traditional practice of classifying galaxies by position relative to the star-forming sequence fails at high stellar masses, and that the evolving slope, normalisation, and turnover mass of the SFS are driven by the changing fractional contribution of the increasing, constant, and declining populations. The analysis is supported by a comparison to Shark semi-analytic model fits in Appendix C.
Significance. If the central decomposition is robust, the paper provides a new observational taxonomy for the sSFR-M* plane, links the sigma_SFR minimum (M*_sigma-min) to the boundary between constant and declining recent SFHs, and offers a concrete explanation for the evolving shape of the star-forming sequence. The study is transparent about sample completeness, the choice of linear-SFR metric, and the limitations of parametric SFH fitting, and it includes a simulation-based check as well as tests with alternative DeltaSFH timescales. The claim that traditional SFS-relative selections mix heterogeneous SFH populations, especially at high stellar mass, is important and of wide interest. However, the headline conclusions inherit the systematic uncertainties of the ProSpect SFH reconstruction, and the validation presented is partly circular.
major comments (3)
- [Section 3.2 / Eq. (2) / Appendix C / Figure 11] The central metric DeltaSFH200Myr is derived from ProSpect skew log-normal SFHs, and Appendix C (Figures B6 and B7) documents two biases that act in the direction of the paper's headline picture: ProSpect misses a substantial fraction of truly increasing-SFH galaxies (particularly highly stochastic low-mass systems), and the functional form forces a peak that biases some constant-SFH galaxies to appear mildly declining. Since Figure 11 uses exactly these DeltaSFH classes to decompose the SFS into populations with stable slopes and evolving normalisations, the population fractions and fitted slopes are not demonstrated to be robust against these biases. The authors acknowledge that ProSpect is not reliable for individual sources, but the population-level trends in Figure 11 are precisely what would change if the missing increasing sources were included or constant sources reclassified. The Shark validation is additionally only at z~0.05-0.1, not at the redshifts of the main sample, so it does not directly test the redshift-evolution claims. This is a load-bearing gap; the authors should quantify how the Figure 11 decomposition changes under explicit bias-correction scenarios or cross-check with an independent SFH reconstruction.
- [Section 3.3 / Figure 10] The purity comparison in Figure 10 is not an independent validation. The new selection regions are drawn from the median DeltaSFH200Myr map in Figure 8, and the 'correct' class in Figure 10 is defined using the same DeltaSFH200Myr values. High purity therefore follows partly by construction. To support the claim that the new regions robustly isolate galaxies with common recent SFHs, the authors should validate against an external tracer (e.g., H-alpha/UV or non-parametric SFH fits) or apply the selection boundaries to simulated galaxies with known true SFHs and measure true-class purity, as is done in Appendix C.
- [Section 3.3 / Figure 11] The new selection boundaries (e.g., log10(sSFR) = -0.41 log10(M*) -4.85, and the split at M*_sigma-min) are defined by eye, and the paper does not quantify how the subsequent SFS decomposition depends on these choices. Because the boundaries are used to define the populations whose fractions, slopes, and normalisation evolution are interpreted in Figure 11, plausible shifts in the boundaries (e.g., changing the constant/declining threshold from +/-0.1 to +/-0.2 M_sun/yr, or moving the M*_sigma-min split by +/-0.3 dex) could alter the fractions and the fitted normalisation evolution. A sensitivity test would establish whether the main conclusions are stable.
minor comments (4)
- [Section 3.1.1] There are several typographical errors, including 'thethe', 'metic', and 'potentail'; the manuscript would benefit from a careful proofreading pass.
- [Section 3.4] The sentence 'The Universe truely is on the decline' contains a typo ('truely' should be 'truly').
- [Figure 8 caption] The caption states that the bottom-right panel shows the new selection regions 'just showing the 0.4<z<0.55 bin'; it would be helpful to state explicitly in the caption that the boundary lines evolve with redshift via M*_sigma-min, and to reference the equations in Section 3.3.
- [Appendix C] The text says that the ProSpect-fitted Shark sample shows a significant fraction of slowly declining SFHs on the low-mass SFS, while the DEVILS observations do not; this discrepancy is important enough to warrant a more detailed discussion, since it directly bears on the claimed universality of the DeltaSFH200Myr-based classifications.
Circularity Check
Partial circularity: the new ΔSFH200Myr selection regions are validated with the same ΔSFH200Myr map used to define them, and the constant/declining boundary is imposed at the self-cited M*_sigma-min before being reported as the SFS turnover boundary; the SFS decomposition and Shark comparison retain independent content.
-
self definitional
[Section 3.3, Figures 8-10]
"We then use these populations to define subregions of the sSFR-M★ plane that contain galaxies with similar recent SFHs. ... To determine if these regions robustly select for galaxies with common SFHs ... This is also reflected in the distribution of ΔSFH200 Myr values (shown in the right column), which are as expected given how the selection regions are defined."
The new regions are drawn by eye around bins of Figure 8, which is a map of the median ProSpect ΔSFH200Myr value in each sSFR-M★ bin. Figure 10 then measures 'purity' as the fraction of each selection whose ProSpect ΔSFH200Myr class matches the region label. Since the region boundaries were constructed from those same ΔSFH200Myr classes, high purity is a property of the construction rather than an independent confirmation. The paper itself states that the ΔSFH200Myr distributions are 'as expected given how the selection regions are defined,' acknowledging that the validation is not an independent test.
-
self citation load bearing
[Section 3.3 and Section 3.4]
"The separation between these two types of galaxy qualitatively appears to trace M∗σ−min at all epochs (gold vertical lines). As such, we separate the traditional SFS region into two stellar mass ranges based on M∗σ−min. ... the populations along the traditional SFS region transitions from galaxies with constant SFH to those with rapidly declining SFHs at M∗σ−min. At this point we also see a change in slope of the SFS. This immediately suggests the turn-over of the SFS represents the transition..."
M*_sigma-min is imported from the authors' Davies et al. (2022), which already identified the SFS turnover mass with M*_sigma-min. When defining regions 2 and 3, the paper explicitly imposes the constant/declining SFH boundary at M*_sigma-min, then later reports that the SFH transition and the SFS turnover both occur at M*_sigma-min. The conclusion therefore partly reduces to a prior self-citation plus the authors' own drawn boundary, rather than an independently fitted SFH boundary, although the colour transition visible in Figure 7 provides some empirical support.
full rationale
The central SFS-evolution decomposition in Figure 11 is not itself circular: the full SFS fit is partitioned into increasing/constant/declining ΔSFH200Myr classes, and the statement that changing fractions produce the changing full-sample fit is a legitimate, if bookkeeping-level, decomposition. The Appendix C Shark comparison is an external check of the ProSpect-derived ΔSFH200Myr metric, and the paper openly documents that ProSpect misses some increasing-SFH galaxies and biases some constant-SFH galaxies toward mildly declining classifications, which limits but does not make circular the population-level trends. However, the paper's claimed validation of the new selection methodology is circular: the regions are defined from the same ΔSFH200Myr map that is then used to measure their purity, so the improved 'purity' over the old SFS-based selection is not an independent result. In addition, the identification of the constant/declining SFH boundary with M*_sigma-min is partly imposed by drawing the region boundary at that self-cited quantity before concluding that the SFS turnover is that same boundary. These issues affect a load-bearing part of the paper, but because the SFS slope decomposition and the external Shark calibration provide independent content, the overall circularity is partial rather than total.
Assumptions & free parameters
free parameters (6)
- DeltaSFH200Myr classification bins =
[-1.1, -0.5, -0.1, 0.1, 0.5, 1.1] M_sun/yr
- Upper SF-increasing boundary line =
log10(sSFR) = -0.41 log10(M*) - 4.85
- SFS lower boundary line (low mass) =
log10(sSFR) = -0.25 log10(M*) - 7.10
- Slow quenching lower boundary line =
log10(sSFR) = -0.93 log10(M*) - 1.3
- SFS definition thresholds =
sSFR > 10^-10.25 yr^-1, M_lim < M* < 10^10.5 M_sun, running median in 0.1 dex bins
- Stellar mass offset from M*_sigma-min =
0.3 dex
assumptions (5)
- domain assumption ProSpect parametric skew log-normal SFHs adequately recover the average recent SFH of galaxy populations
- domain assumption The DEVILS D10 field is representative of the galaxy population at 0.1<z<0.85
- standard math The Thorne et al. (2021) colour completeness limit defines a volume-limited sample
- domain assumption Linear change in SFR is the most appropriate metric for recent SFH change
- domain assumption The Shark semi-analytic model provides a valid test of ProSpect SFH recovery
Cite this review
Pith. "Pith review of Deep Extragalactic VIsible Legacy Survey (DEVILS): The sSFR-M$_{\star}$plane part I: The recent SFH of galaxies and movement through the plane." pith.science (2026). https://pith.science/paper/555QLYTT
@misc{pith2026250521947,
  author       = {Pith},
  title        = {Pith review of: Deep Extragalactic VIsible Legacy Survey (DEVILS): The sSFR-M$_\star$plane part I: The recent SFH of galaxies and movement through the plane},
  year         = {2026},
  howpublished = {\url{https://pith.science/paper/555QLYTT}},
  note         = {Machine review of arXiv:2505.21947}
}
abstract
In a recent paper we parameterised the evolution of the star-formation rate dispersion ($\sigma_{SFR}$) across the specific star-formation rate - stellar mass plane (sSFR-M$_{\star}$) using the Deep Extragalactic VIsible Legacy Survey (DEVILS) - suggesting that the point at which the minimum in the dispersion occurs (M$^{*}_{\sigma-min}$) defines a boundary between different physical mechanisms affecting galaxy evolution. Here we expand upon that work to determine the movement of galaxies through the sSFR-M$_{\star}$ plane using their recent star-formation histories (SFHs) and explore how this leads to the observed $\sigma_{SFR}$-M$_{\star}$ relation. We find that galaxies in sub-regions of the sSFR-M$_{\star}$ plane show distinctly different SFHs, leading to a complex evolution of the sSFR-M$_{\star}$ plane and star-forming sequence (SFS). However, we find that selecting galaxies based on stellar mass and position relative to SFS alone (as is traditionally the case), may not identify sources with common recent SFHs, and therefore propose a new selection methodology. We then use the recent SFH of galaxies to measure the evolution of the SFS, showing that it has varying contributions from galaxies with different SFHs that lead to the observed changes in slope, normalisation and turnover stellar mass. Finally, we determine the overall evolution of the sSFR-M$_{\star}$ plane from $z\sim1$ to today. In the second paper in this series we will discuss physical properties of galaxies with common recent SFHs and how these lead to the observed $\sigma_{SFR}$-M$_{\star}$ relation and evolution of the sSFR-M$_{\star}$ plane.
Figures


Figures from the paper (9 more)


Reference graph
Works this paper leans on
-
[1]
Asada Y., Sawicki M., Abraham R., Brada c M., Brammer G., Desprez G., Estrada-Carpenter V., et al., 2024, MNRAS, 527, 11372. doi:10.1093/mnras/stad3902
-
[2]
Abramson L. E., Gladders M. D., Dressler A., Oemler A., Poggianti B., Vulcani B., 2016, ApJ, 832, 7. doi:10.3847/0004-637X/832/1/7
-
[3]
Baldry I. K., Liske J., Brown M. J. I., Robotham A. S. G., Driver S. P., Dunne L., Alpaslan M., et al., 2018, MNRAS, 474, 3875. doi:10.1093/mnras/stx3042
-
[4]
Barro G., Faber S. M., P \'e rez-Gonz \'a lez P. G., Koo D. C., Williams C. C., Kocevski D. D., Trump J. R., et al., 2013, ApJ, 765, 104. doi:10.1088/0004-637X/765/2/104
-
[5]
M., 2006, RPPh, 69, 3101
Baugh C. M., 2006, RPPh, 69, 3101
2006
-
[6]
Bellstedt S., Driver S. P., Robotham A. S. G., Davies L. J. M., Bogue C. R. J., Cook R. H. W., Hashemizadeh A., et al., 2020, MNRAS, 496, 3235. doi:10.1093/mnras/staa1466
-
[7]
A., Brinchmann J., Bouch \'e N., Paalvast M., Bacon R., Bouwens R
Boogaard L. A., Brinchmann J., Bouch \'e N., Paalvast M., Bacon R., Bouwens R. J., Contini T., et al., 2018, A&A, 619, A27. doi:10.1051/0004-6361/201833136
-
[8]
Bouch \'e , N., Dekel, A., Genzel, R., et al.\ 2010, , 718, 1001
2010
Show all 115 references
-
[9]
Bravo M., Robotham A. S. G., Lagos C. del P., Davies L. J. M., Bellstedt S., Thorne J. E., 2022, MNRAS, 511, 5405. doi:10.1093/mnras/stac321
2022 doi
-
[10]
Bravo M., Robotham A. S. G., Lagos C. del P., Davies L. J. M., Bellstedt S., Thorne J. E., 2023, MNRAS, 522, 4481. doi:10.1093/mnras/stad1234
2023 doi
-
[11]
N., Phillipps S., Kelvin L
Bremer M. N., Phillipps S., Kelvin L. S., De Propris R., Kennedy R., Moffett A. J., Bamford S., et al., 2018, MNRAS, 476, 12. doi:10.1093/mnras/sty124
2018 doi
-
[12]
S., Dav \'e R., Finkelstein S., et al., 2019, ApJ, 873, 74
Broussard A., Gawiser E., Iyer K., Kurczynski P., Somerville R. S., Dav \'e R., Finkelstein S., et al., 2019, ApJ, 873, 74. doi:10.3847/1538-4357/ab04ad
2019 doi
-
[13]
del P., Dav \'e R., Kilborn V., Haynes M
Brown T., Catinella B., Cortese L., Lagos C. del P., Dav \'e R., Kilborn V., Haynes M. P., et al., 2017, MNRAS, 466, 1275. doi:10.1093/mnras/stw2991
2017 doi
-
[14]
S., Kodama T., Conselice C
Bundy K., Fukugita M., Ellis R. S., Kodama T., Conselice C. J., 2004, ApJ, 601, L123
2004
-
[15]
S., Targett T
Bundy K., Fukugita M., Ellis R. S., Targett T. A., Belli S., Kodama T., 2009, ApJ, 697, 1369
2009
-
[16]
C., Leja J., Johnson B
Carnall A. C., Leja J., Johnson B. D., McLure R. J., Dunlop J. S., Conroy C., 2019, ApJ, 873, 44. doi:10.3847/1538-4357/ab04a2
2019 doi
-
[17]
doi:10.1051/0004-6361/201731036
Ciesla L., Elbaz D., Fensch J., 2017, A&A, 608, A41. doi:10.1051/0004-6361/201731036
2017 doi
-
[18]
doi:10.1051/0004-6361/202140762
Ciesla L., Buat V., Boquien M., Boselli A., Elbaz D., Aufort G., 2021, A&A, 653, A6. doi:10.1051/0004-6361/202140762
2021 doi
- [19]
-
[20]
J., 2014, ARA&A, 52, 291
Conselice C. J., 2014, ARA&A, 52, 291
2014
-
[21]
Cook R. H. W., Cortese L., Catinella B., Robotham A., 2020, MNRAS, 493, 5596. doi:10.1093/mnras/staa666
2020 doi
-
[22]
Cortese L., Catinella B., Boissier S., Boselli A., Heinis S., 2011, MNRAS, 415, 1797
2011
-
[23]
P., Catinella B., Davies L
Cortese L., van de Sande J., Lagos C. P., Catinella B., Davies L. J. M., Croom S. M., Brough S., et al., 2019, MNRAS, 485, 2656. doi:10.1093/mnras/stz485
2019 doi
-
[25]
doi:10.1086/521818
Daddi E., Dickinson M., Morrison G., Chary R., Cimatti A., Elbaz D., Frayer D., et al., 2007, ApJ, 670, 156. doi:10.1086/521818
2007 doi
-
[26]
Daddi, E., Bournaud, F., Walter, F., et al.\ 2010, , 713, 686
2010
-
[27]
Dalla Vecchia, C., & Schaye, J.\ 2008, , 387, 1431
2008
-
[28]
Darvish B., Mobasher B., Sobral D., Rettura A., Scoville N., Faisst A., Capak P., 2016, ApJ, 825, 113
2016
-
[29]
D., Kollmeier, J
Dav \'e , R., Katz, N., Oppenheimer, B. D., Kollmeier, J. A., & Weinberg, D. H.\ 2013, , 434, 2645
2013
-
[30]
Davies L. J. M., et al., 2015, MNRAS, 447, 1014
2015
-
[31]
Davies L. J. M., et al., 2015, MNRAS, 452, 616
2015
-
[32]
Davies L. J. M., et al., 2016, MNRAS, 455, 4013
2016
-
[33]
Davies L. J. M., et al., 2016, MNRAS, 461, 458
2016
-
[34]
Davies L. J. M., Huynh M. T., Hopkins A. M., Seymour N., Driver S. P., Robotham A. G. R., Baldry I. K., et al., 2017, MNRAS, 466, 2312. doi:10.1093/mnras/stw3080
2017 doi
-
[35]
Davies L. J. M., et al., 2018, MNRAS, 480, 768
2018
-
[36]
Davies L. J. M., Lagos C. del P., Katsianis A., Robotham A. S. G., Cortese L., Driver S. P., Bremer M. N., et al., 2019, MNRAS, 483, 1881. doi:10.1093/mnras/sty2957
2019 doi
-
[37]
Davies L. J. M., Robotham A. S. G., Lagos C. del P., Driver S. P., Stevens A. R. H., Bah \'e Y. M., Alpaslan M., et al., 2019, MNRAS, 483, 5444. doi:10.1093/mnras/sty3393
2019 doi
-
[38]
Davies L. J. M., Thorne J. E., Robotham A. S. G., Bellstedt S., Driver S. P., Adams N. J., Bilicki M., et al., 2021, MNRAS, 506, 256. doi:10.1093/mnras/stab1601
2021 doi
-
[39]
Davies L. J. M., Thorne J. E., Bellstedt S., Bravo M., Robotham A. S. G., Driver S. P., Cook R. H. W., et al., 2022, MNRAS, 509, 4392. doi:10.1093/mnras/stab3145
2022 doi
-
[40]
Dekel, A., & Silk, J.\ 1986, , 303, 39
1986
-
[41]
de Ravel L., et al., 2009, A&A, 498, 379
2009
-
[42]
P., et al., 2011, MNRAS, 413, 971
Driver S. P., et al., 2011, MNRAS, 413, 971
2011
-
[43]
P., et al., 2016, ApJ, 827, 108
Driver S. P., et al., 2016, ApJ, 827, 108
2016
-
[44]
P., Liske J., Davies L
Driver S. P., Liske J., Davies L. J. M., Robotham A. S. G., Baldry I. K., Brown M. J. I., Cluver M., et al., 2019, Msngr, 175, 46. doi:10.18727/0722-6691/5126
2019 doi
-
[45]
doi:10.1111/j.1365-2966.2008.13639.x
Dye S., 2008, MNRAS, 389, 1293. doi:10.1111/j.1365-2966.2008.13639.x
2008
-
[46]
Eales S., et al., 2015, MNRAS, 452, 3489
2015
-
[47]
Elbaz D., et al., 2007, A&A, 468, 33
2007
-
[48]
S., D \' az-Santos T., Magdis G., Magnelli B., Le Borgne D., et al., 2011, A&A, 533, A119
Elbaz D., Dickinson M., Hwang H. S., D \' az-Santos T., Magdis G., Magnelli B., Le Borgne D., et al., 2011, A&A, 533, A119. doi:10.1051/0004-6361/201117239
2011 doi
-
[49]
L., Thorp M
Ellison S. L., Thorp M. D., Lin L., Pan H.-A., Bluck A. F. L., Scudder J. M., Teimoorinia H., et al., 2020, MNRAS, 493, L39. doi:10.1093/mnrasl/slz179
2020 doi
-
[50]
L., Pan H.-A., Bluck A
Ellison S. L., Pan H.-A., Bluck A. F. L., Krumholz M. R., Lin L., Hunt L., Corbelli E., et al., 2024, MNRAS, 527, 10201. doi:10.1093/mnras/stad3778
2024 doi
-
[51]
R., Johnson B
Emami N., Siana B., Weisz D. R., Johnson B. D., Ma X., El-Badry K., 2019, ApJ, 881, 71. doi:10.3847/1538-4357/ab211a
2019 doi
-
[52]
C., 2012, ARA&A, 50, 455
Fabian A. C., 2012, ARA&A, 50, 455
2012
-
[53]
A., Gurvich A
Flores Vel \'a zquez J. A., Gurvich A. B., Faucher-Gigu \`e re C.-A., Bullock J. S., Starkenburg T. K., Moreno J., Lazar A., et al., 2021, MNRAS, 501, 4812. doi:10.1093/mnras/staa3893
2021 doi
-
[54]
doi:10.3847/2041-8213/acee80
Gelli V., Salvadori S., Ferrara A., Pallottini A., Carniani S., 2023, ApJL, 954, L11. doi:10.3847/2041-8213/acee80
2023 doi
-
[55]
J., Gracia-Carpio, J., et al.\ 2010, , 407, 2091
Genzel, R., Tacconi, L. J., Gracia-Carpio, J., et al.\ 2010, , 407, 2091
2010
-
[56]
P., 1985, ApJ, 292, 404
Giovanelli R., Haynes M. P., 1985, ApJ, 292, 404
1985
-
[57]
P., Davies L
Hashemizadeh A., Driver S. P., Davies L. J. M., Robotham A. S. G., Bellstedt S., Windhorst R. A., Bremer M., et al., 2021, MNRAS, 505, 136. doi:10.1093/mnras/stab600
2021 doi
-
[58]
M., Beacom J
Hopkins A. M., Beacom J. F., 2006, ApJ, 651, 142
2006
-
[59]
M., Driver S
Hopkins A. M., Driver S. P., Brough S., Owers M. S., Bauer A. E., Gunawardhana M. L. P., Cluver M. E., et al., 2013, MNRAS, 430, 2047. doi:10.1093/mnras/stt030
2013 doi
-
[60]
L., Kodra D., Koekemoer A
Iyer K., Gawiser E., Dav \'e R., Davis P., Finkelstein S. L., Kodra D., Koekemoer A. M., et al., 2018, ApJ, 866, 120. doi:10.3847/1538-4357/aae0fa
2018 doi
-
[61]
G., Gawiser E., Faber S
Iyer K. G., Gawiser E., Faber S. M., Ferguson H. C., Kartaltepe J., Koekemoer A. M., Pacifici C., et al., 2019, ApJ, 879, 116. doi:10.3847/1538-4357/ab2052
2019 doi
-
[62]
Jogee S., et al., 2009, ApJ, 697, 1971
2009
-
[63]
doi:10.1093/mnras/stv1715
Johnston R., Vaccari M., Jarvis M., Smith M., Giovannoli E., H \"a u ler B., Prescott M., 2015, MNRAS, 453, 2540. doi:10.1093/mnras/stv1715
2015 doi
-
[64]
S., et al., 2007, ApJS, 172, 320
Kartaltepe J. S., et al., 2007, ApJS, 172, 320
2007
-
[65]
del P., Davies L
Katsianis A., Zheng X., Gonzalez V., Blanc G., Lagos C. del P., Davies L. J. M., Camps P., et al., 2019, ApJ, 879, 11. doi:10.3847/1538-4357/ab1f8d
2019 doi
-
[66]
M., White S
Kauffmann G., Heckman T. M., White S. D. M., Charlot S., Tremonti C., Brinchmann J., Bruzual G., et al., 2003, MNRAS, 341, 33. doi:10.1046/j.1365-8711.2003.06291.x
2003
-
[67]
Kauffmann G., White S. D. M., Heckman T. M., M \'e nard B., Brinchmann J., Charlot S., Tremonti C., Brinkmann J., 2004, MNRAS, 353, 713
2004
-
[68]
M., De Lucia G., Brinchmann J., Charlot S., Tremonti C., White S
Kauffmann G., Heckman T. M., De Lucia G., Brinchmann J., Charlot S., Tremonti C., White S. D. M., Brinkmann J., 2006, MNRAS, 367, 1394
2006
- [69]
-
[71]
F., Dekel A., de Mello D
Kurczynski P., Gawiser E., Acquaviva V., Bell E. F., Dekel A., de Mello D. F., Ferguson H. C., et al., 2016, ApJL, 820, L1. doi:10.3847/2041-8205/820/1/L1
2016 doi
-
[72]
Lagos, C. D. P., Lacey, C. G., Baugh, C. M., Bower, R. G., & Benson, A. J.\ 2011, , 416, 1566
2011
-
[73]
del P., Tobar R
Lagos C. del P., Tobar R. J., Robotham A. S. G., Obreschkow D., Mitchell P. D., Power C., Elahi P. J., 2018, MNRAS, 481, 3573. doi:10.1093/mnras/sty2440
2018 doi
-
[74]
del P., Bravo M., Tobar R., Obreschkow D., Power C., Robotham A
Lagos C. del P., Bravo M., Tobar R., Obreschkow D., Power C., Robotham A. S. G., Proctor K. L., et al., 2024, MNRAS, 531, 3551. doi:10.1093/mnras/stae1024
2024 doi
-
[75]
Leauthaud A., et al., 2012, ApJ, 744, 159
2012
-
[76]
Lee N., et al., 2015, ApJ, 801, 80
2015
-
[77]
C., Johnson B
Leja J., Carnall A. C., Johnson B. D., Conroy C., Speagle J. S., 2019, ApJ, 876, 3. doi:10.3847/1538-4357/ab133c
2019 doi
-
[78]
S., Ting Y.-S., Johnson B
Leja J., Speagle J. S., Ting Y.-S., Johnson B. D., Conroy C., Whitaker K. E., Nelson E. J., et al., 2022, ApJ, 936, 165. doi:10.3847/1538-4357/ac887d
2022 doi
-
[79]
K., Schinnerer E., Liu D., Magnelli B., Algera H., Karim A., Davidzon I., et al., 2020, ApJ, 899, 58
Leslie S. K., Schinnerer E., Liu D., Magnelli B., Algera H., Karim A., Davidzon I., et al., 2020, ApJ, 899, 58. doi:10.3847/1538-4357/aba044
2020 doi
-
[80]
J., Carollo, C
Lilly, S. J., Carollo, C. M., Pipino, A., Renzini, A., & Peng, Y.\ 2013, , 772, 119
2013
-
[81]
L., Belfiore F., Shi Y., S \'a nchez S
Lin L., Pan H.-A., Ellison S. L., Belfiore F., Shi Y., S \'a nchez S. F., Hsieh B.-C., et al., 2019, ApJL, 884, L33. doi:10.3847/2041-8213/ab4815
2019 doi
-
[82]
Liske J., et al., 2015, MNRAS, 452, 2087
2015
-
[83]
M., Jonsson P., Cox T
Lotz J. M., Jonsson P., Cox T. J., Croton D., Primack J. R., Somerville R. S., Stewart K., 2011, ApJ, 742, 103
2011
-
[84]
D., Conroy C., Dav \'e R., 2020, ApJ, 904, 33
Lower S., Narayanan D., Leja J., Johnson B. D., Conroy C., Dav \'e R., 2020, ApJ, 904, 33. doi:10.3847/1538-4357/abbfa7
2020 doi
-
[85]
Madau, P., Pozzetti, L., & Dickinson, M.\ 1998, , 498, 106
1998
-
[86]
J., et al., 2012, A&A, 544, A156
McCracken H. J., et al., 2012, A&A, 544, A156
2012
-
[87]
D., Lacey, C
Mitchell, P. D., Lacey, C. G., Baugh, C. M., & Cole, S.\ 2016, , 456, 1459
2016
-
[88]
doi:10.1093/mnras/sts595
Nelson D., Vogelsberger M., Genel S., Sijacki D., Kere s D., Springel V., Hernquist L., 2013, MNRAS, 429, 3353. doi:10.1093/mnras/sts595
2013 doi
-
[89]
doi:10.1093/mnras/stx3040
Nelson D., Pillepich A., Springel V., Weinberger R., Hernquist L., Pakmor R., Genel S., et al., 2018, MNRAS, 475, 624. doi:10.1093/mnras/stx3040
2018 doi
-
[90]
G., Weiner, B
Noeske, K. G., Weiner, B. J., Faber, S. M., et al.\ 2007, , 660, L43
2007
-
[91]
doi:10.1111/j.1365-2966.2012.20431.x
Pacifici C., Charlot S., Blaizot J., Brinchmann J., 2012, MNRAS, 421, 2002. doi:10.1111/j.1365-2966.2012.20431.x
2012
-
[92]
A., Weiner B
Pacifici C., Kassin S. A., Weiner B. J., Holden B., Gardner J. P., Faber S. M., Ferguson H. C., et al., 2016, ApJ, 832, 79. doi:10.3847/0004-637X/832/1/79
2016 doi
-
[93]
Peng Y.-j., et al., 2010, ApJ, 721, 193
2010
-
[94]
N., Hopkins A
Phillipps S., Bremer M. N., Hopkins A. M., De Propris R., Taylor E. N., James P. A., Davies L. J. M., et al., 2019, MNRAS, 485, 5559. doi:10.1093/mnras/stz799
2019 doi
-
[95]
Robotham A. S. G., et al., 2014, MNRAS, 444, 3986
2014
-
[96]
Robotham A. S. G., Bellstedt S., Lagos C. del P., Thorne J. E., Davies L. J., Driver S. P., Bravo M., 2020, MNRAS, 495, 905. doi:10.1093/mnras/staa1116
2020 doi
-
[97]
Robotham A. S. G., Bellstedt S., Driver S. P., 2022, MNRAS, 513, 2985. doi:10.1093/mnras/stac1032
2022 doi
-
[98]
F., Avila-Reese V., Hernandez-Toledo H., Cortes-Su \'a rez E., Rodr \' guez-Puebla A., Ibarra-Medel H., Cano-D \' az M., et al., 2018, RMxAA, 54, 217
S \'a nchez S. F., Avila-Reese V., Hernandez-Toledo H., Cortes-Su \'a rez E., Rodr \' guez-Puebla A., Ibarra-Medel H., Cano-D \' az M., et al., 2018, RMxAA, 54, 217. doi:10.48550/arXiv.1709.05438
-
[99]
Sancisi R., Fraternali F., Oosterloo T., van der Hulst T., 2008, A&ARv, 15, 189
2008
-
[100]
M., Charlot, S., et al.\ 2007, , 173, 267
Salim, S., Rich, R. M., Charlot, S., et al.\ 2007, , 173, 267
2007
-
[101]
M., Lee J
Salim S., Tacchella S., Osborne C., Faber S. M., Lee J. C., Ellison S. L., 2023, ApJ, 958, 183. doi:10.3847/1538-4357/ad04db
2023 doi
-
[102]
B., White, S
Scannapieco, C., Tissera, P. B., White, S. D. M., & Springel, V.\ 2008, , 389, 1137
2008
-
[103]
M., Simmons B
Schawinski K., Urry C. M., Simmons B. D., Fortson L., Kaviraj S., Keel W. C., Lintott C. J., et al., 2014, MNRAS, 440, 889. doi:10.1093/mnras/stu327
2014 doi
-
[104]
doi:10.1051/0004-6361/201425017
Schreiber C., Pannella M., Elbaz D., B \'e thermin M., Inami H., Dickinson M., Magnelli B., et al., 2015, A&A, 575, A74. doi:10.1051/0004-6361/201425017
2015 doi
-
[105]
M., Elvis M., Giavalisco M., et al., 2007, ApJS, 172, 1
Scoville N., Aussel H., Brusa M., Capak P., Carollo C. M., Elvis M., Giavalisco M., et al., 2007, ApJS, 172, 1. doi:10.1086/516585
2007 doi
-
[106]
S., Steinhardt C
Speagle J. S., Steinhardt C. L., Capak P. L., Silverman J. D., 2014, ApJS, 214, 15. doi:10.1088/0067-0049/214/2/15
2014 doi
-
[107]
doi:10.1111/j.1365-2966.2005.09238.x
Springel V., Di Matteo T., Hernquist L., 2005, MNRAS, 361, 776. doi:10.1111/j.1365-2966.2005.09238.x
2005
-
[108]
C., Shen X., Wetzel A., Cochrane R
Sun G., Faucher-Gigu \`e re C.-A., Hayward C. C., Shen X., Wetzel A., Cochrane R. K., 2023, ApJL, 955, L35. doi:10.3847/2041-8213/acf85a
2023 doi
-
[109]
E., Robotham A
Thorne J. E., Robotham A. S. G., Davies L. J. M., Bellstedt S., Driver S. P., Bravo M., Bremer M. N., et al., 2021, MNRAS, 505, 540. doi:10.1093/mnras/stab1294
2021 doi
-
[110]
E., Robotham A
Thorne J. E., Robotham A. S. G., Davies L. J. M., Bellstedt S., Brown M. J. I., Croom S. M., Delvecchio I., et al., 2022, MNRAS, 509, 4940. doi:10.1093/mnras/stab3208
2022 doi
-
[111]
F., Jimenez R., Panter B., 2007, MNRAS, 381, 1252
Tojeiro R., Heavens A. F., Jimenez R., Panter B., 2007, MNRAS, 381, 1252. doi:10.1111/j.1365-2966.2007.12323.x
2007
-
[112]
J., 2021, ApJ, 910, 137
Wang E., Lilly S. J., 2021, ApJ, 910, 137. doi:10.3847/1538-4357/abe413
2021 doi
-
[113]
E., van Dokkum, P
Whitaker, K. E., van Dokkum, P. G., Brammer, G., & Franx, M.\ 2012, , 754, L29
2012
-
[114]
E., Franx M., Leja J., van Dokkum P
Whitaker K. E., Franx M., Leja J., van Dokkum P. G., Henry A., Skelton R. E., Fumagalli M., et al., 2014, ApJ, 795, 104. doi:10.1088/0004-637X/795/2/104
2014 doi
-
[115]
H., Jarvis M
Whittam I. H., Jarvis M. J., Hale C. L., Prescott M., Morabito L. K., Heywood I., Adams N. J., et al., 2022, MNRAS, 516, 245. doi:10.1093/mnras/stac2140
2022 doi
-
[116]
W., Schawinski K., Simmons B
Willett K. W., Schawinski K., Simmons B. D., Masters K. L., Skibba R. A., Kaviraj S., Melvin T., et al., 2015, MNRAS, 449, 820. doi:10.1093/mnras/stv307 mnras
2015 doi
-
[117]
write newline
" write newline "" before.all 'output.state := FUNCTION fin.entry write newline FUNCTION new.block output.state before.all = 'skip after.block 'output.state := if FUNCTION new.sentence output.state after.block = 'skip output.state before.all = 'skip after.sentence 'output.stat...
Reviewed August 7, 2026 · model on record in the stance chip above.
Discussion (0). Continue with ORCID to comment.