REVIEW 3 major objections 7 minor 3 cited by
Introducing the AIDA-TNG project: galaxy formation in alternative dark matter models
T0 review · 3 major / 7 minor · reviewed 2026-08-10 · deepseek-v4-flash
Pith's one-line read This paper introduces the AIDA-TNG simulation suite and argues that a galaxy formation model calibrated on cold dark matter still yields a realistic galaxy population when the dark matter is warm or self-interacting.
desk verdict A well-executed simulation resource that will become a benchmark, but the 'realistic in all scenarios' claim outruns the evidence—similarity across one code's runs is not yet a physical result. read the letter →
The pith
A machine-rendered reading of the paper's core claim, the machinery that carries it, and where it could break.
The reading
What carries the argument
The central object is the AIDA-TNG simulation suite: 51.7 and 110.7 Mpc cosmological boxes, each run with the AREPO magnetohydrodynamic code, the IllustrisTNG galaxy formation model left entirely unchanged, and six dark matter models—CDM, three WDM masses (1, 3, 5 keV), and two SIDM cross-sections (constant $\sigma/m=1\,\mathrm{cm}^2\,\mathrm{g}^{-1}$ and a velocity-dependent model). Two features carry the argument: matched initial conditions taken from TNG50 and TNG100, so any difference between models is caused by dark matter physics, and paired dark-matter-only and full-physics runs, which let the authors factor baryonic feedback out of the comparison. The WDM models are imposed through a transfer-function suppression of the initial power spectrum with a half-mode mass for each particle mass, while the SIDM models use the Monte Carlo scattering scheme in AREPO.
What would settle it
Take the WDM3 and SIDM1 boxes and re-run them with the TNG feedback parameters varied by a factor of two (for example, doubling or halving the galactic wind energy). If the resulting changes in stellar mass fractions or galaxy sizes are as large as the dark-matter-driven differences, the unchanged-model comparison cannot isolate dark matter physics, and the central claim fails; on the observational side, a survey search for the predicted roughly 20 percent larger SIDM galaxies at fixed stellar mass would provide a direct test.
Extended reading notes
Core claim
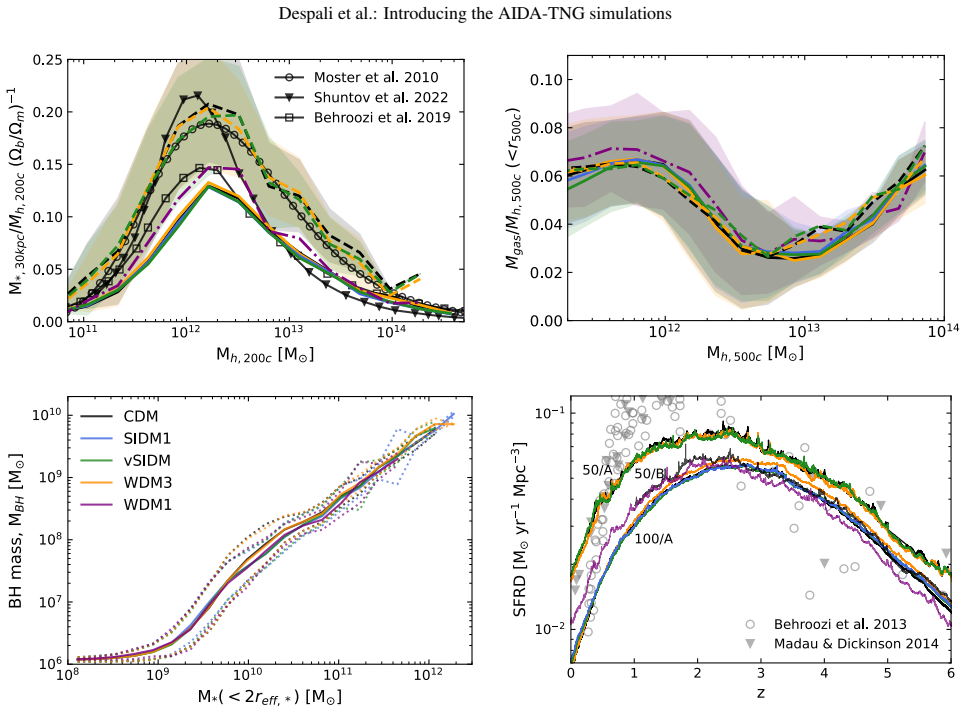
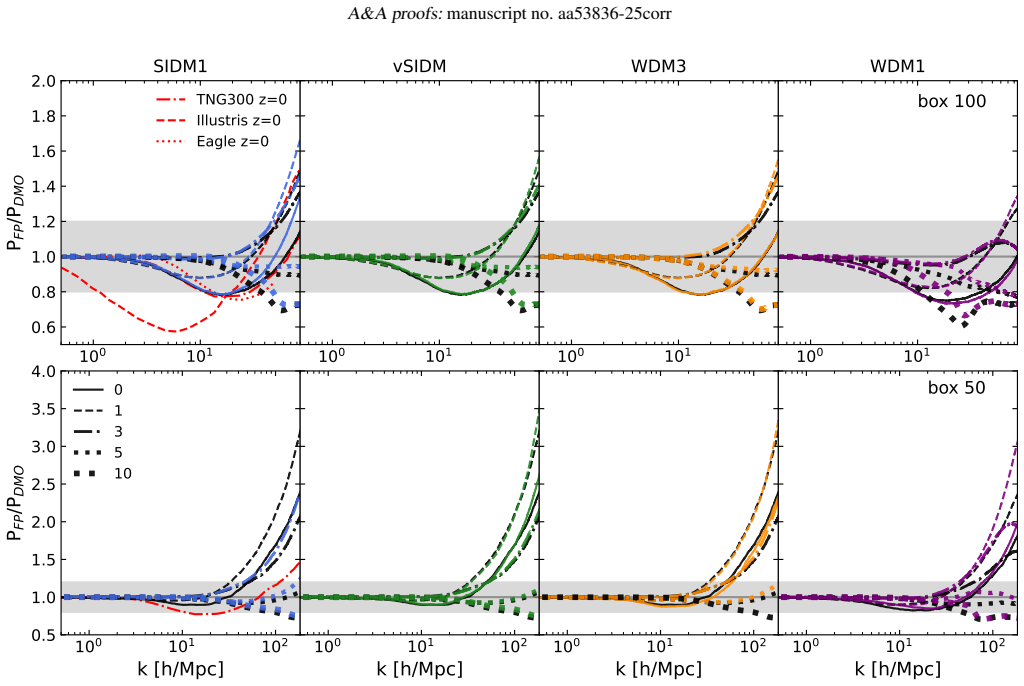
The core claim is that the redshift-zero galaxy population produced by the IllustrisTNG galaxy formation model is statistically indistinguishable in its global scaling relations across CDM, WDM (1, 3, 5 keV), and SIDM (constant and velocity-dependent cross-sections), even though the model was tuned on CDM alone. The paper supports this by comparing matched cosmological boxes in dark-matter-only and full-physics versions of each model, and by measuring the halo mass function, stellar mass function, stellar and gas mass fractions, SMBH–stellar mass relation, and star formation rate density. It reports that all these quantities agree closely across scenarios, with the largest deviations in the 1 keV warm model, which is already excluded by other observations. The paper also reports that the differences that do survive are structural: WDM suppresses low-mass halo counts and lowers central densities at the low-mass end, while SIDM erodes central cusps at the high-mass end, and SIDM galaxies have stellar half-mass radii about 20 percent larger than CDM at fixed stellar mass. On scales below about 1 Mpc, the matter power spectrum is suppressed in all models, but WDM and SIDM reach that suppression from opposite directions—WDM from the initial power-spectrum cut-off, SIDM from late-time core formation.
Load-bearing premise
The load-bearing premise, stated in Section 2.3, is that the TNG galaxy formation model, tuned on cold dark matter, also governs gas cooling, star formation, and black hole feedback correctly inside haloes whose dark matter is warm or self-interacting—so the similar galaxy properties are physical insensitivity, not an artifact of a rigid subgrid model.
Editorial extensions
If this is right
- Observers can use TNG-based mock galaxy populations to test warm and self-interacting dark matter without first re-calibrating the baryon model for each scenario.
- Baryonic effects on halo counts and the small-scale matter power spectrum can be treated as approximately universal across these dark matter models, so dark-matter-only predictions can be corrected by a single baryonic transfer function.
- Self-interacting dark matter predicts a measurable population of galaxies roughly 20 percent larger at fixed stellar mass in the range $5\times10^9$ to $10^{12}\,M_\odot$, a signature that large imaging surveys can look for directly.
- Warm and self-interacting dark matter should be sought in halo structure and small-scale clustering, not in global galaxy scaling relations: SIDM cores at high halo masses, WDM cores and missing haloes at low masses.
Reading between the lines
- An implication of the paper's set-up is that observational tensions between CDM and galaxy scaling relations are unlikely to be resolved by switching to these WDM or SIDM models, since the same baryon recipe reproduces the same galaxy population in all of them; tensions would have to come from structural or small-scale data.
- The near-universality of baryonic effects suggests a practical shortcut the authors do not spell out: a single baryonic correction fitted in CDM could be applied to dark-matter-only predictions in any of these dark matter models, as long as structural differences are treated separately.
- If the SIDM galaxy-size signal survives comparison with surveys, it provides a way to break degeneracies with baryonic feedback, which also inflates galaxy sizes; the two effects could be separated by combining size data with central dark matter densities.
- The velocity-dependent SIDM model's smaller cores at cluster masses imply that cluster-scale constraints on constant cross-sections may not transfer directly to velocity-dependent models, pointing to dwarf-scale structure as the discriminating regime.
Editorial analysis
A structured set of objections, weighed in public.
Referee Report
Summary. The paper introduces the AIDA-TNG project, a suite of cosmological magnetohydrodynamic simulations run with the Arepo code and the IllustrisTNG galaxy formation model, in cold dark matter (CDM), three warm dark matter (WDM) models with particle masses 1, 3, and 5 keV, and two self-interacting dark matter (SIDM) models with constant (1 cm^2/g) and velocity-dependent (Correa 2021) cross-sections. Each model is run as dark-matter-only and full-physics versions of two cosmological boxes, 110.7 and 51.7 Mpc, at two resolution levels, using the same initial conditions as the corresponding TNG100 and TNG50 runs. The paper presents first results on the halo mass function and its redshift evolution, the stellar mass function, halo density profiles, the concentration-mass relation, galaxy scaling relations (stellar mass-halo mass, gas fraction, SMBH mass, star formation rate density, galaxy sizes), and the matter power spectrum. The central claim is that, despite the TNG subgrid model being calibrated on CDM, galaxy properties such as stellar and gas mass fractions, stellar mass function, SMBH masses, and SFRD are very similar across all dark matter scenarios, while differences appear in halo structure (cores, concentrations) and galaxy sizes (SIDM galaxies about 20 percent larger).
Significance. If the results hold, AIDA-TNG will be a valuable community resource: it combines cosmological volumes, a well-tested baryonic model, and multiple dark matter alternatives in matched initial conditions, with DMO/FP pairs that allow baryonic and dark-matter effects to be separated. Strengths of the paper include the transparent description of initial conditions, resolution limits, and artificial-fragmentation masking for WDM; the use of existing TNG initial conditions for controlled comparisons; and the public availability of the data. The conclusion that global galaxy properties are insensitive to the dark matter model is interesting and, if correct, has practical importance for interpreting observations. However, the paper's strongest claim, that the TNG model 'can produce a realistic galaxy population in all scenarios,' rests on the untested transferability of a CDM-calibrated subgrid model to altered dark-matter potentials, and this assumption is acknowledged but not independently validated.
major comments (3)
- [Abstract; Section 5; Section 2.3] The central claim that the TNG galaxy formation model 'can produce a realistic galaxy population in all scenarios' is stronger than the presented evidence. The evidence in Figs. 9 and 13 shows that one subgrid model (TNG) yields similar galaxy properties across the AIDA runs, but this similarity cannot by itself distinguish a physically robust insensitivity from a subgrid model that is too rigid to respond to changes in halo potential. The paper states in Sec. 2.3 that the TNG model is kept entirely unchanged; this is a reasonable design choice for a first study, but the 'realistic' conclusion requires either a quantitative observational test in the mass range where ADM actually changes halo structure (e.g., M_vir < 1e11 Msun for WDM3/WDM1 or the dwarf regime for SIDM), or an explicit statement that the conclusion is conditional on the TNG subgrid model remaining valid. The paper's own comparison in Sec. 4.1 to EAGLE-based SIDM simulations shows that baryonic response differs between galaxy formation models at 1e12-1e13 Msun, so the result is not known to be galaxy-formation-model independent. Please either soften the claim to 'consistent with the TNG subgrid model remaining approximately valid' or add the missing quantitative test.
- [Abstract; Table 1; Section 2.1] The abstract claims that the TNG model produces a realistic galaxy population in all scenarios, but the full-physics runs do not include WDM5. Table 1 shows no FP WDM5 run in any of the presented boxes, and Sec. 2.1 states that a FP version of the 50/A WDM5 box was deliberately not created. Thus the galaxy-population similarity is not simulated for the 5 keV WDM model; it is inferred from the DMO run being close to CDM. This is a load-bearing gap for the 'all scenarios' phrasing. Please either add a full-physics WDM5 run (even at lower resolution) or restrict the conclusion to the scenarios for which full-physics runs exist.
- [Section 3; Figure 8] The WDM1 FP/DMO halo mass function ratio at z >= 2 shows a low-mass excess that the authors themselves attribute to a possible effect of artificial fragmentation ('this could be a non-trivial consequence of artificial fragmentation'). Since the paper only masks haloes below M_lim rather than removing spurious haloes, the low-mass behaviour in Fig. 8 for WDM1 is not quantitatively robust. This matters because the paper uses Fig. 8 to argue that baryonic effects on the halo mass function are similar across dark matter models. Applying the Lovell et al. (2014) sphericity-based spurious-halo removal, or at least showing the ratio with and without haloes below M_lim, would strengthen this specific conclusion.
minor comments (7)
- [Abstract; Section 3] The abstract states that the simulations resolve haloes down to 10^8 Msun, but the mass functions in Fig. 6 use a 100-particle limit and the lowest 50/A dark matter particle mass gives 100*m_DM ~ 4e8 Msun; please reconcile the quoted mass range with the actual resolution limit.
- [Section 1] The text uses 'WIMPS'; the correct acronym is 'WIMPs'.
- [Section 2] The phrase 'a economic use' should be 'an economic use'.
- [Section 2.1] The paper quotes half-mode masses for the WDM models but does not provide the computed M_lim values for each run; a small table or appendix listing M_lim per box and resolution would help readers interpret the dashed-line regions in Fig. 6.
- [Figure 13] In the bottom-left panel, the caption says 'The dotted lines mark the 1σ region' but it is unclear whether this is the scatter of the simulations or an observational reference; please specify.
- [Figure 14] The caption notes that observed sizes are projected half-light radii while simulated sizes are 3D half-mass radii, but the text should reiterate this caveat because it directly affects the interpretation of the ~20% size difference.
- [Section 6.2] The description of the vSIDM model as having a cross-section 'inversely proportional to the relative velocity' is a simplification; the Correa (2021) model has a more specific velocity dependence, so please rephrase to avoid implying a pure 1/v scaling.
Circularity Check
No significant circularity: AIDA-TNG measures the response of an unchanged CDM-calibrated model to externally specified dark matter physics.
full rationale
The paper's load-bearing chain is feed-forward rather than circular. The WDM transfer function (Eq. 1) and the SIDM cross-sections are adopted from the literature (Bode et al. 2001; Viel et al. 2005; Correa 2021) as input physics; the halo mass functions, density profiles, concentration-mass relations, and galaxy properties are measured simulation outputs, not parameters fitted to those outputs. The unchanged TNG subgrid model (Sec. 2.3) is a fixed, externally validated code; running it in WDM and SIDM potentials and finding similar stellar/gas mass fractions, stellar mass function, SMBH masses, and SFRD is a genuine extrapolation, because the TNG calibration data did not include ADM runs and the similarity is not enforced by construction. The comparisons to the Lovell et al. (2014) suppression formula and the Despali et al. (2016) mass function are consistency checks against external fitting functions. The fit of the CDM full-physics mass-function slope (alpha = -0.82) is only a baseline for comparing ADM counts and does not enter the ADM measurements themselves. Self-citations to TNG validation papers support the realism premise, but the central ADM claim rests on new simulation measurements and qualitative external observational comparisons; no uniqueness theorem, ansatz, or renamed known result is involved. The robustness concern that a rigid subgrid model could mask dark matter effects is a validity caveat, not circular reasoning.
Assumptions & free parameters
free parameters (4)
- WDM thermal relic masses =
1, 3, and 5 keV
- SIDM constant cross-section sigma/m =
1 cm^2/g
- vSIDM velocity-dependent cross-section parameters =
normalized to sigma/m ~ 100 cm^2/g at low velocities (Correa 2021)
- TNG subgrid model parameters =
fixed to IllustrisTNG calibration values (Weinberger et al. 2017; Pillepich et al. 2018b)
assumptions (4)
- domain assumption The Bode et al. (2001) transfer function with nu=1.2, gX=1.5 maps WDM particle mass to an initial power spectrum suppression.
- domain assumption Self-interactions do not affect the initial power spectrum, so SIDM runs share CDM initial conditions.
- ad hoc to paper The IllustrisTNG subgrid model, calibrated for CDM, remains applicable in WDM and SIDM universes without recalibration.
- domain assumption Haloes below the Wang and White (2007) limiting mass Mlim are unreliable due to artificial fragmentation.
Cite this review
Pith. "Pith review of Introducing the AIDA-TNG project: galaxy formation in alternative dark matter models." pith.science (2026). https://pith.science/paper/62ITIFTX
@misc{pith2026250112439,
  author       = {Pith},
  title        = {Pith review of: Introducing the AIDA-TNG project: galaxy formation in alternative dark matter models},
  year         = {2026},
  howpublished = {\url{https://pith.science/paper/62ITIFTX}},
  note         = {Machine review of arXiv:2501.12439}
}
abstract
We introduce the AIDA-TNG project, a suite of cosmological magnetohydrodynamic simulations that simultaneously model galaxy formation and different variations of the underlying dark matter model. We consider the standard cold dark matter model and five variations, including three warm dark matter scenarios and two self-interacting models with constant or velocity-dependent cross-section. In each model, we simulate two cosmological boxes of 51.7 and 110.7 Mpc on a side, with the same initial conditions as TNG50 and TNG100, and combine the variations in the physics of dark matter with the fiducial IllustrisTNG galaxy formation model. The AIDA-TNG runs are thus ideal for studying the simultaneous effect of baryons and alternative dark matter models on observable properties of galaxies and large-scale structures. We resolve haloes in the range between $10^{8}$ and $4\times10^{14}\,$M$_{\odot}$ and scales down to the nominal resolution of 570 pc in the highest resolution runs. This work presents the first results on statistical quantities such as the halo mass function and the matter power spectrum; we quantify the modification in the number of haloes and the power on scales smaller than 1 Mpc, due to the combination of baryonic and dark matter physics. Despite being calibrated on cold dark matter, we find that the TNG galaxy formation model can produce a realistic galaxy population in all scenarios. The stellar and gas mass fraction, stellar mass function, black hole mass as a function of stellar mass and star formation rate density are very similar in all dark matter models, with some deviations only in the most extreme warm dark matter model. Finally, we also quantify changes in halo structure due to warm and self-interacting dark matter, which appear in the density profiles, concentration-mass relation and galaxy sizes.
Figures


Figures from the paper (15 more)






Forward citations
Cited by 3 Pith papers
-
COZMIC. III. Cosmological Zoom-in Simulations of Self-interacting Dark Matter with Suppressed Initial Conditions
Cosmological zoom-in simulations show that suppressing the small-scale matter power spectrum, as expected in self-interacting dark matter models, reduces or erases the gravothermal core-collapse signature in dwarf-mass halos.
-
A Novel Implementation of Self-Interacting Dark Matter in AREPO
A dedicated-tree Monte-Carlo SIDM module in AREPO-2 conserves energy/momentum under multiple scatters, supports velocity-dependent and inelastic models, and runs with only modest overhead versus CDM except in late cor...
-
Strong-lensing Perturber Signatures in Self-interacting Dark Matter Simulations
Core-collapsed self-interacting dark matter halos in the Concerto simulations reach high enough central densities to match the perturbing masses inferred in J0946, B1938, SDP.81, and SPT2147-50.
Reference graph
Works this paper leans on
- [1]
-
[2]
C., Nightingale, J., He, Q., et al
Amorisco, N. C., Nightingale, J., He, Q., et al. 2022, MNRAS, 510, 2464
2022
-
[3]
E., Springel, V ., White, S
Angulo, R. E., Springel, V ., White, S. D. M., et al. 2012, MNRAS, 426, 2046
2012
-
[4]
W., Treu, T., Gavazzi, R., et al
Auger, M. W., Treu, T., Gavazzi, R., et al. 2010, ApJ, 721, L163 Bahé, Y . M., Schaye, J., Schaller, M., et al. 2022, MNRAS, 516, 167
2010
-
[5]
J., Enzi, W
Ballard, D. J., Enzi, W. J. R., Collett, T. E., Turner, H. C., & Smith, R. J. 2024, MNRAS, 528, 7564
2024
-
[6]
2015, The Astrophysical Jour- nal, 807, 50
Bechtol, K., Drlica-Wagner, A., Balbinot, E., et al. 2015, The Astrophysical Jour- nal, 807, 50
2015
-
[7]
H., Hearin, A
Behroozi, P., Wechsler, R. H., Hearin, A. P., & Conroy, C. 2019, MNRAS, 488, 3143
2019
-
[8]
S., Wechsler, R
Behroozi, P. S., Wechsler, R. H., & Wu, H.-Y . 2013, ApJ, 762, 109
2013
Show all 112 references
-
[9]
2015, py-sphviewer: Py-SPHViewer v1.0.0
Benitez-Llambay, A. 2015, py-sphviewer: Py-SPHViewer v1.0.0
2015
-
[10]
K., et al
Bernardi, M., Meert, A., Sheth, R. K., et al. 2013, MNRAS, 436, 697
2013
-
[11]
2022, ApJ, 932, 30
Bhattacharyya, J., Adhikari, S., Banerjee, A., et al. 2022, ApJ, 932, 30
2022
-
[12]
P., & Turok, N
Bode, P., Ostriker, J. P., & Turok, N. 2001, ApJ, 556, 93
2001
-
[13]
M., et al
Borrow, J., Schaller, M., Bahé, Y . M., et al. 2023, MNRAS, 526, 2441
2023
-
[14]
A., Frenk, C
Bose, S., Hellwing, W. A., Frenk, C. S., et al. 2016, MNRAS, 455, 318
2016
-
[15]
S., & Kaplinghat, M
Boylan-Kolchin, M., Bullock, J. S., & Kaplinghat, M. 2011, MNRAS, 415, L40
2011
-
[16]
M., Kuhlen, M., Zolotov, A., & Hooper, D
Brooks, A. M., Kuhlen, M., Zolotov, A., & Hooper, D. 2013, ApJ, 765, 22
2013
-
[17]
Bryan, G. L. & Norman, M. L. 1998, ApJ, 495, 80
1998
-
[18]
Bullock, J. S. & Boylan-Kolchin, M. 2017, ARA&A, 55, 343
2017
-
[19]
2024, arXiv e-prints, arXiv:2403.09186
Correa, C., Schaller, M., Schaye, J., et al. 2024, arXiv e-prints, arXiv:2403.09186
2024 arXiv
-
[20]
Correa, C. A. 2021, MNRAS, 503, 920
2021
-
[21]
A., Schaller, M., Ploeckinger, S., et al
Correa, C. A., Schaller, M., Ploeckinger, S., et al. 2022, MNRAS, 517, 3045
2022
-
[22]
V ., et al
Creasey, P., Sameie, O., Sales, L. V ., et al. 2017, MNRAS, 468, 2283
2017
-
[23]
E., et al
Despali, G., Giocoli, C., Angulo, R. E., et al. 2016, MNRAS, 456, 2486
2016
-
[24]
M., Fassnacht, C
Despali, G., Heinze, F. M., Fassnacht, C. D., et al. 2024, arXiv e-prints, submitted to A&A under review, arXiv:2407.12910
2024 arXiv
-
[25]
A., & Oppenheimer, B
Despali, G., Lovell, M., Vegetti, S., Crain, R. A., & Oppenheimer, B. D. 2020, MNRAS, 491, 1295
2020
-
[26]
2019, MNRAS, 484, 4563
Despali, G., Sparre, M., Vegetti, S., et al. 2019, MNRAS, 484, 4563
2019
-
[27]
& Vegetti, S
Despali, G. & Vegetti, S. 2017, MNRAS, 469, 1997
2017
-
[28]
G., Vegetti, S., et al
Despali, G., Walls, L. G., Vegetti, S., et al. 2022, MNRAS, 516, 4543
2022
-
[29]
2018, ApJS, 239, 35
Diemer, B. 2018, ApJS, 239, 35
2018
-
[30]
2015, The Astrophysical Jour- nal, 813, 109
Drlica-Wagner, A., Bechtol, K., Rykoff, E., et al. 2015, The Astrophysical Jour- nal, 813, 109
2015
-
[31]
2022, A&A, 666, A41
Eckert, D., Ettori, S., Robertson, A., et al. 2022, A&A, 666, A41
2022
-
[32]
1965, Trudy Astrofizicheskogo Instituta Alma-Ata, 5, 87
Einasto, J. 1965, Trudy Astrofizicheskogo Instituta Alma-Ata, 5, 87
1965
-
[33]
2021, MNRAS, 506, 5848
Enzi, W., Murgia, R., Newton, O., et al. 2021, MNRAS, 506, 5848
2021
-
[34]
Enzi, W. J. R., Krawczyk, C. M., Ballard, D. J., & Collett, T. E. 2024, arXiv e-prints, submitted to MNRAS, arXiv:2411.08565
2024 arXiv
-
[35]
S., Brüggen, M., Schmidt-Hoberg, K., et al
Fischer, M. S., Brüggen, M., Schmidt-Hoberg, K., et al. 2022, MNRAS, 516, 1923
2022
-
[36]
S., Kasselmann, L., Brüggen, M., et al
Fischer, M. S., Kasselmann, L., Brüggen, M., et al. 2024, MNRAS, 529, 2327 Forouhar Moreno, V . J., Benítez-Llambay, A., Cole, S., & Frenk, C. 2022, MN- RAS, 517, 5627
2024
-
[37]
B., Governato, F., Pontzen, A., et al
Fry, A. B., Governato, F., Pontzen, A., et al. 2015, MNRAS, 452, 1468
2015
-
[38]
R., Millman, K
Harris, C. R., Millman, K. J., van der Walt, S. J., et al. 2020, Nature, 585, 357
2020
-
[39]
A., Schaller, M., Frenk, C
Hellwing, W. A., Schaller, M., Frenk, C. S., et al. 2016, MNRAS, 461, L11
2016
-
[40]
F., Wetzel, A., Kereš, D., et al
Hopkins, P. F., Wetzel, A., Kereš, D., et al. 2018, MNRAS, 480, 800
2018
-
[41]
Hunter, J. D. 2007, Computing In Science & Engineering, 9, 90 Iršiˇc, V ., Viel, M., Haehnelt, M. G., et al. 2024, Phys. Rev. D, 109, 043511
2007
-
[42]
2022, MNRAS, 511, 4005
Kannan, R., Garaldi, E., Smith, A., et al. 2022, MNRAS, 511, 4005
2022
-
[43]
E., Linden, T., & Yu, H.-B
Kaplinghat, M., Keeley, R. E., Linden, T., & Yu, H.-B. 2014, Physical Review Letters, 113, 021302 Article number, page 19 of 20 A&A proofs:manuscript no. aa53836-25corr
2014
-
[44]
Kaplinghat, M., Ren, T., & Yu, H.-B. 2020, J. Cosmology Astropart. Phys., 2020, 027
2020
-
[45]
Y ., Peter, A
Kim, S. Y ., Peter, A. H. G., & Hargis, J. R. 2018, Phys. Rev. Lett., 121, 211302
2018
-
[46]
V ., Valenzuela, O., & Prada, F
Klypin, A., Kravtsov, A. V ., Valenzuela, O., & Prada, F. 1999, ApJ, 522, 82
1999
-
[47]
& Shapiro, P
Koda, J. & Shapiro, P. R. 2011, MNRAS, 415, 1125
2011
-
[48]
E., Genel, S., Wandelt, B
Lee, M. E., Genel, S., Wandelt, B. D., et al. 2024, ApJ, 968, 11
2024
-
[49]
2000, Astrophys
Lewis, A., Challinor, A., & Lasenby, A. 2000, Astrophys. J., 538, 473
2000
-
[50]
Lovell, M. R. 2020, MNRAS, 493, L11
2020
-
[51]
Lovell, M. R. 2024, MNRAS, 527, 3029
2024
-
[52]
R., Eke, V ., Frenk, C
Lovell, M. R., Eke, V ., Frenk, C. S., et al. 2012, MNRAS, 420, 2318
2012
-
[53]
R., Frenk, C
Lovell, M. R., Frenk, C. S., Eke, V . R., et al. 2014, MNRAS, 439, 300
2014
-
[54]
R., Pillepich, A., Genel, S., et al
Lovell, M. R., Pillepich, A., Genel, S., et al. 2018, MN- RAS[arXiv:1801.10170]
2018 arXiv
-
[55]
D., Bose, S., Angulo, R
Ludlow, A. D., Bose, S., Angulo, R. E., et al. 2016, MNRAS, 460, 1214
2016
-
[56]
& Dickinson, M
Madau, P. & Dickinson, M. 2014, ARA&A, 52, 415
2014
-
[57]
2018, MNRAS, 480, 5113
Marinacci, F., V ogelsberger, M., Pakmor, R., et al. 2018, MNRAS, 480, 5113
2018
-
[58]
2023, MNRAS, 524, 1515
Mastromarino, C., Despali, G., Moscardini, L., et al. 2023, MNRAS, 524, 1515
2023
-
[59]
2023, A&A, 678, L2
Meneghetti, M., Cui, W., Rasia, E., et al. 2023, A&A, 678, L2
2023
-
[60]
2020, Science, 369, 1347
Meneghetti, M., Davoli, G., Bergamini, P., et al. 2020, Science, 369, 1347
2020
-
[61]
2001, MNRAS, 325, 435
Meneghetti, M., Yoshida, N., Bartelmann, M., et al. 2001, MNRAS, 325, 435
2001
-
[62]
E., Kaplinghat, M., & Li, N
Minor, Q. E., Kaplinghat, M., & Li, N. 2017, ApJ, 845, 118
2017
-
[63]
P., Somerville, R
Moster, B. P., Somerville, R. S., Maulbetsch, C., et al. 2010, ApJ, 710, 903
2010
-
[64]
O., Birrer, S., Gilman, D., et al
Nadler, E. O., Birrer, S., Gilman, D., et al. 2021, ApJ, 917, 7
2021
-
[65]
O., Yang, D., & Yu, H.-B
Nadler, E. O., Yang, D., & Yu, H.-B. 2023, ApJ, 958, L39
2023
-
[66]
P., Pillepich, A., Springel, V ., et al
Naiman, J. P., Pillepich, A., Springel, V ., et al. 2018, MNRAS, 477, 1206
2018
-
[67]
F., Frenk, C
Navarro, J. F., Frenk, C. S., & White, S. D. M. 1996, ApJ, 462, 563
1996
-
[68]
2018, MNRAS, 477, 450
Nelson, D., Kauffmann, G., Pillepich, A., et al. 2018, MNRAS, 477, 450
2018
-
[69]
2024, A&A, 686, A157
Nelson, D., Pillepich, A., Ayromlou, M., et al. 2024, A&A, 686, A157
2024
-
[70]
2019, Computational Astrophysics and Cosmology, 6, 2
Nelson, D., Springel, V ., Pillepich, A., et al. 2019, Computational Astrophysics and Cosmology, 6, 2
2019
-
[71]
A., Frenk, C
Oman, K. A., Frenk, C. S., Crain, R. A., Lovell, M. R., & Pfeffer, J. 2024, MN- RAS, 533, 67 O’Neil, S., V ogelsberger, M., Heeba, S., et al. 2023, MNRAS, 524, 288
2024
-
[72]
P., et al
Pakmor, R., Springel, V ., Coles, J. P., et al. 2023, MNRAS, 524, 2539
2023
-
[73]
Peter, A. H. G., Rocha, M., Bullock, J. S., & Kaplinghat, M. 2013, MNRAS, 430, 105
2013
-
[74]
2019, MNRAS, 490, 3196
Pillepich, A., Nelson, D., Springel, V ., et al. 2019, MNRAS, 490, 3196
2019
-
[75]
2018b, MNRAS, 473, 4077 Planck Collaboration, Ade, P
Pillepich, A., Springel, V ., Nelson, D., et al. 2018b, MNRAS, 473, 4077 Planck Collaboration, Ade, P. A. R., Aghanim, N., et al. 2014, A&A, 571, A1 Planck Collaboration, Ade, P. A. R., Aghanim, N., et al. 2016, A&A, 594, A24
2014
-
[76]
F., Jenkins, A., et al
Power, C., Navarro, J. F., Jenkins, A., et al. 2003, MNRAS, 338, 14
2003
-
[77]
2022, A&A, 665, A16
Ragagnin, A., Meneghetti, M., Bassini, L., et al. 2022, A&A, 665, A16
2022
-
[78]
2024, A&A, 687, A270
Ragagnin, A., Meneghetti, M., Calura, F., et al. 2024, A&A, 687, A270
2024
-
[79]
2019, MNRAS, 488, 3646
Robertson, A., Harvey, D., Massey, R., et al. 2019, MNRAS, 488, 3646
2019
-
[80]
2021, MNRAS, 501, 4610
Robertson, A., Massey, R., Eke, V ., Schaye, J., & Theuns, T. 2021, MNRAS, 501, 4610
2021
-
[81]
2018, MNRAS, 476, L20
Robertson, A., Massey, R., Eke, V ., et al. 2018, MNRAS, 476, L20
2018
-
[82]
H., Bullock, J
Robles, V . H., Bullock, J. S., Elbert, O. D., et al. 2017, MNRAS, 472, 2945
2017
-
[83]
Rocha, M., Peter, A. H. G., Bullock, J. S., et al. 2013, MNRAS, 430, 81
2013
-
[84]
C., Torrey, P., V ogelsberger, M., & O’Neil, S
Rose, J. C., Torrey, P., V ogelsberger, M., & O’Neil, S. 2023, MNRAS, 519, 5623
2023
-
[85]
R., La Barbera, F., et al
Roy, N., Napolitano, N. R., La Barbera, F., et al. 2018, MNRAS, 480, 1057
2018
-
[86]
2018, MNRAS, 479, 359
Sameie, O., Creasey, P., Yu, H.-B., et al. 2018, MNRAS, 479, 359
2018
-
[87]
W., et al
Schaller, M., Borrow, J., Draper, P. W., et al. 2024, MNRAS, 530, 2378
2024
-
[88]
A., Bower, R
Schaye, J., Crain, R. A., Bower, R. G., et al. 2015, MNRAS, 446, 521
2015
-
[89]
E., Macciò, A
Schneider, A., Smith, R. E., Macciò, A. V ., & Moore, B. 2012, MNRAS, 424, 684
2012
-
[90]
J., White, S
Shen, S., Mo, H. J., White, S. D. M., et al. 2003, MNRAS, 343, 978
2003
-
[91]
2024, MNRAS, 527, 2835
Shen, X., Borrow, J., V ogelsberger, M., et al. 2024, MNRAS, 527, 2835
2024
-
[92]
2022, MNRAS, 516, 1302
Shen, X., Brinckmann, T., Rapetti, D., et al. 2022, MNRAS, 516, 1302
2022
-
[93]
J., Gavazzi, R., et al
Shuntov, M., McCracken, H. J., Gavazzi, R., et al. 2022, A&A, 664, A61
2022
-
[94]
2024, MNRAS[arXiv:2409.01758]
Sorini, D., Bose, S., Pakmor, R., et al. 2024, MNRAS[arXiv:2409.01758]
2024 arXiv
-
[95]
2005, MNRAS, 364, 1105
Springel, V . 2005, MNRAS, 364, 1105
2005
-
[96]
2010, MNRAS, 401, 791
Springel, V . 2010, MNRAS, 401, 791
2010
-
[97]
& Hernquist, L
Springel, V . & Hernquist, L. 2003, MNRAS, 339, 289
2003
-
[98]
2018, MNRAS, 475, 676
Springel, V ., Pakmor, R., Pillepich, A., et al. 2018, MNRAS, 475, 676
2018
-
[99]
Springel, V ., White, S. D. M., Jenkins, A., et al. 2005, Nature, 435, 629 Stücker, J., Angulo, R. E., Hahn, O., & White, S. D. M. 2022, MNRAS, 509, 1703
2005
-
[100]
2014, MNRAS, 438, 1985
Torrey, P., V ogelsberger, M., Genel, S., et al. 2014, MNRAS, 438, 1985
2014
-
[101]
& Yu, H.-B
Tulin, S. & Yu, H.-B. 2018, Physics Reports, 730, 1
2018
-
[102]
C., Lovell, M
Turner, H. C., Lovell, M. R., Zavala, J., & V ogelsberger, M. 2021, MNRAS, 505, 5327
2021
-
[103]
& Koopmans, L
Vegetti, S. & Koopmans, L. V . E. 2009, MNRAS, 392, 945
2009
-
[104]
G., Matarrese, S., & Riotto, A
Viel, M., Lesgourgues, J., Haehnelt, M. G., Matarrese, S., & Riotto, A. 2005, Physical Review D, 71, 063534 V ogelsberger, M., Genel, S., Springel, V ., et al. 2014, MNRAS, 444, 1518 V ogelsberger, M., Zavala, J., Cyr-Racine, F.-Y ., et al. 2016, MNRAS, 460, 1399 V ogelsberger...
2005
-
[105]
& White, S
Wang, J. & White, S. D. M. 2007, MNRAS, 380, 93
2007
-
[106]
2017, MNRAS, 465, 3291
Weinberger, R., Springel, V ., Hernquist, L., et al. 2017, MNRAS, 465, 3291
2017
-
[107]
H., Robotham, A
Wright, A. H., Robotham, A. S. G., Driver, S. P., et al. 2017, MNRAS, 470, 283
2017
-
[108]
O., & Yu, H.-B
Yang, D., Nadler, E. O., & Yu, H.-B. 2023, The Astrophysical Journal, 949, 67
2023
-
[109]
& Yu, H.-B
Yang, D. & Yu, H.-B. 2021, Phys. Rev. D, 104, 103031
2021
-
[110]
& Frenk, C
Zavala, J. & Frenk, C. S. 2019, Galaxies, 7, 81
2019
-
[111]
Zavala, J., V ogelsberger, M., & Walker, M. G. 2013, MNRAS, 431, L20
2013
-
[112]
2023, MNRAS, 526, 758 Article number, page 20 of 20
Zhong, Y .-M., Yang, D., & Yu, H.-B. 2023, MNRAS, 526, 758 Article number, page 20 of 20
2023
Reviewed August 10, 2026 · model on record in the stance chip above.
Discussion (0). Continue with ORCID to comment.