REVIEW 2 major objections 5 minor 56 references
A Design Space for Quantum Circuit Visualizations
T0 review · 2 major / 5 minor · reviewed 2026-07-31 · deepseek-v4-flash
Pith's one-line read This paper establishes a design space for quantum circuit visualizations, organizing the diverse encoding choices found across 194 existing examples into five levels: view, component, management, narrative, and interaction.
desk verdict A genuinely new, well-organized design space for quantum circuit visualizations; the categories are credible and useful, though single-coder open coding leaves completeness unproven. read the letter →
The pith
A machine-rendered reading of the paper's core claim, the machinery that carries it, and where it could break.
The reading
What carries the argument
The central object is the design space itself: a five-level taxonomy — view, component, management, narrative, interaction — of the choices a creator faces when making a quantum circuit visualization. It is built from open-coding of 194 examples and includes cross-cutting dimensions such as layout (traditional vs. on-machine) and format (circuit vs. heatmap). The design space does not prescribe good designs; it organizes observed ones, with the aim of giving practitioners a vocabulary and a target for future grammar-based tools.
What would settle it
Survey a fresh set of 50 quantum circuit visualizations from sources outside the original corpus (for example, recent research papers from different venues and documentation from other hardware providers) and open-code them using the paper's taxonomy; if new codes emerge that do not fit any of the five levels, the design space is incomplete. A single clear counterexample — a mainstream quantum circuit visualization whose essential encoding choices cannot be expressed within the design space — would also refute the claim of a comprehensive characterization.
Extended reading notes
Core claim
The central claim is that the range of existing quantum circuit visualizations can be characterized by a structured design space, derived from open-coding a corpus of 182 static and 12 interactive examples collected from tutorials, documentation, research publications, and prior systems. The design space organizes design choices into five groups: view-level decisions (abstraction, composition, layout, format), component-level representations (qubits, gates, measurement, connectivity), management techniques (selection, encoding, data transformation, space management), narrative elements (titles, annotations, emphasis, attachments), and interactions (exploration and composition). The authors a
Load-bearing premise
The load-bearing premise is that the 194 visualizations the authors collected are representative of the full range of quantum circuit visualizations — and that the two authors' open-coding, without inter-rater reliability checks, correctly captured the choices in them.
Editorial extensions
If this is right
- If the design space is accurate, quantum computing practitioners gain a shared vocabulary for describing and comparing circuit visualizations across tools and papers.
- It provides a concrete foundation for building a platform-agnostic visualization grammar, so that encodings and interactions developed in one system can be specified and reused in another.
- The taxonomy highlights underexplored areas — especially interactive and narrative features — that most current toolkits omit, signalling where future systems could add value.
- The analysis connects quantum circuit visualization to established visualization principles (overview+detail, multi-view consistency, collaborative visualization), making research on other spatiotemporal domains transferable.
Reading between the lines
- This design space could be operationalized as a declarative specification language: a user would describe a quantum circuit visualization as a combination of the five choice levels, and a renderer would generate the view independently of the underlying quantum platform.
- The five-level structure may generalize to other program-visualization domains with strict spatial and temporal constraints, such as classical circuit layout or dataflow debugging.
- A concrete test of comprehensiveness would be to have independent coders apply the taxonomy to a fresh set of circuit visualizations and measure inter-rater reliability; the current analysis did not include such a check.
- Because the corpus is static-heavy and interaction cases were drawn from a small set of tools, the interaction level is likely the least mature part of the design space and may need expansion as more interactive systems appear.
Editorial analysis
A structured set of objections, weighed in public.
Referee Report
Summary. This paper presents a design space for quantum circuit visualizations by curating and open-coding 182 static and 12 interactive cases drawn from vendor tutorials/documentation, conferences, research publications, and prior systems. The resulting design space is organized into view-, component-, management-, narrative-, and interaction-level choices, and the authors illustrate how the scheme captures representative examples, relate it to established visualization principles (overview+detail, view consistency, collaborative visualization), and propose future directions toward a platform-agnostic grammar. The paper explicitly frames the corpus as a curated snapshot and restricts scope to gate-based quantum computing.
Significance. If the taxonomy is stable, this would be one of the first systematic, cross-tool design spaces for quantum circuit visualization, with clear utility for future grammar-based systems and for communication between visualization and quantum-computing communities. The paper is transparent about its scope, provides a public design gallery, and the taxonomy is grounded in an external corpus rather than derived from a fitted model, so the circularity concern raised in the stress-test note does not materially apply. The primary risk is methodological: the design space is the central contribution, and its reliability rests on a single-coder open-coding procedure with a self-defined saturation criterion.
major comments (2)
- [§3.2] Coding reliability is load-bearing for the central claim, but the manuscript reports only the authors' three internal review rounds. No inter-rater reliability statistic, independent second coder, or audit of the final codebook is provided. Several categories are interpretive judgments—e.g., 'Abstraction' (programming/presentation/illustration) in §4.2, bit-line 'Dynamicity' in §4.3, and 'Progression' in §4.2—so a second coder applying the same codebook could plausibly draw different boundaries. Since the design space is the paper's contribution, the absence of any reliability evidence leaves the taxonomy potentially reflecting one analyst's lens. The paper should either report an independent coding pass (even on a subset) with agreement measures, or be revised to present the result as an author-curated design vocabulary rather than a validated design space.
- [§3.1] The saturation criterion as stated is internally circular and therefore does not establish completeness. The authors stopped collecting cases 'as we reached a point where we were not adding any new open-coding tags,' but the same people who generated the tags also judged when no new tags appeared. Combined with the acknowledged convenience sampling (vendor tutorials, specific conferences, and Nature journals after January 2025), this stopping rule conflates coder convergence with theoretical saturation. The §7 limitation ('a snapshot based on the corpus curated by us') is welcome, but the abstract and RQ1/RQ2 frame the contribution as 'a design space' without that qualifier. A concrete remedy would be to validate saturation with a held-out set coded blind, or to explicitly downgrade the claim to 'a design vocabulary derived from a convenience sample' throughout the title/abstract.
minor comments (5)
- [§1 contributions] The third bullet says the design space encompasses 'four aspects (view, information, narrative, and interaction),' but Figure 6 and Section 4 describe five levels: view, component, management, narrative, and interaction. Please align the wording.
- [§7] Typo: 'proivde' should be 'provide.'
- [§4.4] Typo: 'techinques' should be 'techniques.'
- [Figure 2] The labels contain the literal text 'uni27E9' instead of rendered angle brackets (⟩). This is likely a rendering/encoding artifact and should be fixed in the camera-ready version.
- [§3.2] The statement that the full codebook is in the Supplementary Material is helpful, but the main text would benefit from a short example of the code consolidation process (e.g., the 'Format' key split described) to make the methodology more self-contained.
Circularity Check
No circular derivation found: the design space is an inductively derived taxonomy from an external corpus, not a prediction fitted to its own inputs.
full rationale
The paper's central artifact is a design space of quantum circuit visualizations, produced by open-coding 182 static and 12 interactive cases collected from tutorials, documentation, publications, presentations, and prior systems (Section 3.1). This is an inductive, qualitative taxonomy rather than a derived prediction: no equation is fitted, no parameter is later 'predicted' from the data that generated it, and no formal uniqueness claim is imported. The categories (view, component, management, narrative, interaction) are consolidated from over 400 open codes and are illustrated with corpus examples (Figures 6-13), so the design space is by construction a summary of the external corpus, not a restatement of any single input. The main self-referential element is the first author's prior Patoka system [22], which is one of 12 interactive cases and is used in Section 5.3 and Figure 1-F as an illustrative example; removing it would not collapse any category. The structure is also informed by earlier surveys including the first author's responsive-visualization paper [23], but that borrowing is acknowledged in Section 3.2 and does not determine the empirical content. The paper itself flags scope limitations in Section 7: the design strategies are 'a snapshot based on the corpus curated by us' and are not claimed to be comprehensive or 'good' designs. Single-coder open-coding and self-defined saturation are validity and robustness concerns, not circularity: they do not make the resulting taxonomy equivalent to any input premise. No load-bearing reduction to the paper's own outputs exists, so the circularity score is 0.
Assumptions & free parameters
assumptions (5)
- domain assumption The collected 182 static + 12 interactive cases are sufficiently representative of quantum circuit visualizations to reach theoretical saturation.
- domain assumption Open-coding and three review rounds yield reliable, consistent categories; no inter-rater reliability was measured.
- domain assumption Quantum circuit visualizations can be treated as spatiotemporal data, with qubit locations as space and operation order as time.
- ad hoc to paper A grammar-based approach is the right future direction for quantum circuit visualization systems.
- ad hoc to paper The five-level structure (view, component, management, narrative, interaction) is a faithful organizational scheme for the design space.
Cite this review
Pith. "Pith review of A Design Space for Quantum Circuit Visualizations." pith.science (2026). https://pith.science/paper/65W5GUFH
@misc{pith2026260724042,
  author       = {Pith},
  title        = {Pith review of: A Design Space for Quantum Circuit Visualizations},
  year         = {2026},
  howpublished = {\url{https://pith.science/paper/65W5GUFH}},
  note         = {Machine review of arXiv:2607.24042}
}
read the original abstract
Quantum circuit visualizations play an essential role in supporting sense-making and communication of quantum programs. While several tools exist for rendering quantum circuits, they vary widely in encoding options due to idiosyncrasies among machine and platform providers. We observe an opportunity to coalesce these disparate rendering approaches under a single, unified grammar to enable consistent, cross-platform enhancement of quantum circuit visualizations. However, it is unclear how to design such a grammar to best support the quantum computing community. Towards this end, we contribute a design space of quantum circuit visualizations by analyzing 182 static and 12 interactive cases collected from online tutorials and documentations, research publications, public presentations, and prior systems. Based on our analysis, we discuss how our design space relates to existing visualization principles yet exhibits unique aspects. We conclude with opportunities for future systems regarding data structure, cognition, and integrability.
Figures



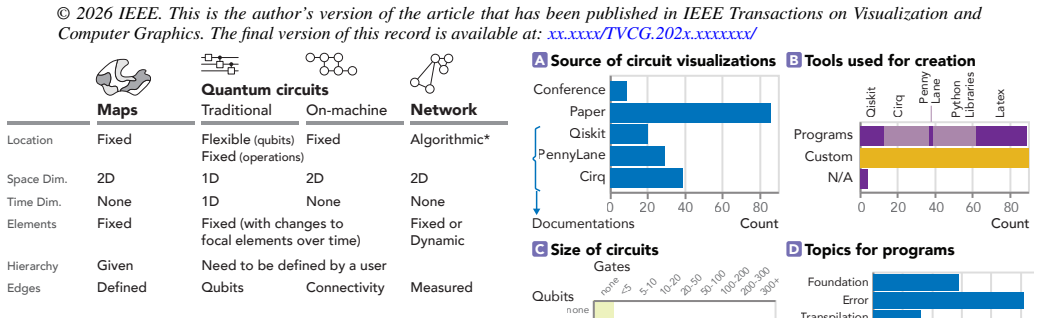
Figures from the paper (8 more)


Reference graph
Works this paper leans on
-
[1]
R. Amar, J. Eagan, and J. Stasko. Low-level components of analytic activity in information visualization. InIEEE Symposium on Information Visualization, InfoVis ’05, pp. 111–117. IEEE Computer Society, 2005. doi: 10.1109/INFVIS.2005.1532136 9
arXiv 2005
-
[2]
N. Andrienko, G. Andrienko, and P. Gatalsky. Exploratory spatio-temporal visualization: an analytical review.Journal of Visual Languages & Com- puting, 14(6):503–541, 2003. doi: 10.1016/S1045-926X(03)00046-6 3
-
[3]
Z. Ashktorab, J. D. Weisz, and M. Ashoori. Thinking too classically: Research topics in human-quantum computer interaction. InProceedings of the 2019 CHI Conference on Human Factors in Computing Systems, 9 CHI ’19, pp. 1–12. Association for Computing Machinery, New York, NY , USA, 2019. doi: 10.1145/3290605.3300486 1, 9
arXiv 2019
-
[4]
B. Bach, E. Freeman, A. Abdul-Rahman, C. Turkay, S. Khan, Y . Fan et al. Dashboard design patterns.IEEE Transactions on Visualization and Computer Graphics, 29(1):342–352, 2023. doi: 10.1109/TVCG.2022. 3209448 4, 8
-
[5]
E. W. Bethel, M. G. Amankwah, J. Balewski, R. Van Beeumen, D. Camps, D. Huang et al. Quantum computing and visualization: A disruptive technological change ahead.IEEE Computer Graphics and Applications, 43(6):101–111, 2023. doi: 10.1109/MCG.2023.3316932 1
arXiv 2023
-
[6]
Bova and R
F. Bova and R. G. Melko. An open-source initiative would benefit quantum computing.Nature Reviews Physics, 7(8):406–407, Aug 2025. doi: 10. 1038/s42254-025-00854-0 3
2025
-
[7]
M. Brehmer and T. Munzner. A multi-level typology of abstract visualiza- tion tasks.IEEE Transactions on Visualization and Computer Graphics, 19(12):2376–2385, 2013. doi: 10.1109/TVCG.2013.124 9
-
[8]
C. Corritore and S. Wiedenbeck. Mental representations of expert proce- dural and object-oriented programmers in a software maintenance task. International Journal of Human-Computer Studies, 50(1):61–83, 1999. doi: 10.1006/ijhc.1998.0236 9
arXiv 1999
Show all 56 references
-
[9]
A. W. Cross, L. S. Bishop, J. A. Smolin, and J. M. Gambetta. Open Quantum Assembly Language, 2017. https://arxiv.org/abs/1707. 03429. 9
2017
-
[10]
Ellis and A
G. Ellis and A. Dix. A taxonomy of clutter reduction for information visualisation.IEEE Transactions on Visualization and Computer Graphics, 13(6):1216–1223, 2007. doi: 10.1109/TVCG.2007.70535 8
2007
-
[11]
Gelernter and K
J. Gelernter and K. M. Carley. Spatiotemporal network analysis and visualization. InGeospatial Research: Concepts, Methodologies, Tools, and Applications, pp. 373–395. IGI Global Scientific Publishing, 2016. 3
2016
-
[12]
C. Gidney. Quirk, 2016.https://algassert.com/quirk. 2, 3, 4, 8
2016
-
[13]
C. Gidney. Stim: a fast stabilizer circuit simulator.Quantum, 5:497, July
-
[14]
Cirq, 2018.https://quantumai.google/cirq
Google. Cirq, 2018.https://quantumai.google/cirq. 1, 2
2018
-
[15]
Crumble, 2022
Google Quantum AI. Crumble, 2022. https://github.com/ quantumlib/Stim/tree/main/glue/crumble. 2, 3, 4, 5, 6, 7, 8, 9
2022
-
[16]
Hagberg, D
A. Hagberg, D. Schult, and S. Pieter. NetowrkX, 2004. https: //networkx.org/. 9
2004
-
[17]
J. Heer, F. B. Viégas, and M. Wattenberg. V oyagers and voyeurs: Supporting asynchronous collaborative visualization.Commun. ACM, 52(1):87–97, Jan. 2009. doi: 10.1145/1435417.1435439 9
2009
-
[18]
IBM Quantum Composer, 2016
IBM. IBM Quantum Composer, 2016. https://quantum.ibm.com/ composer/. 2, 3, 4, 7, 8
2016
-
[19]
Qiskit, 2017.https://www.ibm.com/quantum/qiskit
IBM. Qiskit, 2017.https://www.ibm.com/quantum/qiskit. 1, 2
2017
-
[20]
Isenberg, N
P. Isenberg, N. Elmqvist, J. Scholtz, D. Cernea, K.-L. Ma, and H. Ha- gen. Collaborative visualization: Definition, challenges, and research agenda.Information Visualization, 10(4):310–326, 2011. doi: 10.1177/ 1473871611412817 2, 9
2011
-
[21]
Javed and N
W. Javed and N. Elmqvist. Exploring the design space of composite visualization. In2012 IEEE Pacific Visualization Symposium, pp. 1–8,
-
[22]
H. Kim, M. J. Jeng, and K. N. Smith. Toward human-quantum computer interaction: Interface techniques for usable quantum computing. InPro- ceedings of the 2025 CHI Conference on Human Factors in Computing Systems, CHI ’25. ACM, 2025. doi: 10.1145/3706598.3713370 1, 2, 3, 4, 5, 6, 7, 8
2025
-
[23]
H. Kim, D. Mortiz, and J. Hullman. Design patterns and trade-offs in au- thoring communication-oriented responsive visualization.Comput. Graph- ics Forum (Proc. EuroVis), 40(3):459–470, 2021. doi: 10.1111/cgf.14321 4
2021 doi
-
[24]
Kjellin, L
A. Kjellin, L. W. Pettersson, S. Seipel, and M. Lind. Evaluating 2d and 3d visualizations of spatiotemporal information.ACM Trans. Appl. Percept., 7(3), art. no. 19, 2008. doi: 10.1145/1773965.1773970 3, 8
2008
-
[25]
J.-B. Lamy. Dynamic software visualization of quantum algorithms with rainbow boxes. InProceedings of the 14th International Joint Conference on Computer Vision, Imaging and Computer Graphics Theory and Appli- cations. Prague, Czech Republic, 2019. doi: 10.5220/0007247801550163 2, 4
2019 doi
-
[26]
S. Lin, J. Hao, and L. Sun. QuFlow: Visualizing parameter flow in quantum circuits for understanding quantum computation. In2018 IEEE Scientific Visualization Conference (SciVis), pp. 37–41, 2018. doi: 10. 1109/SciVis.2018.8823602 1, 2, 3, 4, 6, 8
2018
-
[27]
L. Y .-H. Lo, A. Gupta, K. Shigyo, A. Wu, E. Bertini, and H. Qu. Misin- formed by visualization: What do we learn from misinformative visualiza- tions?Computer Graphics Forum, 41(3):515–525, 2022. doi: 10.1111/cgf .14559 8
2022 doi
-
[28]
S. LYi, Q. Wang, F. Lekschas, and N. Gehlenborg. Gosling: A grammar- based toolkit for scalable and interactive genomics data visualization.IEEE Transactions on Visualization and Computer Graphics, 28(1):140–150,
-
[29]
McGuffin and J.-M
M. McGuffin and J.-M. Robert. Visualizing quantum circuits: State vector difference highlighting and the half-matrix.ACM Transactions on Quantum Computing, 2026. doi: 10.1145/3786463 2, 4
2026 doi
-
[30]
R. Mota, N. Ferreira, J. D. Silva, M. Horga, M. Lage, L. Ceferino et al. A comparison of spatiotemporal visualizations for 3d urban analytics.IEEE Transactions on Visualization and Computer Graphics, 29(1):1277–1287,
-
[31]
M. A. Nielsen and I. L. Chuang.Quantum Computation and Quantum Information: 10th Anniversary Edition. Cambridge University Press, 2010. doi: 10.1017/CBO9780511976667 2
2010 doi
-
[32]
J. F. Norman, J. T. Todd, V . J. Perotti, and J. S. Tittle. The visual perception of three-dimensional length.J. Exp. Psychol. Hum. Percept. Perform., 22(1):173–186, 1996. 3, 8
1996
-
[33]
Nusrat, T
S. Nusrat, T. Harbig, and N. Gehlenborg. Tasks, techniques, and tools for genomic data visualization.Computer Graphics Forum, 38(3):781–805,
-
[34]
Pandey, S
A. Pandey, S. L’Yi, Q. Wang, M. A. Borkin, and N. Gehlenborg. GenoREC: A recommendation system for interactive genomics data visualization. IEEE Trans. Vis. Comput. Graph., 29(1):570–580, 2023. doi: 10.1109/ TVCG.2022.3209407 8
2023
-
[35]
Qu and J
Z. Qu and J. Hullman. Keeping multiple views consistent: Constraints, validations, and exceptions in visualization authoring.IEEE Transactions on Visualization and Computer Graphics, 24(1):468–477, 2018. doi: 10. 1109/TVCG.2017.2744198 2, 8
2018
-
[36]
S. Ruan, Q. Guan, P. Griffin, Y . Mao, and Y . Wang. QuantumEyes: Towards better interpretability of quantum circuits.IEEE Transactions on Visualization and Computer Graphics, 30(9):6321–6333, 2024. doi: 10. 1109/TVCG.2023.3332999 2, 4, 7
2024
-
[37]
S. Ruan, Z. Liang, Q. Guan, P. Griffin, X. Wen, Y . Lin et al. VIOLET: Visual analytics for explainable quantum neural networks.IEEE Transac- tions on Visualization and Computer Graphics, 30(6):2862–2874, 2024. doi: 10.1109/TVCG.2024.3388557 1, 2, 4, 7
2024
-
[38]
Satyanarayan, R
A. Satyanarayan, R. Russell, J. Hoffswell, and J. Heer. Reactive Vega: A streaming dataflow architecture for declarative interactive visualization. IEEE Transactions on Visualization and Computer Graphics, 22(1):659– 668, 2016. doi: 10.1109/TVCG.2015.2467091 9
2016
-
[39]
Schöttler, Y
S. Schöttler, Y . Yang, H. Pfister, and B. Bach. Visualizing and interacting with geospatial networks: A survey and design space.Computer Graphics Forum, 40(6):5–33, 2021. doi: 10.1111/cgf.14198 4
2021 doi
-
[40]
Segel and J
E. Segel and J. Heer. Narrative visualization: Telling stories with data. IEEE Transactions on Visualization and Computer Graphics, 16(6):1139– 1148, 2010. doi: 10.1109/TVCG.2010.179 4
2010 doi
-
[41]
Setlur, M
V . Setlur, M. Correll, and S. Battersby. Oscar: A semantic-based data binning approach. In2022 IEEE Visualization and Visual Analytics (VIS), pp. 100–104, 2022. doi: 10.1109/VIS54862.2022.00029 9
2022
-
[42]
Shneiderman
B. Shneiderman. The eyes have it: A task by data type taxonomy for information visualizations. InThe Craft of Information Visualization, Interactive Technologies, pp. 364–371. Morgan Kaufmann, San Francisco,
-
[43]
Srinivasan, J
A. Srinivasan, J. Purich, M. Correll, L. Battle, V . Setlur, and A. Crisan. From dashboard zoo to census: A case study with Tableau public.IEEE Transactions on Visualization and Computer Graphics, 31(9):6085–6099,
-
[44]
J. S. Tittle, J. T. Todd, V . J. Perotti, and J. F. Norman. Systematic distor- tion of perceived three-dimensional structure from motion and binocular stereopsis.J. Exp. Psychol. Hum. Percept. Perform., 21(3):663–678, 1995. 3, 8
1995
-
[45]
J. T. Todd. The visual perception of 3d shape.Trends in Cognitive Sciences, 8(3):115–121, 2026/03/18 2004. doi: 10.1016/j.tics.2004.01.006 3, 8
2026 doi
-
[46]
F. B. Viegas, M. Wattenberg, F. van Ham, J. Kriss, and M. McKeon. ManyEyes: a site for visualization at internet scale.IEEE Transactions on Visualization and Computer Graphics, 13(6):1121–1128, 2007. doi: 10. 1109/TVCG.2007.70577 9
2007
-
[47]
Z. Wen, Y . Liu, S. Tan, J. Chen, M. Zhu, D. Han et al. Quantivine: A visualization approach for large-scale quantum circuit representation and analysis.IEEE Transactions on Visualization and Computer Graphics, 30(1):573–583, 2024. doi: 10.1109/TVCG.2023.3327148 1, 2, 3, 4, 7,...
2024
-
[48]
H. Wickham. A layered grammar of graphics.Journal of Computational and Graphical Statistics, 19(1):3–28, 2010. doi: 10.1198/jcgs.2009.07098 9
2010 arXiv
-
[49]
PennyLane, 2021.https://pennylane.ai/
Xanadu. PennyLane, 2021.https://pennylane.ai/. 2
2021
-
[50]
L. Yang, Z. Ma, L. Zhu, and L. Liu. Research on the visualization of spatio-temporal data.IOP Conference Series: Earth and Environmental Science, 234(1), 2019. doi: 10.1088/1755-1315/234/1/012013 3 11
2019 doi
-
[2003]
doi: 10.1016/B978-155860915-0/50046-9 2, 8
-
[2012]
doi: 10.1109/PacificVis.2012.6183556 4
2012
-
[2019]
doi: 10.1111/cgf.13727 4, 8
-
[2021]
doi: 10.22331/q-2021-07-06-497 3
2021 doi
-
[2022]
doi: 10.1109/TVCG.2021.3114876 8
2021
-
[2025]
doi: 10.1109/TVCG.2024.3490259 4
2024
Reviewed July 31, 2026 · model on record in the stance chip above.
Discussion (0). Sign in to comment.