REVIEW 3 major objections 5 minor 108 references
Revisiting Energy-Based Model for Out-of-Distribution Detection
T0 review · 3 major / 5 minor · reviewed 2026-08-11 · deepseek-v4-flash
Pith's one-line read Tuning a pretrained classifier for ten epochs on its own simply augmented images makes it reliably flag out-of-distribution inputs, and the paper's energy-barrier loss achieves top results on CIFAR-10 and CIFAR-100.
desk verdict Eq. (12)'s energy-barrier loss is sign-inverted, so the paper's central objective as written contradicts its own theory; the empirical results may still hold, but the text needs a major fix before it can be trusted. read the letter →
The pith
A machine-rendered reading of the paper's core claim, the machinery that carries it, and where it could break.
The reading
What carries the argument
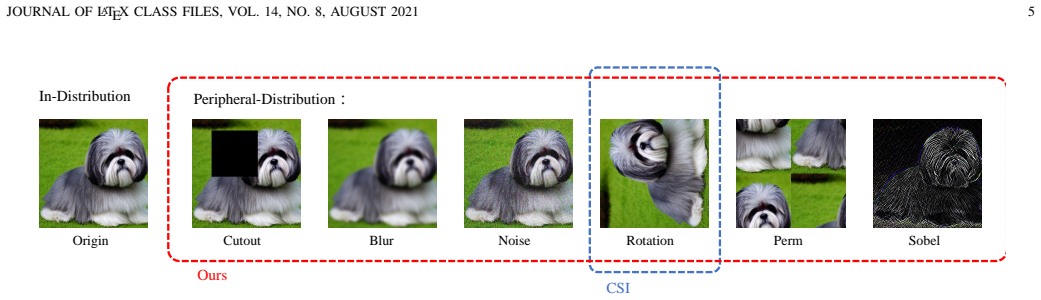
Peripheral-distribution (PD) data and the energy-barrier inequality carry the argument. PD data are augmented samples $\mathcal{B}^+ = \bigcup_{S\in\mathcal{S}}\{S(x_i)\}$ generated from ID images by a fixed set of simple transformations, placed in feature space between ID and OOD samples. The load-bearing identity is Theorem 1, proved from Assumption 1 by inserting $x^+$ into $E(x')-E(x)$ and bounding $E(x')-E(x^+) \geq -B\|x'-x^+\|$ using the bounded class vectors of the linear classifier. The energy-barrier loss of Eq. (12) is the training mechanism that establishes the barrier: it minimizes $\log\sigma\big((E(x_{\text{per}})-E(x_{\text{in}}))/\beta\big)$, a function of the energy difference only, so the intractable $\log Z$ cancels, which is the theoretical fix over the earlier energy-bounded loss of Eq. (11).
What would settle it
A concrete test: on the CIFAR-100-as-ID, CIFAR-10-as-OOD setting with ResNet-18, measure the actual energy gaps $E(x')-E(x)$ over many OOD images and compare with the paper's reported AUROC of 75.22, which is below the untuned energy baseline; a sharper check is to compute, for each OOD image, the nearest peripheral-distribution sample in feature space and test whether Assumption 1's inequality holds, because if the inequality fails on most OOD images yet the energy ordering still holds, the theorem is not the mechanism, and if the inequality holds but the ordering fails, the assumption is insufficient.
Extended reading notes
Core claim
The paper's central claim is that OOD detection does not require seeing real outliers during training; it is enough to establish an energy barrier between in-distribution images and their augmented 'peripheral' versions. The authors define this barrier in Assumption 1: for a random ID sample $x$ and any OOD sample $x'$, some augmented sample $x^+$ satisfies $E(x^+;f)-E(x;f) > B\|x'-x^+\| + \gamma_\alpha$ with probability $1-\alpha$. Theorem 1 then shows $E(x';f)-E(x;f) > \gamma_\alpha$, so OOD inputs sit above ID inputs in energy. To create this barrier, the paper replaces the classical energy-bounded loss, which implicitly ignores the changing partition function during training, with an energy-barrier loss $\mathcal{L}_{\text{energy}^*} = \log\sigma\big((E(x_{\text{per}})-E(x_{\text{in}}))/\beta\big)$ that depends only on energy differences and is therefore invariant to the partition function. The result is an extension of energy-based OOD scoring that uses simple transformations as surrogate outliers and a theoretically motivated loss.
Load-bearing premise
The proof only works if every out-of-distribution input has some simply transformed in-distribution image that is simultaneously close to it in feature space and already carries a large energy gap over the original image; when that proxy image does not exist, as the paper finds for CIFAR-100 with a ResNet-18, Theorem 1 provides no separation guarantee.
Editorial extensions
If this is right
- Tuning a pretrained classifier for roughly ten epochs on its own augmented images can rival or beat methods trained from scratch with curated outliers; on CIFAR-10 the ID accuracy drops only about 0.09% while average AUROC rises to 96.30%.
- The energy-barrier loss makes the maximum-likelihood spirit of energy-based tuning rigorous, because it removes the dependence on the partition function, which the paper shows fluctuates substantially during tuning.
- Under Assumption 1, OOD detection reduces to thresholding the Helmholtz free energy: with probability $1-\alpha$ every OOD input has higher energy than a random ID input.
- The assumption holds only when the feature extractor clusters ID tightly: on CIFAR-100 with ResNet-18 the method underperforms, while with ResNet-34 and ResNet-50 the AUROC gains over the energy baseline become +10.10 and +12.29 points.
- Combining several simple transformations beats any single one on average, so the method does not need the per-dataset transformation search that single-augmentation contrastive approaches require.
Reading between the lines
- If the barrier mechanism is what matters, the transformation set should be chosen so that augmented samples sit just outside the ID cluster but inside the region where OOD data live; a dataset whose natural augmentations stay fully ID would need a different set, and the energy gap on held-out validation could select it.
- The partition-function cancellation is a general design principle: any auxiliary loss stated purely in energy differences is immune to the changing normalizer, so the same barrier loss could be applied to other logit-based scores or representation-level energies, not just the softmax free energy.
- The method suggests a testable equivalence between OOD detection and augmentation-graph geometry: OOD samples are those reachable from ID by a path of transformation steps, so the energy barrier should transfer along that graph; one could verify whether OOD inputs with larger graph distance to ID get larger energy gaps.
- Because only ten epochs of tuning are needed, the same recipe could be applied on top of large pretrained feature extractors without retraining the backbone, potentially giving OOD detection for foundation models at negligible cost, a direction the paper does not test.
Signed reviews
Editorial analysis
A structured set of objections, weighed in public.
Referee Report
Summary. The paper proposes two OOD-detection tuning schemes, OEST and OEST*, which fine-tune a pretrained classifier using cross-entropy plus an energy-based loss on "peripheral-distribution" (PD) data obtained by simple transformations of in-distribution samples. The central theoretical claim is that if an energy barrier exists between PD and ID samples (Assumption 1), then OOD samples receive higher energy than ID samples with high probability (Theorem 1). The authors report strong AUROC and FPR95 numbers on CIFAR-10 and CIFAR-100 benchmarks, as well as on MNIST/SVHN, and provide a public code repository. The paper is clearly written and the experimental comparison is broad, but the theoretical and algorithmic core contains a load-bearing sign error in the OEST* objective, and the theoretical result is conditional on essentially the same energy-barrier behavior that the loss is intended to create.
Significance. If the stated mechanism were correct, the idea of replacing manually curated outlier data with a diverse set of simple transformations and using an energy-difference loss would be a useful and practical contribution to OOD detection. The paper also ships a public implementation, provides extensive benchmarking against many baselines, and includes ablations over transformations, backbones, and hyperparameters, which are strengths. However, the significance of these results is currently overshadowed by the sign error in Eq. (12), which makes the printed OEST* objective implement the opposite of the claimed energy barrier, and by the fact that Theorem 1 is a direct restatement of Assumption 1 rather than a guarantee about what the training loss achieves. These issues must be resolved before the paper's central claims can be accepted.
major comments (3)
- [Eq. (12) and Algorithm 1] Eq. (12) defines Lenergy*(xin,x'in) = log σ((E(xper)-E(xin))/β), and Algorithm 1 minimizes L = LCE + α·Lenergy*. Since log σ(z) is monotonically increasing with positive derivative, minimizing this loss drives E(xper)-E(xin) toward minus infinity, i.e., it pushes peripheral-distribution energy below in-distribution energy. This is the exact opposite of the energy barrier required by Assumption 1, which postulates E(x+;f)-E(x;f) > γα ≥ 0, and it is also opposite to the mechanism described in the abstract and Figure 1b. As written, the reported OEST* results in Tables II, III, and VIII cannot be consequences of the stated objective. The text provides no alternative sign convention or maximization step that would rescue Eq. (12); either the released code contains a sign flip absent from the manuscript, or the empirical improvement has a different cause. This is the load-bearing flaw of the paper and must be fixed and verified before any further evaluation.
- [Theorem 1 and Assumption 1 (Section IV-B, Appendix A)] The proof of Theorem 1 merely combines Assumption 1 with the Cauchy-Schwarz inequality: Assumption 1 already asserts E(x+;f)-E(x;f) > B‖x'-x+‖ + γα, and the proof bounds E(x';f)-E(x+;f) ≥ -B‖x'-x+‖, so the conclusion E(x';f)-E(x;f) > γα is a direct consequence of the assumption. The theorem therefore does not establish that the proposed training objective creates or maintains the energy barrier; it only says that if such a barrier exists, then a separation guarantee follows. This is a conditional restatement rather than a theoretical justification of the method. The paper's own Remark after Theorem 1 acknowledges this, and Section V-C4 further states that Assumption 1 fails on CIFAR-100 with ResNet-18, which is precisely the setting of the headline improvement in Table III. Consequently, the theory does not cover the main empirical claim in the configuration where OEST* is reported to be state of the art.
- [Section V-C4 and Table III] Section V-C4 concedes that the energy-barrier assumption is violated for the CIFAR-100/ResNet-18 setup, yet Tables III and VII report the largest absolute improvements in that setup (average AUROC 88.03% and a 12.29% AUROC gain over EBO with ResNet-50). This creates an internal inconsistency: the paper presents OEST* as a theoretically grounded method whose success is explained by Theorem 1, but the very benchmark used to demonstrate the method's advantage is one where the authors say the assumption does not hold. At minimum, the paper needs to separate the empirical claim from the conditional theoretical claim and provide an alternative explanation for the CIFAR-100 results, or the theoretical framing should be substantially weakened.
minor comments (5)
- [Eq. (11) and Section V-A3] The margin hyperparameter is written as m_per in Eq. (11) but as "m_pre" in Section V-A3; please unify the notation.
- [Appendix C-B] The text says six simple transformations are applied for SVHN but then lists five (noise, blur, perm, rotation, and sobel); either a transformation such as cutout is missing from the list, or the count is wrong.
- [Figure 1 caption] The caption contains the typo "orqange" for "orange" in the description of rotated CIFAR-10 samples.
- [Appendix C-C3, Table IX] The table header "Dtrain in pre-train + fine-tune" is unclear; the first column appears to mix a data label with a training-scheme label and should be split or reworded for readability.
- [Eq. (12)] The brackets around the expression in Eq. (12) are visually confusing; the outer square brackets add no mathematical meaning and should be removed to make the loss definition clearer.
Circularity Check
Theorem 1 restates, with a Lipschitz slack term, the very energy-barrier gap that Eq. (12) is designed to enforce; the empirical benchmarks remain independent, so the circularity is partial.
-
self definitional
[Section IV-B (Assumption 1 and Theorem 1), proof in Appendix A, loss defined in Section IV-C (Eq. 12)]
"Assumption 1 ... there exists a certain augmented sample x+ such that E(x+; f ) − E(x; f ) > B∥x′ − x+∥ + γα (9) will hold with probability 1 − α ... Theorem 1. When Assumption 1 holds, we then have E(x′; f ) − E(x; f ) > γα holds with probability 1 − α."
The theorem is obtained by adding the assumed PD-to-ID barrier E(x+)−E(x) to the Lipschitz bound E(x′)−E(x+) ≥ −B∥x′−x+∥ proved in Appendix A. The 'prediction' that an OOD point has higher energy than an ID point is therefore not an independent consequence of the method; it is the same energy-difference postulate, relaxed by exactly the B∥x′−x+∥ term that Assumption 1 already controls. The paper then introduces Eq. (12) as an 'energy-barrier loss' whose stated purpose is 'establishing an energy barrier between the original samples and the augmented ones' (Remark after Theorem 1). Thus Theorem 1 certifies nothing beyond the training objective's own target: it is a conditional restatement of the assumption the loss is designed to enforce.
full rationale
The central theory (Section IV-B) is Assumption 1, which postulates a large energy gap E(x+;f)−E(x;f) for a peripheral point x+ near a given OOD point x′. Theorem 1 derives E(x′;f)−E(x;f)>γα by adding this postulated gap to the Lipschitz bound on E(x′)−E(x+); the conclusion is a one-step corollary of the assumption up to the slack B∥x′−x+∥ that the assumption already bounds. Since Eq. (12) is introduced specifically to create that gap, the 'theoretically grounded' claim reduces to 'if the loss does its job, the desired separation follows.' The paper is transparent about this dependence in the Remark following Theorem 1 and in Section V-C4, where it admits the assumption fails for CIFAR-100 with ResNet-18. The empirical tables (Tables II–III) are genuine independent evidence evaluated against external benchmarks, which keeps the score moderate. Separate correctness concern, flagged but not scored as circularity: as printed, Eq. (12) minimizes log σ((E(xper)−E(xin))/β), which drives E(xper)−E(xin) as negative as possible, i.e. PD energy below ID energy, opposite to the barrier of Eq. (9) and to the mechanism described in Fig. 1b; the stated SOTA results cannot be consequences of the printed objective. Self-citations ([38], and the [23]-based margin choices) are not load-bearing for the OEST* results.
Assumptions & free parameters
free parameters (5)
- alpha (loss weight) =
0.2 for OEST*, 0.01 for OEST
- beta (sigmoid temperature) =
10
- m_in and m_per (margins) =
-25 and -7
- PD sampling ratio =
1:1 for CIFAR-10, 1:2 for CIFAR-100
- transformation set S =
six augmentations for CIFAR-10, seven (adding RandAugment) for CIFAR-100
assumptions (4)
- ad hoc to paper Assumption 1: for each OOD x' and random ID x, there exists an augmented sample x+ with E(x+)-E(x) > B||x'-x+|| + gamma_alpha with probability 1-alpha.
- domain assumption The proof of Theorem 1 uses a linear classifier f(x)=Cx (Section IV-B) with bounded class representations.
- domain assumption Peripheral-distribution samples lie between ID and OOD samples in feature space.
- standard math For a fixed classifier, the log partition function log Z in Eq. (4) is constant per sample and can be ignored at inference.
invented entities (1)
-
peripheral-distribution (PD) data
Cite this review
Pith. "Pith review of Revisiting Energy-Based Model for Out-of-Distribution Detection." pith.science (2026). https://pith.science/paper/6OT67LPN
@misc{pith2026241203058,
  author       = {Pith},
  title        = {Pith review of: Revisiting Energy-Based Model for Out-of-Distribution Detection},
  year         = {2026},
  howpublished = {\url{https://pith.science/paper/6OT67LPN}},
  note         = {Machine review of arXiv:2412.03058}
}
read the original abstract
Out-of-distribution (OOD) detection is an essential approach to robustifying deep learning models, enabling them to identify inputs that fall outside of their trained distribution. Existing OOD detection methods usually depend on crafted data, such as specific outlier datasets or elaborate data augmentations. While this is reasonable, the frequent mismatch between crafted data and OOD data limits model robustness and generalizability. In response to this issue, we introduce Outlier Exposure by Simple Transformations (OEST), a framework that enhances OOD detection by leveraging "peripheral-distribution" (PD) data. Specifically, PD data are samples generated through simple data transformations, thus providing an efficient alternative to manually curated outliers. We adopt energy-based models (EBMs) to study PD data. We recognize the "energy barrier" in OOD detection, which characterizes the energy difference between in-distribution (ID) and OOD samples and eases detection. PD data are introduced to establish the energy barrier during training. Furthermore, this energy barrier concept motivates a theoretically grounded energy-barrier loss to replace the classical energy-bounded loss, leading to an improved paradigm, OEST*, which achieves a more effective and theoretically sound separation between ID and OOD samples. We perform empirical validation of our proposal, and extensive experiments across various benchmarks demonstrate that OEST* achieves better or similar accuracy compared with state-of-the-art methods.
Figures


Figures from the paper (1 more)

Reference graph
Works this paper leans on
-
[1]
Outlier detection for high dimensional data,
C. C. Aggarwal and P. S. Yu, “Outlier detection for high dimensional data,” in Proc. ACM SIGMOD, 2001
2001
-
[2]
A survey of outlier detection methodologies,
V . Hodge and J. Austin, “A survey of outlier detection methodologies,” Artif. Intell. Rev., 2004
2004
-
[3]
Outlier detection,
I. Ben-Gal, “Outlier detection,” in Data Min. Knowl. Discov. Handb. Springer, 2005
2005
-
[4]
Progress in outlier detection techniques: A survey,
H. Wang, M. J. Bah, and M. Hammad, “Progress in outlier detection techniques: A survey,” IEEE Access, 2019
2019
-
[5]
Concrete problems in AI safety,
D. Amodei, C. Olah, J. Steinhardt, P. Christiano, J. Schulman, and D. Man ´e, “Concrete problems in AI safety,” arXiv preprint arXiv:1606.06565, 2016
arXiv 2016
-
[6]
A Baseline for Detecting Misclassified and Out-of-Distribution Examples in Neural Networks,
D. Hendrycks and K. Gimpel, “A Baseline for Detecting Misclassified and Out-of-Distribution Examples in Neural Networks,” in Int. Conf. Learn. Represent., 2017
2017
-
[7]
Steps toward robust artificial intelligence,
T. G. Dietterich, “Steps toward robust artificial intelligence,” AI Mag., 2017
2017
-
[8]
J. Leike, M. Martic, V . Krakovna, P. A. Ortega, T. Everitt, A. Lefrancq, L. Orseau, and S. Legg, “AI safety gridworlds,” arXiv preprint arXiv:1711.09883, 2017
arXiv 2017
Show all 108 references
-
[9]
The EU approach to ethics guidelines for trustworthy artificial intelligence,
N. A. Smuha, “The EU approach to ethics guidelines for trustworthy artificial intelligence,” Comput. Law Rev. Int. , 2019
2019
-
[10]
Bridging the gap between ethics and practice: Guide- lines for reliable, safe, and trustworthy Human-Centered AI systems,
B. Shneiderman, “Bridging the gap between ethics and practice: Guide- lines for reliable, safe, and trustworthy Human-Centered AI systems,” ACM Trans. Interact. Intell. Syst. , 2020
2020
-
[11]
Practical Machine Learning Safety: A Survey and Primer,
S. Mohseni, H. Wang, Z. Yu, C. Xiao, Z. Wang, and J. Yadawa, “Practical Machine Learning Safety: A Survey and Primer,” arXiv preprint arXiv:2106.04823, 2021
2021 arXiv
-
[12]
Unsolved problems in ml safety,
D. Hendrycks, N. Carlini, J. Schulman, and J. Steinhardt, “Unsolved problems in ml safety,” arXiv preprint arXiv:2109.13916 , 2021
2021 arXiv
-
[13]
X-risk analysis for AI research,
D. Hendrycks and M. Mazeika, “X-risk analysis for AI research,” arXiv preprint arXiv:2206.05862, 2022
2022 arXiv
-
[14]
Deep Neural Networks Are Easily Fooled: High Confidence Predictions for Unrecognizable Im- ages,
A. Nguyen, J. Yosinski, and J. Clune, “Deep Neural Networks Are Easily Fooled: High Confidence Predictions for Unrecognizable Im- ages,” in Proc. IEEE Conf. Comput. Vis. Pattern Recognit. , 2015, pp. 427–436
2015
-
[15]
Why ReLU Networks Yield High-Confidence Predictions Far Away from the Training Data and How to Mitigate the Problem,
M. Hein, M. Andriushchenko, and J. Bitterwolf, “Why ReLU Networks Yield High-Confidence Predictions Far Away from the Training Data and How to Mitigate the Problem,” in Proc. IEEE Conf. Comput. Vis. Pattern Recognit., 2019, pp. 41–50
2019
-
[16]
Standardized Max Logits: A Simple Yet Effective Approach for Identifying Unexpected Road Obstacles in Urban-Scene Segmentation,
S. Jung, J. Lee, D. Gwak, S. Choi, and J. Choo, “Standardized Max Logits: A Simple Yet Effective Approach for Identifying Unexpected Road Obstacles in Urban-Scene Segmentation,” in IEEE/CVF Int. Conf. Comput. Vis., 2021, pp. 15 425–15 434
2021
-
[17]
A systematic review of outliers detection techniques in medical data-preliminary study,
J. Gaspar, E. Catumbela, B. Marques et al. , “A systematic review of outliers detection techniques in medical data-preliminary study,” in Proc. Int. Conf. Health Informatics . SCITEPRESS, 2011, pp. 575– 582
2011
-
[18]
Outlier detection for patient monitoring and alerting,
M. Hauskrecht, I. Batal, M. Valko et al., “Outlier detection for patient monitoring and alerting,” J. Biomed. Inform., vol. 46, no. 1, pp. 47–55, 2013
2013
-
[19]
OpenOOD: Benchmarking Generalized Out-of-Distribution Detection,
J. Yang, P. Wang, D. Zou, Z. Zhou, K. Ding, W. Peng, H. Wang, G. Chen, B. Li, Y . Sun, and et al., “OpenOOD: Benchmarking Generalized Out-of-Distribution Detection,” Adv. Neural Inf. Process. Syst., vol. 35, pp. 32 598–32 611, 2022
2022
-
[20]
OpenOOD v1. 5: Enhanced Benchmark for Out-of-Distribution Detection,
J. Zhang, J. Yang, P. Wang, H. Wang, Y . Lin, H. Zhang, Y . Sun, X. Du, K. Zhou, W. Zhang et al. , “OpenOOD v1. 5: Enhanced Benchmark for Out-of-Distribution Detection,” arXiv preprint arXiv:2306.09301 , 2023
2023 arXiv
-
[21]
Deep Anomaly Detec- tion with Outlier Exposure,
D. Hendrycks, M. Mazeika, and T. Dietterich, “Deep Anomaly Detec- tion with Outlier Exposure,” in Int. Conf. Learn. Represent. , 2019
2019
-
[22]
Unsupervised Out-of-Distribution Detection by Maximum Classifier Discrepancy,
Q. Yu and K. Aizawa, “Unsupervised Out-of-Distribution Detection by Maximum Classifier Discrepancy,” in Proc. IEEE/CVF Int. Conf. Comput. Vis., 2019, pp. 9518–9526
2019
-
[23]
Energy-Based Out-of- Distribution Detection,
W. Liu, X. Wang, J. Owens, and Y . Li, “Energy-Based Out-of- Distribution Detection,” Adv. Neural Inf. Process. Syst. , vol. 33, pp. 21 464–21 475, 2020
2020
-
[24]
Self-Supervised Learning for Generalizable Out-of-Distribution Detection,
S. Mohseni, M. Pitale, J. B. S. Yadawa, and Z. Wang, “Self-Supervised Learning for Generalizable Out-of-Distribution Detection,” in Proc. AAAI Conf. Artif. Intell. , vol. 34, no. 04, 2020, pp. 5216–5223
2020
-
[25]
Atom: Robustifying out- of-distribution detection using outlier mining,
J. Chen, Y . Li, X. Wu, Y . Liang, and S. Jha, “Atom: Robustifying out- of-distribution detection using outlier mining,” ECML&PKDD, 2021
2021
-
[26]
An effective baseline for robustness to distributional shift,
S. Thulasidasan, S. Thapa, S. Dhaubhadel, G. Chennupati, T. Bhat- tacharya, and J. Bilmes, “An effective baseline for robustness to distributional shift,” arXiv preprint arXiv:2105.07107 , 2021. JOURNAL OF LATEX CLASS FILES, VOL. 14, NO. 8, AUGUST 2021 12
2021 arXiv
-
[27]
Background data resampling for outlier- aware classification,
Y . Li and N. Vasconcelos, “Background data resampling for outlier- aware classification,” in IEEE Conf. Comput. Vis. Pattern Recog., 2020
2020
-
[28]
Outlier Exposure with Confidence Control for Out-of-Distribution Detection,
A.-A. Papadopoulos, M. R. Rajati, N. Shaikh, and J. Wang, “Outlier Exposure with Confidence Control for Out-of-Distribution Detection,” Neurocomputing, vol. 441, pp. 138–150, 2021
2021
-
[29]
Poem: Out-of-distribution detection with posterior sampling,
Y . Ming, Y . Fan, and Y . Li, “Poem: Out-of-distribution detection with posterior sampling,” in ICML, 2022
2022
-
[30]
Mixture outlier exposure: Towards out-of-distribution detection in fine-grained environments,
J. Zhang, N. Inkawhich, R. Linderman, Y . Chen, and H. Li, “Mixture outlier exposure: Towards out-of-distribution detection in fine-grained environments,” in Proceedings of the IEEE/CVF Winter Conference on Applications of Computer Vision (WACV) , January 2023, pp. 5531– 5540
2023
-
[31]
Exposing Outlier Exposure: What Can Be Learned From Few, One, and Zero Outlier Images,
P. Liznerski, L. Ruff, R. A. Vandermeulen et al. , “Exposing Outlier Exposure: What Can Be Learned From Few, One, and Zero Outlier Images,” Trans. Mach. Learn. Res. , 2022
2022
-
[32]
Learning to augment distributions for out-of-distribution detection,
Q. Wang, Z. Fang, Y . Zhang, F. Liu, Y . Li, and B. Han, “Learning to augment distributions for out-of-distribution detection,” in Adv. Neural Inform. Process. Syst., A. Oh, T. Neumann, A. Globerson, K. Saenko, M. Hardt, and S. Levine, Eds., 2023, pp. 73 274–73 286
2023
-
[33]
A Unifying Review of Deep and Shallow Anomaly Detection,
L. Ruff, J. R. Kauffmann, R. A. Vandermeulen, G. Montavon, W. Samek, M. Kloft, T. G. Dietterich, and K.-R. Muller, “A Unifying Review of Deep and Shallow Anomaly Detection,” Proc. IEEE, vol. 109, pp. 756–795, 2020
2020
-
[34]
Unsupervised Representation Learning by Predicting Image Rotations,
S. Gidaris, P. Singh, and N. Komodakis, “Unsupervised Representation Learning by Predicting Image Rotations,” in Int. Conf. Learn. Repre- sent., 2018
2018
-
[35]
Design of an Image Edge Detection Filter Using the Sobel Operator,
N. Kanopoulos, N. Vasanthavada, and R. L. Baker, “Design of an Image Edge Detection Filter Using the Sobel Operator,” IEEE J. Solid-State Circuits, vol. 23, no. 2, pp. 358–367, 1988
1988
-
[36]
A Tu- torial on Energy-Based Learning,
Y . LeCun, S. Chopra, R. Hadsell, M. Ranzato, and F. Huang, “A Tu- torial on Energy-Based Learning,” Predicting Structured Data , vol. 1, no. 0, 2006
2006
-
[37]
CSI: Novelty Detection via Contrastive Learning on Distributionally Shifted Instances,
J. Tack, S. Mo, J. Jeong, and J. Shin, “CSI: Novelty Detection via Contrastive Learning on Distributionally Shifted Instances,” Adv. Neural Inf. Process. Syst. , vol. 33, pp. 11 839–11 852, 2020
2020
-
[38]
OEST: Outlier Exposure by Simple Transformations for Out-of-Distribution Detection,
Y . Wu, S. Dai, D. Pan, and X. Li, “OEST: Outlier Exposure by Simple Transformations for Out-of-Distribution Detection,” in 2023 IEEE Int. Conf. Image Process. (ICIP) . IEEE, 2023, pp. 2170–2174
2023
-
[39]
A simple unified framework for detecting out-of-distribution samples and adversarial attacks,
K. Lee, K. Lee, H. Lee, and J. Shin, “A simple unified framework for detecting out-of-distribution samples and adversarial attacks,” Adv. Neural Inform. Process. Syst. , vol. 31, 2018
2018
-
[40]
Detecting Out-of-Distribution Examples with Gram Matrices,
C. S. Sastry and S. Oore, “Detecting Out-of-Distribution Examples with Gram Matrices,” in Int. Conf. Mach. Learn. , 2020, pp. 8491–8501
2020
-
[41]
Out-of-Distribution Detection with Deep Nearest Neighbors,
Y . Sun, Y . Ming, X. Zhu, and Y . Li, “Out-of-Distribution Detection with Deep Nearest Neighbors,” in Int. Conf. Mach. Learn. , 2022, pp. 20 827–20 840
2022
-
[42]
Out-of-distribution detection based on in- distribution data patterns memorization with modern hopfield energy,
J. Zhang, Q. Fu, X. Chen, L. Du, Z. Li, G. Wang, xiaoguang Liu, S. Han, and D. Zhang, “Out-of-distribution detection based on in- distribution data patterns memorization with modern hopfield energy,” in The Eleventh International Conference on Learning Representations, 2023
2023
-
[43]
Enhancing The Reliability of Out-of- Distribution Image Detection in Neural Networks,
S. Liang, Y . Li, and R. Srikant, “Enhancing The Reliability of Out-of- Distribution Image Detection in Neural Networks,” in Int. Conf. Learn. Represent., 2018
2018
-
[44]
Scaling out-of-distribution detection for real-world settings,
D. Hendrycks, S. Basart, M. Mazeika, A. Zou, J. Kwon, M. Mostajabi, J. Steinhardt, and D. Song, “Scaling out-of-distribution detection for real-world settings,” in Int. Conf. Mach. Learn. , 2022, pp. 8759–8773
2022
-
[45]
Mood: Multi-level out-of-distribution detection,
Z. Lin, S. D. Roy, and Y . Li, “Mood: Multi-level out-of-distribution detection,” in Proceedings of the IEEE/CVF conference on Computer Vision and Pattern Recognition , 2021, pp. 15 313–15 323
2021
-
[46]
Your Classifier is Secretly an Energy Based Model and You Should Treat It Like One,
W. Grathwohl, K.-C. Wang, J.-H. Jacobsen, D. Duvenaud, M. Norouzi, and K. Swersky, “Your Classifier is Secretly an Energy Based Model and You Should Treat It Like One,” in Int. Conf. Learn. Represent. , 2020
2020
-
[47]
Provable guarantees for understanding out- of-distribution detection,
P. Morteza and Y . Li, “Provable guarantees for understanding out- of-distribution detection,” in Proceedings of the AAAI Conference on Artificial Intelligence, vol. 36, no. 7, 2022, pp. 7831–7840
2022
-
[48]
REAct: Out-of-Distribution Detection with Rectified Activations,
Y . Sun, C. Guo, and Y . Li, “REAct: Out-of-Distribution Detection with Rectified Activations,” Adv. Neural Inf. Process. Syst., vol. 34, pp. 144– 157, 2021
2021
-
[49]
Neural mean discrepancy for efficient out-of-distribution detection,
X. Dong, J. Guo, A. Li, W.-T. Ting, C. Liu, and H. Kung, “Neural mean discrepancy for efficient out-of-distribution detection,” in IEEE Conf. Comput. Vis. Pattern Recog. , 2022
2022
-
[50]
Extremely simple activation shaping for out-of-distribution detection,
A. Djurisic, N. Bozanic, A. Ashok, and R. Liu, “Extremely simple activation shaping for out-of-distribution detection,” in The Eleventh International Conference on Learning Representations , 2023
2023
-
[51]
Scaling for training time and post-hoc out-of-distribution detection enhancement,
K. Xu, R. Chen, G. Franchi, and A. Yao, “Scaling for training time and post-hoc out-of-distribution detection enhancement,” inThe Twelfth International Conference on Learning Representations , 2024
2024
-
[52]
Out-of-distribution detection using neural activation prior,
W. Wan, W. Zhang, and C. Jin, “Out-of-distribution detection using neural activation prior,” 2024
2024
-
[54]
Energy-based open-world uncertainty modeling for confidence calibration,
Y . Wang, B. Li, T. Che, K. Zhou, Z. Liu, and D. Li, “Energy-based open-world uncertainty modeling for confidence calibration,” in Int. Conf. Comput. Vis., 2021
2021
-
[55]
Generalized ODIN: Detecting Out-of-Distribution Image Without Learning from Out-of-Distribution Data,
Y .-C. Hsu, Y . Shen, H. Jin, and Z. Kira, “Generalized ODIN: Detecting Out-of-Distribution Image Without Learning from Out-of-Distribution Data,” in Proc. IEEE/CVF Conf. Comput. Vis. Pattern Recognit., 2020, pp. 10 951–10 960
2020
-
[56]
Mitigating Neural Network Overconfidence with Logit Normalization,
H. Wei, R. Xie, H. Cheng, L. Feng, B. An, and Y . Li, “Mitigating Neural Network Overconfidence with Logit Normalization,” in Int. Conf. Mach. Learn. , 2022, pp. 23 631–23 644
2022
-
[57]
Certifiably adversarially robust detection of out-of-distribution data,
J. Bitterwolf, A. Meinke, and M. Hein, “Certifiably adversarially robust detection of out-of-distribution data,” in Adv. Neural Inform. Process. Syst., 2020
2020
-
[58]
Robust out-of-distribution detection for neural networks,
J. Chen, Y . Li, X. Wu, Y . Liang, and S. Jha, “Robust out-of-distribution detection for neural networks,” arXiv preprint arXiv:2003.09711, 2020
2003 arXiv
-
[59]
Novelty detection via blurring,
S. Choi and S.-Y . Chung, “Novelty detection via blurring,” in Int. Conf. Learn. Represent., 2020
2020
-
[60]
On mixup training: Improved calibration and predictive uncertainty for deep neural networks,
S. Thulasidasan, G. Chennupati, J. Bilmes, T. Bhattacharya, and S. Michalak, “On mixup training: Improved calibration and predictive uncertainty for deep neural networks,” in Adv. Neural Inform. Process. Syst., 2019
2019
-
[61]
Cutmix: Reg- ularization strategy to train strong classifiers with localizable features,
S. Yun, D. Han, S. J. Oh, S. Chun, J. Choe, and Y . Yoo, “Cutmix: Reg- ularization strategy to train strong classifiers with localizable features,” in IEEE Conf. Comput. Vis. Pattern Recog. , 2019
2019
-
[62]
Improved regularization of convolutional neural networks with cutout,
T. DeVries and G. W. Taylor, “Improved regularization of convolutional neural networks with cutout,” arXiv preprint arXiv:1708.04552 , 2017
2017 arXiv
-
[63]
Augmix: A simple data processing method to improve robustness and uncertainty,
D. Hendrycks, N. Mu, E. D. Cubuk, B. Zoph, J. Gilmer, and B. Laksh- minarayanan, “Augmix: A simple data processing method to improve robustness and uncertainty,” arXiv preprint arXiv:1912.02781 , 2019
1912 arXiv
-
[64]
PixMix: Dreamlike Pictures Comprehensively Improve Safety Measures,
D. Hendrycks, A. Zou, M. Mazeika, L. Tang, B. Li, D. Song, and J. Steinhardt, “PixMix: Dreamlike Pictures Comprehensively Improve Safety Measures,” in IEEE Conf. Comput. Vis. Pattern Recog. , 2022, pp. 16 783–16 792
2022
-
[65]
Deep anomaly detection using geometric transformations,
I. Golan and R. El-Yaniv, “Deep anomaly detection using geometric transformations,” in Adv. Neural Inform. Process. Syst. , 2018
2018
-
[66]
Using Self- Supervised Learning Can Improve Model Robustness and Uncertainty,
D. Hendrycks, M. Mazeika, S. Kadavath, and D. Song, “Using Self- Supervised Learning Can Improve Model Robustness and Uncertainty,” Adv. Neural Inf. Process. Syst. , vol. 32, 2019
2019
-
[67]
A Simple Frame- work for Contrastive Learning of Visual Representations,
T. Chen, S. Kornblith, M. Norouzi, and G. Hinton, “A Simple Frame- work for Contrastive Learning of Visual Representations,” in Int. Conf. Mach. Learn., 2020, pp. 1597–1607
2020
-
[68]
Training confidence-calibrated classifiers for detecting out-of-distribution samples,
K. Lee, H. Lee, K. Lee, and J. Shin, “Training confidence-calibrated classifiers for detecting out-of-distribution samples,” in Int. Conf. Learn. Represent., 2018
2018
-
[69]
Out-of-distribution detection in classifiers via gener- ation,
S. Vernekar, A. Gaurav, V . Abdelzad, T. Denouden, R. Salay, and K. Czarnecki, “Out-of-distribution detection in classifiers via gener- ation,” in Adv. Neural Inform. Process. Syst. Worksh. , 2019
2019
-
[70]
Building robust classifiers through generation of confident out of distribution examples,
K. Sricharan and A. Srivastava, “Building robust classifiers through generation of confident out of distribution examples,” in Adv. Neural Inform. Process. Syst. Worksh. , 2018
2018
-
[71]
Ood-maml: Meta-learning for few-shot out- of-distribution detection and classification,
T. Jeong and H. Kim, “Ood-maml: Meta-learning for few-shot out- of-distribution detection and classification,” in Adv. Neural Inform. Process. Syst., 2020
2020
-
[72]
Unsupervised Learning of Multi-level Structures for Anomaly Detection,
S. Dai, J. Li, L. Wang, C. Zhu, Y . Wu, and X. Li, “Unsupervised Learning of Multi-level Structures for Anomaly Detection,” arXiv preprint arXiv:2104.12102, 2021
2021 arXiv
-
[73]
Generating and reweighting dense contrastive patterns for unsupervised anomaly detection,
S. Dai, Y . Wu, X. Li, and X. Xue, “Generating and reweighting dense contrastive patterns for unsupervised anomaly detection,” in Proceedings of the AAAI Conference on Artificial Intelligence , vol. 38, no. 2, 2024, pp. 1454–1462
2024
-
[74]
VOS: Learning What You Don’t Know by Virtual Outlier Synthesis,
X. Du, Z. Wang, M. Cai, and Y . Li, “VOS: Learning What You Don’t Know by Virtual Outlier Synthesis,” in Int. Conf. Learn. Represent. , 2022
2022
-
[75]
Non-Parametric Outlier Synthesis,
L. Tao, X. Du, J. Zhu, and Y . Li, “Non-Parametric Outlier Synthesis,” in Int. Conf. Learn. Represent. , 2022
2022
-
[76]
A less biased evaluation of out-of-distribution sample detectors,
A. Shafaei, M. Schmidt, and J. J. Little, “A less biased evaluation of out-of-distribution sample detectors,” in Brit. Mach. Vis. Conf. , 2019. JOURNAL OF LATEX CLASS FILES, VOL. 14, NO. 8, AUGUST 2021 13
2019
-
[77]
Do deep generative models know what they don’t know?
E. T. Nalisnick, A. Matsukawa, Y . W. Teh, D. G ¨or¨ur, and B. Lakshmi- narayanan, “Do deep generative models know what they don’t know?” in Int. Conf. Learn. Represent. , 2019
2019
-
[78]
Log-concave sampling,
S. Chewi, “Log-concave sampling,” Book draft available at https://chewisinho. github. io , 2023
2023
-
[79]
Chaos is a Ladder: A New Theoretical Understanding of Contrastive Learning via Augmentation Overlap,
Y . Wang, Q. Zhang, Y . Wang, J. Yang, and Z. Lin, “Chaos is a Ladder: A New Theoretical Understanding of Contrastive Learning via Augmentation Overlap,” in Int. Conf. Learn. Represent. , 2022
2022
-
[80]
Connect, Not Collapse: Explaining Contrastive Learning for Unsupervised Domain Adaptation,
K. Shen, R. M. Jones, A. Kumar, S. M. Xie, J. Z. HaoChen, T. Ma, and P. Liang, “Connect, Not Collapse: Explaining Contrastive Learning for Unsupervised Domain Adaptation,” in Int. Conf. Mach. Learn. , 2022, pp. 19 847–19 878
2022
-
[81]
On Calibration of Modern Neural Networks,
C. Guo, G. Pleiss, Y . Sun, and K. Q. Weinberger, “On Calibration of Modern Neural Networks,” in Int. Conf. Mach. Learn. , 2017, pp. 1321–1330
2017
-
[82]
GEN: Pushing the Limits of Softmax-Based Out-of-Distribution Detection,
X. Liu, Y . Lochman, and C. Zach, “GEN: Pushing the Limits of Softmax-Based Out-of-Distribution Detection,” in Proc. IEEE/CVF Conf. Comput. Vis. Pattern Recognit. , 2023, pp. 23 946–23 955
2023
-
[83]
MOS: Towards Scaling Out-of-Distribution De- tection for Large Semantic Space,
R. Huang and Y . Li, “MOS: Towards Scaling Out-of-Distribution De- tection for Large Semantic Space,” in Proc. IEEE/CVF Conf. Comput. Vis. Pattern Recognit., 2021, pp. 8710–8719
2021
-
[84]
Adversarial Reciprocal Points Learning for Open Set Recognition,
G. Chen, P. Peng, X. Wang, and Y . Tian, “Adversarial Reciprocal Points Learning for Open Set Recognition,” IEEE Trans. Pattern Anal. Mach. Intell., vol. 44, no. 11, pp. 8065–8081, 2021
2021
-
[85]
Learning Confidence for Out- of-Distribution Detection in Neural Networks,
T. DeVries and G. W. Taylor, “Learning Confidence for Out- of-Distribution Detection in Neural Networks,” arXiv preprint arXiv:1802.04865, 2018
2018 arXiv
-
[86]
How to Exploit Hyperspherical Embeddings for Out-of-Distribution Detection?
Y . Ming, Y . Sun, O. Dia et al. , “How to Exploit Hyperspherical Embeddings for Out-of-Distribution Detection?” in Int. Conf. Learn. Represent., 2022
2022
-
[87]
Learning Multiple Layers of Features from Tiny Images,
A. Krizhevsky, G. Hinton et al., “Learning Multiple Layers of Features from Tiny Images,” 2009
2009
-
[88]
Tiny ImageNet Visual Recognition Challenge,
Y . Le and X. Yang, “Tiny ImageNet Visual Recognition Challenge,” CS 231N, vol. 7, no. 7, p. 3, 2015
2015
-
[89]
Gradient-Based Learning Applied to Document Recognition,
Y . LeCun, L. Bottou, Y . Bengio, and P. Haffner, “Gradient-Based Learning Applied to Document Recognition,” Proc. IEEE , vol. 86, no. 11, pp. 2278–2324, 1998
1998
-
[90]
Multi- Digit Number Recognition from Street View Imagery Using Deep Con- volutional Neural Networks,
I. J. Goodfellow, Y . Bulatov, J. Ibarz, S. Arnoud, and V . Shet, “Multi- Digit Number Recognition from Street View Imagery Using Deep Con- volutional Neural Networks,” arXiv preprint arXiv:1312.6082 , 2013
2013 arXiv
-
[91]
Describing Textures in the Wild,
M. Cimpoi, S. Maji, I. Kokkinos, S. Mohamed, and A. Vedaldi, “Describing Textures in the Wild,” in Proc. IEEE Conf. Comput. Vis. Pattern Recognit., 2014, pp. 3606–3613
2014
-
[92]
Places: A 10 million Image Database for Scene Recognition,
B. Zhou, A. Lapedriza, A. Khosla, A. Oliva, and A. Torralba, “Places: A 10 million Image Database for Scene Recognition,” IEEE Trans. Pattern Anal. Mach. Intell. , vol. 40, no. 6, pp. 1452–1464, 2017
2017
-
[93]
Deep Learning for Classical Japanese Literature,
T. Clanuwat, M. Bober-Irizar, A. Kitamoto, A. Lamb, K. Yamamoto, and D. Ha, “Deep Learning for Classical Japanese Literature,” arXiv preprint arXiv:1812.01718, 2018
2018 arXiv
-
[94]
EMNIST: Extending MNIST to Handwritten Letters,
G. Cohen, S. Afshar, J. Tapson, and A. Van Schaik, “EMNIST: Extending MNIST to Handwritten Letters,” in Int. Joint Conf. Neural Netw. (IJCNN). IEEE, 2017, pp. 2921–2926
2017
-
[95]
The Relationship Between Precision-Recall and ROC Curves,
J. Davis and M. Goadrich, “The Relationship Between Precision-Recall and ROC Curves,” inProc. Int. Conf. Mach. Learn., 2006, pp. 233–240
2006
-
[96]
An Introduction to ROC Analysis,
T. Fawcett, “An Introduction to ROC Analysis,” Pattern Recognit. Lett., vol. 27, no. 8, pp. 861–874, 2006
2006
-
[97]
Towards Open Set Deep Networks,
A. Bendale and T. E. Boult, “Towards Open Set Deep Networks,” in Proc. IEEE Conf. Comput. Vis. Pattern Recognit., 2016, pp. 1563–1572
2016
-
[98]
A Simple Fix to Mahalanobis Distance for Improving Near-OOD Detection,
J. Ren, S. Fort, J. Liu, A. G. Roy, S. Padhy, and B. Lakshminarayanan, “A Simple Fix to Mahalanobis Distance for Improving Near-OOD Detection,” arXiv preprint arXiv:2106.09022 , 2021
2021 arXiv
-
[99]
Deep Residual Learning for Image Recognition,
K. He, X. Zhang, S. Ren, and J. Sun, “Deep Residual Learning for Image Recognition,” in Proc. IEEE Conf. Comput. Vis. Pattern Recognit., 2016, pp. 770–778
2016
-
[100]
Wide Residual Networks,
S. Zagoruyko and N. Komodakis, “Wide Residual Networks,” in Brit. Mach. Vis. Conf., 2016
2016
-
[101]
Fashion-MNIST: A Novel Im- age Dataset for Benchmarking Machine Learning Algorithms,
H. Xiao, K. Rasul, and R. V ollgraf, “Fashion-MNIST: A Novel Im- age Dataset for Benchmarking Machine Learning Algorithms,” arXiv preprint arXiv:1708.07747, 2017
2017 arXiv
-
[102]
LSUN: Construction of a Large-Scale Image Dataset Using Deep Learning with Humans in the Loop,
F. Yu, A. Seff, Y . Zhang, S. Song, T. Funkhouser, and J. Xiao, “LSUN: Construction of a Large-Scale Image Dataset Using Deep Learning with Humans in the Loop,” arXiv preprint arXiv:1506.03365 , 2015
2015 arXiv
-
[103]
Im- ageNet: A Large-Scale Hierarchical Image Database,
J. Deng, W. Dong, R. Socher, L.-J. Li, K. Li, and L. Fei-Fei, “Im- ageNet: A Large-Scale Hierarchical Image Database,” in IEEE Conf. Comput. Vis. Pattern Recognit. , 2009, pp. 248–255
2009
-
[104]
Tailoring Self-Supervision for Supervised Learning,
W. J. Moon, J.-H. Kim, and J.-P. Heo, “Tailoring Self-Supervision for Supervised Learning,” in Eur. Conf. Comput. Vis., 2022. Yifan Wu (Student Member, IEEE) received the B.E. degree in intelligent science and technology from the School of Computer Engineering and Science, Sha...
2022
-
[105]
When MNIST [89] is used as the in-distribution dataset, FMNIST [101], EMNIST [94], and CIFAR-10 [87] are adopted for OOD testing
as in-distribution datasets. When MNIST [89] is used as the in-distribution dataset, FMNIST [101], EMNIST [94], and CIFAR-10 [87] are adopted for OOD testing. For SVHN [90] as the in-distribution dataset, we evaluate using CIFAR-10 [87], CIFAR-100 [87], LSUN-Crop [102], and Im...
-
[106]
CSI relies on a single transformation type and treats the transformed images as negative class samples, which may not sufficiently capture the complexities of the data
Comparison with the Contrastive Training Scheme.: We also observed that CSI performs poorly in this case, largely due to certain image categories having insignificant appearance differences even after transformations like rotation, which leads to model confusion. CSI relies on...
-
[107]
The results are shown in Figure 4, with AUROC and Accuracy representing the performance metrics to be maximized, and FPR95 representing the robustness metric to be minimized
Hyper-parameters Analysis: We conducted a systematic analysis of the hyper-parameters α and β to evaluate their impact on the OOD detection performance of the ResNet-18 classifier. The results are shown in Figure 4, with AUROC and Accuracy representing the performance metrics ...
-
[108]
Compared to training from scratch, the pre-train plus fine-tune scheme yields better results, effectively enhancing the model’s performance and reducing the false positive rate
The Importance of Fine-Tune: To further validate the necessity of both the pre-train and fine-tune steps, we conducted experiments as illustrated in Table IX. Compared to training from scratch, the pre-train plus fine-tune scheme yields better results, effectively enhancing th...
-
[109]
Visualization of t-SNE: We performed t-SNE visualization of the features before and after fine-tune to provide a clear illustration. A shown in Figure 1a, red represents the test samples of CIFAR-10, orqange represents the rotated CIFAR- 10 samples, blue, purple and green repr...
Reviewed August 11, 2026 · model on record in the stance chip above.
Discussion (0). Continue with ORCID to comment.