REVIEW 5 major objections 6 minor 48 references
The Baryonic Tully-Fisher Relation II: Stellar Mass Models
T0 review · 5 major / 6 minor · reviewed 2026-08-10 · deepseek-v4-flash
Pith's one-line read New color-based mass-to-light models allow WISE W1 fluxes to yield galaxy stellar masses consistent with Spitzer-based estimates.
desk verdict A practical WISE W1 stellar-mass calibration package, honest about being an interpolation of the authors' own SML models, but with an unresolved 0.2 dex tension against Jarrett et al. that deserves referee attention. read the letter →
The pith
A machine-rendered reading of the paper's core claim, the machinery that carries it, and where it could break.
The reading
What carries the argument
The central object is the color-$\Upsilon_*$ relation: a mapping from $g-W1$ color to the stellar mass-to-light ratio in the WISE W1 band. It is generated from composite stellar population models that combine specified star formation histories and chemical enrichment scenarios, with the AGB contribution calibrated empirically on star cluster colors. This relation is what converts observed flux into stellar mass, so every comparison in the paper, whether against Spitzer, independent samples, or the Tully-Fisher relation, depends on it.
What would settle it
A resolved-star census of blue dwarf galaxies that yields stellar masses systematically lower than the $g-W1$ color-$\Upsilon_*$ prediction by more than about 0.2 dex would falsify the empirical AGB calibration, since the paper identifies blue, star-forming galaxies as the regime with the largest model uncertainty.
Extended reading notes
Core claim
The central claim is that a simple color, $g-W1$, plus a choice of bulge/disk decomposition, determines the WISE W1 mass-to-light ratio well enough to recover stellar masses consistent with Spitzer 3.6 micron masses and with independent literature stellar-mass estimates. The new $\Upsilon_*$ models replace uncertain theoretical AGB treatment with an empirical calibration on 116 LMC, SMC, and Milky Way star clusters, and they are built for three star formation history scenarios: pure disk, pure bulge, and a bulge+disk hybrid. Using these models on SPARC galaxies gives a mean offset of $0.02 \pm 0.18$ dex against Spitzer-based masses and an RMS scatter of 0.29 dex against an independent W1-W2 color relation. The authors convert WISE luminosity profiles into stellar mass density profiles that track Spitzer profiles, and they construct WISE luminosity and stellar-mass Tully-Fisher relations in which the stellar-mass version is more linear at high masses.
Load-bearing premise
The method stands or falls on the assumption that the AGB prescription calibrated on 116 Milky Way, LMC, and SMC star clusters applies to every galaxy type in the SPARC sample.
Editorial extensions
If this is right
- The all-sky WISE archive can replace pointed Spitzer 3.6 micron observations for stellar and baryonic mass studies, including total masses and radial mass profiles.
- Stellar mass Tully-Fisher relations built from WISE masses are more linear at the high-mass end because bulge-dominated galaxies receive higher mass-to-light ratios.
- Color-blind W1 luminosity-to-mass relations that use a constant $\Upsilon_*$ will systematically underpredict stellar masses in gas-rich, low-luminosity galaxies, inflating their gas fractions.
- Optical-to-near-IR colors such as $g-W1$ are sufficient to determine $\Upsilon_*$; full SED fitting did not improve agreement in the tested comparison samples.
Reading between the lines
- If the AGB calibration holds up, near-IR stellar masses for dwarf galaxies may need to be revised upward relative to color-blind WISE luminosity relations, which would remove the tension between low $\Upsilon_*$ values and the stability of spiral density waves.
- The same color-$\Upsilon_*$ machinery could be tested at high redshift by applying it to rest-frame near-IR JWST photometry, although the paper only gestures at this link.
- A stronger test than the paper offers would compare W1-based stellar masses against dynamical masses in galaxies where the dark matter fraction is measured independently, since that would bypass stellar population assumptions entirely.
- The 0.2 dex offset with the alternative total-flux relation could indicate that optically calibrated SED-fitting masses inherit too-low near-IR $\Upsilon_*$ values; the paper supports this indirectly through gas fraction plausibility rather than by a direct stellar population test.
Signed reviews
Editorial analysis
A structured set of objections, weighed in public.
Referee Report
Summary. The paper presents new stellar mass-to-light ratio (Upsilon*) models for converting WISE W1 fluxes into stellar masses, extending the authors' earlier SML models calibrated on Magellanic Cloud and Milky Way star clusters. The models are built from assumed star formation histories and chemical evolution scenarios, with an empirical AGB correction. The authors compare masses derived from W1 photometry with those from Spitzer 3.6um, S4G, Dustpedia, Cluver et al. (2014), and Jarrett et al. (2023), and also compare W1 and 3.6um surface brightness and mass density profiles. They find good agreement with most comparisons and present WISE luminosity and stellar mass Tully-Fisher relations for the SPARC sample.
Significance. If the models are reliable, they provide a practical path to stellar masses from all-sky WISE data, which is valuable now that Spitzer is no longer operational. The paper makes useful comparisons to S4G and Dustpedia that are partially independent of the authors' population synthesis, and it provides tabulated masses in machine-readable form. However, the central validation is weakened by the fact that the W1-to-Spitzer mass comparison shares the same stellar population models, and by an unresolved ~0.2 dex offset from Jarrett et al. (2023). The claimed accuracy of 0.1 dex for blue, low-mass galaxies therefore rests on assumptions that are not fully tested.
major comments (5)
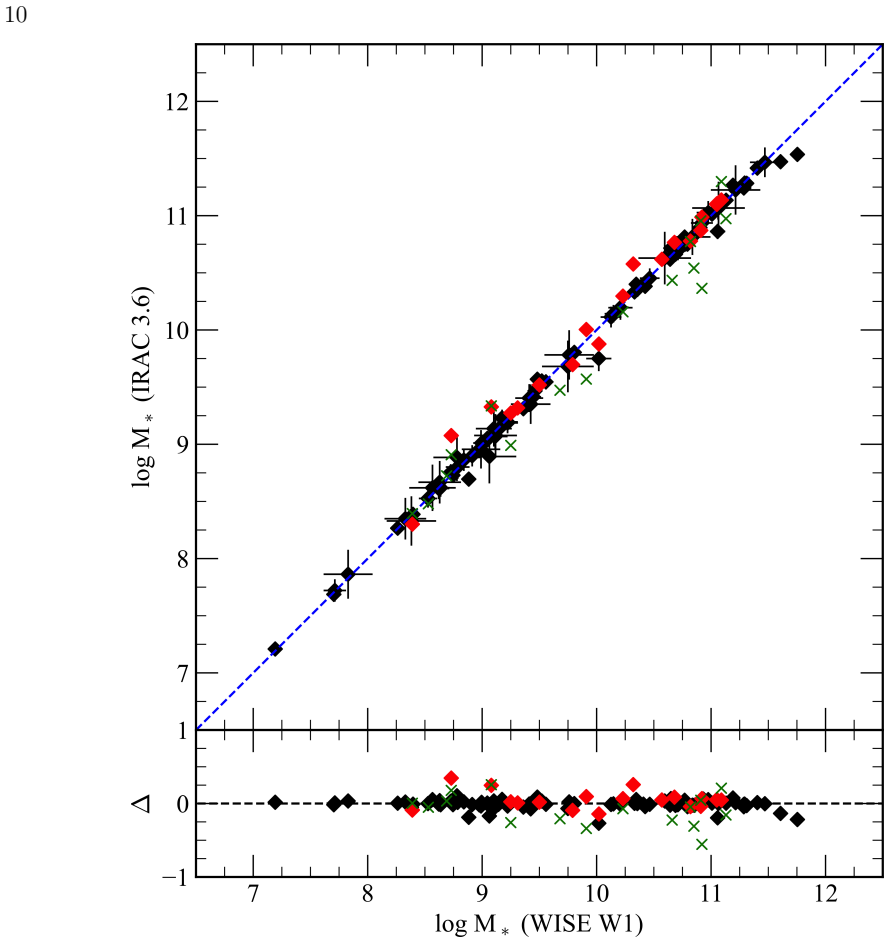
- [Section 4, Fig. 4] The W1-to-Spitzer mass comparison is not an independent validation of the Upsilon* scale because both masses are derived from the same SML stellar population models and the same empirical AGB prescription. Any systematic error in Upsilon* largely cancels in this comparison. The agreement in Fig. 4 confirms photometric consistency and the color-color relations, but it cannot validate the absolute stellar mass scale. The statement that 'the scatter is completely explained by photometric errors' is too strong. Please either rephrase the claim or provide a test that uses a fully independent Upsilon* determination, such as dynamical masses or SED fits that do not share the same AGB treatment.
- [Section 2] The empirical AGB prescription is anchored using V-K colors of 116 LMC, SMC, and Milky Way star clusters, and then propagated to W1 through K-[3.6] and [3.6]-W1 color-color relations. There is no direct test of the models against W1 or g-W1 colors of star clusters or of resolved stellar populations. This is a critical extrapolation because the paper's central product is the g-W1 color-Upsilon* relation. Please quantify the systematic uncertainty introduced by this propagation chain, and if possible test the final W1 Upsilon* models on clusters with W1 photometry. If no such test is possible, state clearly that the W1 AGB behavior is an assumption.
- [Section 3, Fig. 3] The disagreement with Jarrett et al. (2023) of roughly 0.2 dex is dismissed primarily through an argument about gas-fraction plausibility (Fig. 3). This is an indirect test: the low-Upsilon* values may indeed imply high gas fractions, but this is not a direct measurement of stellar population properties. Please provide a direct comparison with independent stellar mass estimates for the same galaxies, such as high-quality optical SED fits or dynamical mass constraints where the gas fraction is known. The unresolved 0.2 dex offset is significant relative to the claimed 0.1 dex accuracy and needs to be addressed quantitatively before the models can be adopted with confidence.
- [Section 3, Fig. 2] The comparison with Cluver et al. (2014) yields an RMS of 0.29 dex in log stellar mass for 58 galaxies. This scatter is much larger than the ~0.1 dex uncertainty quoted in the abstract for the Upsilon* models. The paper does not discuss whether this scatter is consistent with the quoted photometric and model errors, or whether it indicates an additional systematic floor in the W1-W2 method. Please quantify the expected scatter from the stated errors and compare it with the observed RMS.
- [Section 6, Fig. 7] The claim that the stellar mass TF 'improves the linearity of the entire correlation' is not supported by any quantitative fit statistics in the text. Please report the fitted slope, intercept, scatter, and the number of galaxies for both the luminosity TF and the stellar mass TF, so the reader can judge whether the improvement is significant. As written, the comparison with Ristea et al. (2023) is only qualitative.
minor comments (6)
- [Abstract] The phrase 'color-$\Upsilon_*$ (mass-to-light) models' is redundant; 'mass-to-light ratio' is clearer. Please use consistent terminology throughout.
- [Section 2, paragraph 3] The sentence 'Our stellar population models is based on...' should be 'Our stellar population models are based on...'.
- [Section 3, paragraph 4] The sentence 'This may signal a systematic difference in our W1 fluxes (unlikely) or a systematic underestimate of near-IR $\Upsilon_*$ values from optically determined SED fits' contains an unsupported parenthetical 'unlikely'. Please present both possibilities neutrally.
- [Section 5, paragraph 2] The phrase 'A optimal course' should be 'An optimal course'.
- [Section 4] The sample size for the W1-vs-Spitzer comparison is not clearly stated. Section 5 says 111 galaxies have good W1 and IRAC images, and 81 have SDSS imaging, but the number used in Fig. 4 is not given. Please specify the sample size in the text.
- [Introduction] The reference 'Duey et al. 2024' is mentioned as Paper I but does not appear in the reference list. Please add the full citation.
Circularity Check
W1–Spitzer mass agreement is partly internal because both filters use the same SML population models; the central Upsilon* relation still has independent support from S4G, Dustpedia, and Cluver.
-
fitted input called prediction
[Sec. 4 and Fig. 4 caption; Sec. 7 Summary item 1]
"While the same population models are used to deduce the stellar masses through the W1 or IRAC 3.6µm filters, the calibrations depend on the accuracy of the photometry ... Using the models from Fig. 1, the IRAC 3.6 µm and WISE W1 total luminosities are converted into total stellar masses in an independent fashion. This is a simple interpolation from our previous models, empirically tied to the Spitzer IRAC 3.6 µm colors and calibrated to stellar cluster colors to correct for short-lived AGB populations..."
The W1 color–Upsilon* models are constructed by interpolation from the authors' Spitzer-tied SML models and share the same AGB prescription. Therefore the W1-vs-Spitzer mass comparison in Fig. 4 is not an independent test of the stellar-population modeling: any systematic error in the AGB treatment, SFH, or chemical-enrichment assumptions enters both bands and largely cancels in the ratio. What the comparison genuinely tests is the W1-to-[3.6] photometric conversion and color-color propagation, not the absolute Upsilon* scale. Calling this 'independent' overstates the evidential weight; the paper's own wording acknowledges the models are similar. The truly external checks are S4G, Dustpedia, and Cluver et al., while the Jarrett et al.
full rationale
This manuscript is mostly self-contained as an empirical calibration paper: the color–Upsilon* relations are built from an explicitly stated SFH/chemical-enrichment recipe plus a cluster-calibrated AGB correction, and they are not fitted to W1 masses. The external comparisons (S4G/Eskew, Dustpedia, Cluver) provide independent anchoring, so the central claim is not reduced to a self-citation. The main circular element is that the headline W1-vs-Spitzer agreement is partly internal: both bands use the same SML population models and AGB prescription, so the agreement validates photometry/color-color propagation rather than the absolute Upsilon* scale. The paper itself concedes the models are similar and that a constant-Upsilon (Jarrett-type) solution is rejected on gas-fraction plausibility rather than by a direct stellar-population test. Score 4 reflects one partially by-construction validation embedded in an otherwise externally tested derivation.
Assumptions & free parameters
free parameters (5)
- Initial star formation epoch =
12 Gyr ago (z_f between 8 and 12)
- Star formation decline timescale =
burst declines or levels off by 4 Gyr
- Pre-enrichment metallicity floor =
[Fe/H] = -1.5
- Metallicity growth saturation =
80% of final metallicity, final value from mass-metallicity relation
- AGB empirical correction =
not given numerically
assumptions (5)
- domain assumption Standard stellar population synthesis codes (BC03, CG10) and their isochrones are a valid basis for building composite stellar populations.
- domain assumption All models assume an initial epoch of star formation 12 Gyr ago followed by a rapid burst that declines or levels off by 4 Gyr.
- domain assumption The mass-metallicity and mass-SFR relations are narrow enough that color uniquely determines Upsilon*.
- domain assumption The empirical AGB correction calibrated on LMC, SMC and MW star clusters applies to all SPARC galaxies.
- ad hoc to paper A sudden drop in AGB luminosity at near-solar metallicity creates the jump in Upsilon* at g-W1 = 3.3.
Cite this review
Pith. "Pith review of The Baryonic Tully-Fisher Relation II: Stellar Mass Models." pith.science (2026). https://pith.science/paper/7NCTOXCP
@misc{pith2026250110919,
  author       = {Pith},
  title        = {Pith review of: The Baryonic Tully-Fisher Relation II: Stellar Mass Models},
  year         = {2026},
  howpublished = {\url{https://pith.science/paper/7NCTOXCP}},
  note         = {Machine review of arXiv:2501.10919}
}
abstract
We present new color-$\Upsilon_*$ (mass-to-light) models to convert WISE W1 fluxes into stellar masses. We outline a range of possible star formation histories and chemical evolution scenarios to explore the confidence limits of stellar population models on the value of $\Upsilon_*$. We conclude that the greatest uncertainties (around 0.1 dex in $\Upsilon_*$) occur for the bluest galaxies with the strongest variation in recent star formation. For high mass galaxies, the greatest uncertainty arises from the proper treatment of bulge/disk separation in which to apply different $\Upsilon_*$ relations appropriate for those differing underlying stellar populations. We compare our deduced stellar masses with those deduced from {\it Spitzer} 3.6$\mu$m fluxes and stellar mass estimates in the literature using optical photometry and different $\Upsilon_*$ modeling. We find the correspondence to be excellent, arguing that rest-frame near-IR photometry is still more advantageous than other wavelengths.
Figures


Figures from the paper (4 more)


Reference graph
Works this paper leans on
- [1]
-
[2]
M., Maiolino, R., Belfiore, F., et al
doi:10.1086/160648 Baker, W. M., Maiolino, R., Belfiore, F., et al. 2023, MNRAS, 518,
-
[3]
2009, The Galaxy Disk in Cosmological Context, 254,
doi:10.1088/0067-0049/219/1/3 Prantzos, N. 2009, The Galaxy Disk in Cosmological Context, 254,
- [5]
- [15]
-
[18]
Bruzual, A. G. 1993, RMxAA, 26, 126 Bruzual, G., & Charlot, S. 2003, MNRAS, 344, 1000 Bruzual, A. G. 2009, arXiv:0911.0791. Cassata, P., Guzzo, L., Franceschini, A., et al. 2007, ApJS, 172,
work page Pith review arXiv 1993
-
[22]
E., Schinnerer, E., van de Ven, G., et al
Meidt, S. E., Schinnerer, E., van de Ven, G., et al. 2014, ApJ, 788,
work page 2014
-
[41]
Gallazzi, A., Charlot, S., Brinchmann, J., et al. 2006, MNRAS, 370,
work page 2006
Show all 48 references
-
[42]
S., Liao, T
Treu, T., Ellis, R. S., Liao, T. X., et al. 2005, ApJ, 633,
2005
-
[45]
R., Dalcanton, J
19 Weisz, D. R., Dalcanton, J. J., Williams, B. F., et al. 2011, ApJ, 739,
2011
-
[47]
Robotham, A. S. G., Bellstedt, S., Lagos, C. del P., et al. 2020, MNRAS, 495,
2020
-
[48]
Willmer, C. N. A. 2018, ApJS, 236,
2018
-
[49]
L., Eisenhardt, P
Wright, E. L., Eisenhardt, P. R. M., Mainzer, A. K., et al. 2010, AJ, 140,
2010
-
[77]
S., Schombert, J
McGaugh, S. S., Schombert, J. M., & Lelli, F. 2017, ApJ, 851,
2017
-
[82]
2011, Ap&SS, 331,
Walcher, J., Groves, B., Budav´ ari, T., et al. 2011, Ap&SS, 331,
2011
-
[90]
1996, ApJS, 103,
Courteau, S. 1996, ApJS, 103,
1996
-
[102]
doi:10.1093/mnras/stac3407 Brown, M. J. I., Moustakas, J., Smith, J.-D. T., et al. 2014, ApJS, 212,
2014 doi
-
[139]
2005, MNRAS, 362,
Gallazzi, A., Charlot, S., Brinchmann, J., et al. 2005, MNRAS, 362,
2005
-
[143]
J., S´ anchez, S
Ibarra-Medel, H. J., S´ anchez, S. F., Avila-Reese, V., et al. 2016, MNRAS, 463,
2016
-
[144]
C., Sheth, K., Regan, M., et al
Mu˜ noz-Mateos, J. C., Sheth, K., Regan, M., et al. 2015, ApJS, 219,
2015
-
[152]
S., Schombert, J
Lelli, F., McGaugh, S. S., Schombert, J. M., et al. 2019, MNRAS, 484,
2019
-
[154]
L., et al
Sheth, K., Regan, M., Hinz, J. L., et al. 2010, PASP, 122,
2010
-
[157]
S., Schombert, J
Lelli, F., McGaugh, S. S., Schombert, J. M., et al. 2017, ApJ, 836,
2017
-
[174]
B., Rizzi, L., Shaya, E
Tully, R. B., Rizzi, L., Shaya, E. J., et al. 2009, AJ, 138,
2009
-
[214]
2019, MNRAS, 483, 1496 Schombert, J., McGaugh, S., & Lelli, F
Schombert, J., McGaugh, S., & Lelli, F. 2019, MNRAS, 483, 1496 Schombert, J., McGaugh, S., & Lelli, F. 2022, AJ, 163,
2019
-
[253]
G., Baugh, C
Gonzalez-Perez, V., Lacey, C. G., Baugh, C. M., et al. 2014, MNRAS, 439,
2014
-
[264]
Graham, A. W. & Worley, C. C. 2008, MNRAS, 388,
2008
-
[270]
Clark, C. J. R., Verstocken, S., Bianchi, S., et al. 2018, A&A, 609, A37. Cluver, M. E., Jarrett, T. H., Hopkins, A. M., et al. 2014, ApJ, 782,
2018
-
[287]
C., Worthey, G., Faber, S
Trager, S. C., Worthey, G., Faber, S. M., et al. 1998, ApJS, 116,
1998
-
[289]
2023, MNRAS, 519,
Bell, R., Said, K., Davis, T., et al. 2023, MNRAS, 519,
2023
-
[290]
McGaugh, S. S. & Schombert, J. M. 2014, AJ, 148,
2014
- [323]
-
[363]
2019, A&A, 627, A42
18 Cresci, G., Mannucci, F., & Curti, M. 2019, A&A, 627, A42. Conroy, C. & Gunn, J. E. 2010, Astrophysics Source Code Library. ascl:1010.043 Consolandi, G., Gavazzi, G., Fumagalli, M., et al. 2016, A&A, 591, A38. de Vaucouleurs, G., de Vaucouleurs, A., Corwin, H. G., et al. 19...
2019
-
[381]
Rakos, K. D. & Schombert, J. M. 1995, ApJ, 439,
1995
-
[469]
J., Lynden-Bell, D., & Sandage, A
Eggen, O. J., Lynden-Bell, D., & Sandage, A. R. 1962, ApJ, 136,
1962
-
[547]
Tinsley, B. M. 1978, Structure and Properties of Nearby Galaxies, 77, 15 Tinsley, B. M. 1980, FCPh, 5,
1978
-
[646]
2005, Multiwavelength Mapping of Galaxy Formation and Evolution,
Maraston, C. 2005, Multiwavelength Mapping of Galaxy Formation and Evolution,
2005
-
[748]
2012, AJ, 143,
Eskew, M., Zaritsky, D., & Meidt, S. 2012, AJ, 143,
2012
-
[905]
M., Madhav, K., Stoll, A., et al
Roth, M. M., Madhav, K., Stoll, A., et al. 2023, Proc. SPIE, 12424, 124240B. Salaris, M., Weiss, A., Cassar` a, L. P., et al. 2014, A&A, 565, A9. Schombert, J. M. & McGaugh, S. 2014, PASA, 31, e011. Schombert, J. M. 2016, AJ, 152,
2023
-
[1106]
& Bell, E
Gallazzi, A. & Bell, E. F. 2009, ApJS, 185,
2009
-
[1397]
S., Steinhardt, C
Speagle, J. S., Steinhardt, C. L., Capak, P. L., et al. 2014, ApJS, 214,
2014
-
[1587]
Tinsley, B. M. 1968, ApJ, 151,
1968
-
[1708]
Hogg, D. W. 2022, arXiv:2206.00989. Hosek, M. W., Lu, J. R., Lam, C. Y., et al. 2020, AJ, 160,
2022 arXiv
-
[1861]
N., Hopkins, A
Taylor, E. N., Hopkins, A. M., Baldry, I. K., et al. 2011, MNRAS, 418,
2011
-
[2799]
H., Cluver, M
Jarrett, T. H., Cluver, M. E., Taylor, E. N., et al. 2023, arXiv:2301.05952. Korsaga, M., Famaey, B., Freundlich, J., et al. 2023, ApJL, 952, L41. Lee, J. H., Pak, M., Jeong, H., et al. 2023, MNRAS, 521,
2023 arXiv
-
[3267]
doi:10.1093/mnras/stz205 Lin, C. C. & Shu, F. H. 1964, ApJ, 140,
1964 doi
-
[4207]
S., & Schombert, J
doi:10.1093/mnras/stad814 Lelli, F., McGaugh, S. S., & Schombert, J. M. 2016, AJ, 152,
2016 doi
-
[4767]
F., McIntosh, D
doi:10.1093/mnras/stac3413 Bell, E. F., McIntosh, D. H., Katz, N., et al. 2003, ApJS, 149,
2003 doi
Reviewed August 10, 2026 · model on record in the stance chip above.
Discussion (0). Continue with ORCID to comment.