REVIEW 4 major objections 7 minor 46 references
Three Brown Dwarfs Masquerading as High-Redshift Galaxies in JWST Observations
T0 review · 4 major / 7 minor · reviewed 2026-08-10 · deepseek-v4-flash
Pith's one-line read Three red sources in a JWST deep-field survey are not distant galaxies but brown dwarfs about 2 kpc away, implying a ~0.1% contamination of extragalactic samples.
desk verdict Plausible brown dwarf identifications in JWST extragalactic fields, but the two new L dwarfs need a galaxy-template null test before the 'spectroscopic identification' claim is solid; the T dwarf is on firm ground. read the letter →
The pith
A machine-rendered reading of the paper's core claim, the machinery that carries it, and where it could break.
The reading
What carries the argument
The spectral signature carrying the argument is the V-shaped near-infrared energy distribution of substellar atmospheres: strong water and methane absorption bands make the spectrum peak near 1 and 4 µm and drop sharply elsewhere, which at JWST wavelengths mimics the rest-frame UV/optical breaks of reddened high-redshift galaxies and little red dots. The identification pipeline is a visual screen of all 3,194 PRISM/CLEAR spectra for this peak pattern at 1–2.4 µm, followed by forward modeling: the three candidate spectra are convolved to PRISM resolution and fit with linearly interpolated grids of the Sonora Elf Owl, ATMO2020++, and BT-settl CIFIST models using the nested-sampling Monte Carlo algorithm MLFriends (UltraNest), with a scaling factor $R^2/D^2$ as a free parameter. Mass, radius, age, and distance follow from the Chabrier et al. (2023) evolutionary model, and the contamination argument is completed by placing the sources on NIRCam color-color and color-magnitude diagrams together with the RUBIES galaxy sample and the Kocevski et al. (2024) little-red-dot catalog.
What would settle it
Obtain medium-resolution spectra of o005_s41280 and o006_s35616 (for instance with NIRSpec G395M, which the same survey already uses) and check whether the resolved water band heads and the ~2.2 µm methane feature are reproduced by the best-fit L-dwarf templates at zero redshift; if the band shapes or positions instead match a reddened high-redshift galaxy template, the brown-dwarf classification and the 0.1% contamination rate would collapse.
Extended reading notes
Core claim
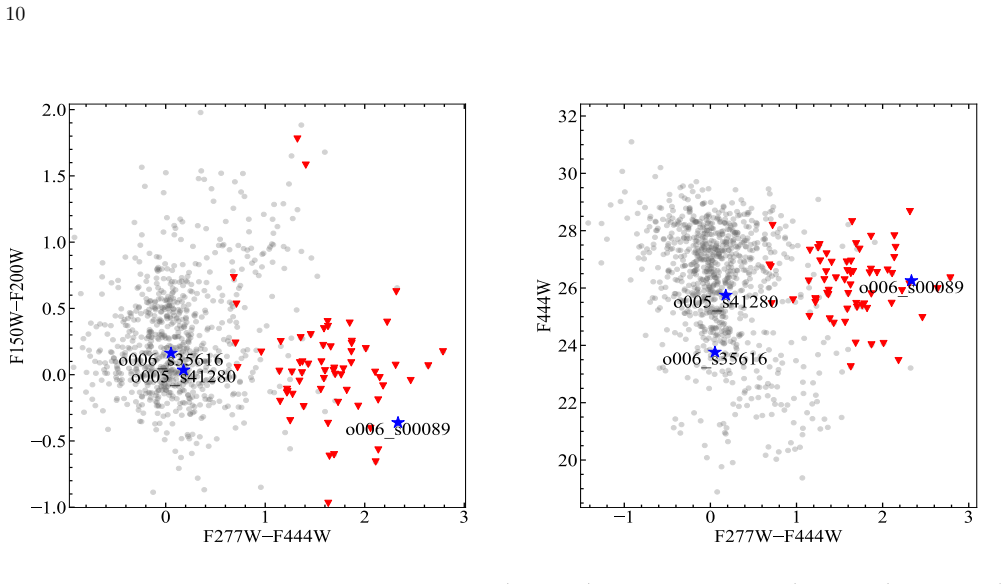
The authors establish that, within a sample of 3,194 bright F444W-selected sources observed with JWST NIRSpec PRISM/CLEAR spectroscopy in the RUBIES survey, three objects selected as extragalactic candidates are in fact Milky Way brown dwarfs. Fitting the spectra with three independent substellar atmosphere models (Sonora Elf Owl, ATMO2020++, and BT-settl CIFIST) within a nested-sampling Bayesian framework yields effective temperatures of 2100–2300 K and 1800–2000 K for o005_s41280 and o006_s35616 (L dwarfs) and below 1000 K for o006_s00089 (late T dwarf), with distances around 2 kpc. On NIRCam color-color and color-magnitude diagrams the hotter L dwarfs fall inside the cluster of high-redshift galaxy candidates, while the cooler T dwarf overlaps the little red dot population, directly demonstrating that these sources masquerade as two different classes of extragalactic objects. The paper argues this implies a brown-dwarf contamination rate of approximately 0.1% (3 out of 3,194) in extragalactic deep-field surveys, with hotter L dwarfs detected more frequently than cooler T and Y dwarfs.
Load-bearing premise
The classification rests on the assumption that the low-resolution PRISM/CLEAR spectra, with the 0.6–0.95 µm range excluded, contain enough water and methane band structure that the Sonora Elf Owl, ATMO2020++, and BT-settl CIFIST model grids are trustworthy templates, even though those models leave residuals of up to about 20% in the Y, J, and H bands for the two L dwarfs.
Editorial extensions
If this is right
- Two of the three contaminants are L dwarfs, which photometric brown-dwarf searches that select red T/Y dwarf candidates miss; L dwarfs therefore contaminate high-redshift galaxy samples more often than previously accounted for.
- Late T and Y dwarfs overlap with little red dots in F277W−F444W color space, so spectroscopically unconfirmed LRD samples may contain some substellar interlopers.
- A contamination rate near 0.1% (3 in 3,194 spectra), with a true rate possibly between 0.01% and 0.1% depending on selection, gives a quantitative prior for correcting galaxy and AGN statistics in JWST deep fields.
- Current substellar atmosphere models reproduce the L-dwarf spectra only to roughly 20% residuals in the Y, J, and H bands, so improved dust opacity treatment is needed before reliable surface gravity, age, and distance can be claimed for such sources.
- The consistency with an independent photometric identification of the T dwarf (CEERS-EGS-BD-4) shows that brown dwarfs in extragalactic fields can be characterized by photometric and spectroscopic routes that agree.
Reading between the lines
- By extension, AGN demographics built from little-red-dot samples may be slightly inflated wherever substellar contaminants are not spectroscopically vetted; the ~0.1% rate is small, but the T-dwarf overlap with LRD color space marks exactly where such a correction would bite.
- The same screening-plus-model-fitting procedure applied to the PRIMER half of RUBIES and to future wide-area JWST surveys should find more contaminants, and the 2:1 L-to-T dwarf ratio found here is a testable prediction against the local field brown-dwarf census.
- The ~20% Y/J/H band residuals and the 3–4 mag extinction degeneracy reported for o006_s35616 predict that higher-resolution NIRSpec G395M spectra will reveal either unmodeled dust opacity or an alternative reddened template, a distinction the present low-resolution data cannot settle.
- If multi-epoch images of these fields become available, proper-motion measurements at roughly 3 mas/yr (a 30 km/s transverse velocity at 2 kpc) would independently confirm the brown-dwarf interpretation without any atmosphere-model assumptions.
Editorial analysis
A structured set of objections, weighed in public.
Referee Report
Summary. The paper reports the discovery of three brown dwarf candidates (o005_s41280, o006_s00089, o006_s35616) within the JWST RUBIES NIRSpec PRISM/CLEAR extragalactic survey. The authors fit the observed 0.95–5.3 µm spectra with publicly available substellar atmosphere models (Sonora Elf Owl, ATMO2020++, BT-settl CIFIST) using a nested-sampling Bayesian framework, and derive Teff, log g, and other parameters. They classify o005_s41280 and o006_s35616 as L dwarfs with Teff roughly 1800–2300 K, and o006_s00089 as a late T dwarf with Teff < 1000 K. Using evolutionary models and an assumed 1–5 Gyr age range, they estimate distances of order 1–5 kpc. A color–color and color–magnitude analysis places the T dwarf in the LRD region and the L dwarfs in the high-redshift galaxy locus, and the paper quotes a brown dwarf contamination rate of approximately 0.1% (3/3194) in extragalactic deep field surveys.
Significance. If the identifications are correct, the paper provides concrete examples of brown dwarfs masquerading as high-redshift galaxies and LRDs in JWST deep fields, which is useful for assessing contamination in extragalactic surveys. The work is based on public data, uses standard forward-modeling with publicly available atmosphere models and a nested-sampling code (UltraNest), and for o006_s00089 the derived parameters agree with the independent analysis of Hainline et al. (2024). The paper is also explicit about several limitations, including the ~20% YJH residuals, the large Teff shift when extinction is added, and the log g values lying outside evolutionary model grids. However, the strength of the paper as a whole is limited by the fact that the two L-dwarf classifications rest on fits to substellar models only, with no comparison against reddened galaxy templates, despite the sources being selected from an extragalactic survey; the derived contamination rate is also based on the same discovery sample. With additional null tests and a more careful treatment of systematic parameter uncertainties, the paper could make a solid contribution.
major comments (4)
- [Section 3.2 (Eq. 1)] The fitting procedure in Section 3.2 evaluates the likelihood in Eq. (1) only against substellar atmosphere models; no galaxy SED or reddened star-forming galaxy template is fitted to the observed spectra. Since the candidates were selected from an extragalactic survey because they resemble galaxies (Section 2), the 'spectroscopic identification' of o005_s41280 and o006_s35616 as brown dwarfs is not established without a differential test. The authors should fit representative reddened galaxy templates (e.g., dusty star-forming galaxies at z ~ 1–4) to the same spectra and show that the brown dwarf models are preferred by a meaningful margin (e.g., ΔlnL or reduced chi-squared). This is a load-bearing issue for the central claim.
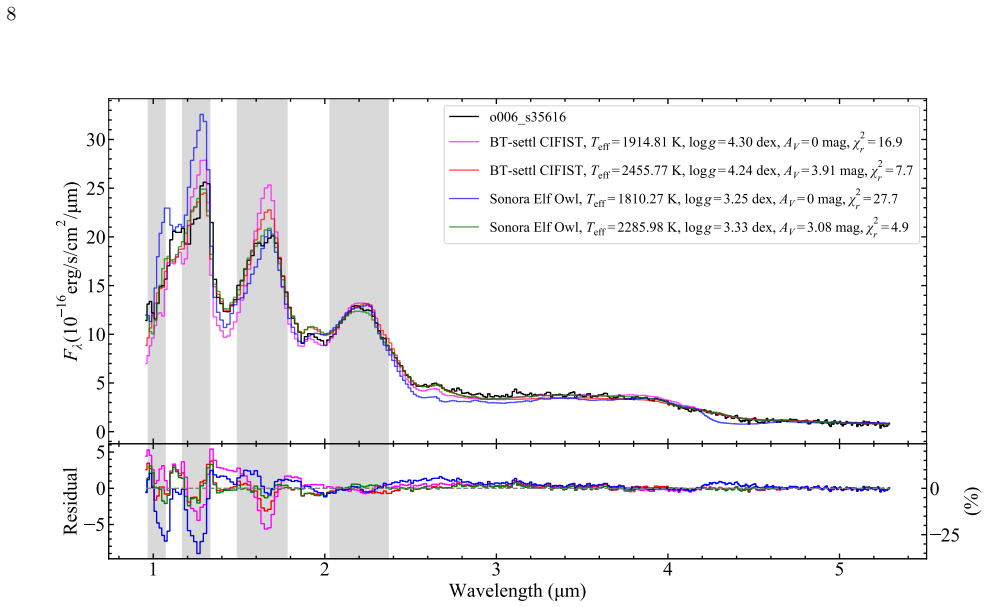
- [Section 4.2 and Table 2] The paper reports residuals of up to ~20% of the maximum observed flux in the Y, J, and H bands for the two L dwarfs, especially o006_s35616. These residuals are much larger than the formal parameter uncertainties quoted in Table 2 (Teff uncertainties of ~0.6–25 K) and indicate that the best-fit models do not reproduce the observed spectra within the statistical errors. If the residuals reflect systematic deficiencies in the models rather than noise, the inferred Teff and the L-dwarf classifications (M9–L1 and L3–L4) are not robust. The paper should quantify the goodness of fit (e.g., reduced chi-squared), test whether the classification changes when the YJH region is excluded, and discuss whether the residual pattern is consistent with molecular opacity errors.
- [Section 4.3, Table 3] For o006_s35616, including a free extinction parameter shifts Teff from roughly 1810–1915 K to 2286–2456 K, a change of ~475–540 K, while also altering log g and metallicity. The paper notes that this shift may be unrealistic (citing Hurt et al. 2024), but the existence of such a large systematic shift means the formal posterior uncertainties quoted in Table 2 (a few K) do not represent the true uncertainty in Teff. The '1800–2000 K L3–L4' classification is therefore not secure unless the extinction–Teff degeneracy is addressed, for example by placing a physically motivated prior on AV based on the negligible foreground extinction measured in Section 3.2, or by explicitly reporting the degeneracy as a systematic uncertainty.
- [Section 4.1 and Table 2] The derived log g values for o005_s41280 (3.29–3.50) and for o006_s35616 from the Sonora Elf Owl model (3.25) lie outside or at the boundary of the Chabrier et al. (2023) evolutionary model grid, and the paper then adopts an assumed age range of 1–5 Gyr to derive distances. This assumed age is not observationally justified for these sources, and the resulting distance estimates (0.9–4.7 kpc) have large asymmetric uncertainties that are not propagated into the summary statement that the candidates are 'about 2 kpc away'. Since the distance is used later to argue these are foreground objects and to contextualize the contamination rate, the distance claim is not robust and should be presented as a model-dependent assumption rather than a measurement.
minor comments (7)
- [Section 2] The visual inspection of 3194 spectra is described qualitatively ('thorough manual inspection') with no quantitative selection criteria; the authors should specify the exact features used, the number of rejected candidates, and ideally provide the inspection code or a reproducible decision rule so the selection can be independently audited.
- [Figure 1] The residual panels are difficult to read: the y-axis label says 'percentage residuals' but the scale appears to be fractional residuals, and the 20% level mentioned in the text is not marked. Please label the axis consistently (e.g., 'Residual / max(F_obs)') and draw a horizontal line at ±0.2 for clarity.
- [Section 4.2] In the bullet list of band-by-band comparisons, the K band is given as 2.03–2.37 µm, but the text does not specify which gray-shaded regions in Figure 1 correspond to the Y, J, H, and K bands; please add explicit labels to the figure or the caption.
- [Section 5.1] The contamination rate of 'approximately 0.1%' is computed as 3/3194 from the very same RUBIES sample in which the candidates were discovered, and the paper correctly notes that the selection favors brown dwarfs. However, the phrasing 'in extragalactic deep field surveys' overgeneralizes; recommend rephrasing to 'in the RUBIES sample' and explicitly stating that the value is an upper limit given the selection biases.
- [Section 3.1] The sentence 'The cloud substellar atmospheric models could match those of observed L dwarfs well than the cloudless atmospheric models' contains a grammatical error and should be rephrased, for example as 'Cloud-inclusive substellar atmospheric models generally match observed L dwarfs better than cloudless models do.'
- [Table 2] The notation in Table 2 is confusing for entries marked with an asterisk: the note states that the asterisk indicates the parameter does not exist or is not a free parameter, yet values are listed for these entries (e.g., [M/H] for BT-settl CIFIST). Clarify whether these values come from the models' fixed parameter choices or from the fitting, and consider using 'not free' instead of an ambiguous asterisk.
- [Figure 3] The photometric error bars are not shown for the three candidates or the comparison samples; if the errors are smaller than the plot symbols, state this explicitly, otherwise add error bars to assess the significance of the color separations.
Circularity Check
No significant circularity: the brown-dwarf classifications are forward-model fits to public atmosphere grids, with minor self-citations that are not load-bearing.
full rationale
The derivation chain does not reduce to its inputs. Candidates were preselected by visual comparison with published brown-dwarf spectra (Luhman et al. 2017; Tu et al. 2024), but Teff, log g, metallicity, and the scaling factor are then obtained by fitting three independent public substellar atmosphere grids through the likelihood in Eq. (1); these parameters are outputs, not assumptions. The self-cited extinction law of Wang & Chen (2024) is used only in the Section 4.3 robustness experiment, whose large AV values and roughly 500 K Teff shifts the authors explicitly call potentially unrealistic, so the central classification does not rest on that self-citation. The one source with an independent literature measurement, o006_s00089, agrees with Hainline et al. (2024), providing an external anchor for the method. The 0.1% contamination rate is simply 3/3194 in the same RUBIES sample; the paper labels it an estimate and notes that the target selection likely inflates it, so it is a transparent summary statistic rather than a fitted value renamed as a prediction. The absence of a galaxy-template null test and the roughly 20% Y, J, H residuals documented in Section 4.2 are robustness concerns, not circularity, because no output quantity is defined in terms of the selection criterion. The score of 2 reflects the presence of minor self-citations (Tu et al. 2024; Wang & Chen 2024) that are not load-bearing for the central claim.
Assumptions & free parameters
free parameters (8)
- Teff (effective temperature) =
955-998 K (o006_s00089), 2162-2256 K (o005_s41280), 1810-1915 K (o006_s35616) depending on model
- log g (surface gravity) =
3.25-5.49 cm/s^2
- [M/H] (metallicity) =
-0.18 to 1.00 dex
- C/O (carbon-to-oxygen ratio) =
0.59-0.75
- log Kzz (eddy diffusion coefficient) =
2.08-3.53 cm^2/s
- log(R^2/D^2) (scale factor) =
-23.25 to -24.01
- AV (extinction) =
3.08-3.91 mag for o006_s35616, 1-1.5 mag for o005_s41280, ~0 for o006_s00089
- Assumed age range =
1-5 Gyr
assumptions (6)
- domain assumption Substellar atmosphere models (Sonora Elf Owl, ATMO2020++, BT-settl CIFIST) approximate real brown dwarf spectra in the fitted wavelength range.
- domain assumption The extinction law of Wang & Chen (2024) is appropriate for the 0.6-5.3 µm wavelength range.
- domain assumption Evolutionary models of Chabrier et al. (2023) correctly map Teff and log g to mass, radius, and age.
- domain assumption The Haywood et al. (2013) relation between vertical height Z and stellar age applies to these brown dwarfs.
- standard math Nested sampling with uniform priors and the Gaussian likelihood (Eq. 1) yields unbiased posterior distributions.
- domain assumption Foreground interstellar extinction is negligible based on the Green et al. (2019) 3D map.
Cite this review
Pith. "Pith review of Three Brown Dwarfs Masquerading as High-Redshift Galaxies in JWST Observations." pith.science (2026). https://pith.science/paper/A3B3YJVE
@misc{pith2026250116648,
  author       = {Pith},
  title        = {Pith review of: Three Brown Dwarfs Masquerading as High-Redshift Galaxies in JWST Observations},
  year         = {2026},
  howpublished = {\url{https://pith.science/paper/A3B3YJVE}},
  note         = {Machine review of arXiv:2501.16648}
}
abstract
We report the spectroscopic identification of three brown dwarf candidates -- o005_s41280, o006_s00089, and o006_s35616 -- discovered in the RUBIES using James Webb Space Telescope (JWST) Near-Infrared Spectrograph (NIRSpec) PRISM/CLEAR spectroscopy. We fit these sources with multiple substellar atmosphere models and present the atmospheric parameters, including effective temperature ($T_\mathrm{eff}$), surface gravity, and other derived properties. The results suggest that o005_s41280 and o006_s35616, with $T_\mathrm{eff}$ in the ranges of 2100--2300 K and 1800--2000 K, are likely L dwarfs, while o006_s00089, with $T_\mathrm{eff} < 1000$ K, is consistent with a late T dwarf classification. The best-fit model spectra provide a reasonable match to the observed spectra. However, distinct residuals exist in the $Y$, $J$, and $H$ bands for the two L dwarf candidates, particularly for o006_s35616. Incorporating the extinction parameter into the fitting process can significantly reduce these residuals. The distance estimates indicate that these candidates are about 2 kpc away. The analysis of the color-color diagram using multiple JWST NIRcam photometry suggests that cooler T dwarfs, such as o006_s00089, overlap with little red dots (LRDs), while hotter L dwarfs, like o005_s41280 and o006_s35616, tend to contaminate the high-redshift galaxy cluster. These findings suggest a brown dwarf contamination rate of approximately 0.1% in extragalactic deep field surveys, with L dwarfs being more frequently detected than cooler T and Y dwarfs.
Figures

Reference graph
Works this paper leans on
-
[1]
Allard, F., Homeier, D., & Freytag, B. 2012, Philosophical Transactions of the Royal Society of London Series A, 370, 2765, doi: 10.1098/rsta.2011.0269
-
[2]
2015, A&A, 577, A42, doi: 10.1051/0004-6361/201425481
Baraffe, I., Homeier, D., Allard, F., & Chabrier, G. 2015, A&A, 577, A42, doi: 10.1051/0004-6361/201425481
-
[3]
Barro, G., P´ erez-Gonz´ alez, P. G., Kocevski, D. D., et al. 2024, ApJ, 963, 128, doi: 10.3847/1538-4357/ad167e Bogd´ an,´A., Goulding, A. D., Natarajan, P., et al. 2024, Nature Astronomy, 8, 126, doi: 10.1038/s41550-023-02111-9
-
[4]
2016, Statistics and Computing, 26, 383, doi: 10.1007/s11222-014-9512-y —
Buchner, J. 2016, Statistics and Computing, 26, 383, doi: 10.1007/s11222-014-9512-y —. 2019, PASP, 131, 108005, doi: 10.1088/1538-3873/aae7fc —. 2021, The Journal of Open Source Software, 6, 3001, doi: 10.21105/joss.03001
-
[5]
Burgasser, A. J. 2014, in Astronomical Society of India Conference Series, Vol. 11, Astronomical Society of India Conference Series, 7–16, doi: 10.48550/arXiv.1406.4887
-
[6]
Burgasser, A. J., Kirkpatrick, J. D., Brown, M. E., et al. 2002, ApJ, 564, 421, doi: 10.1086/324033
doi:10.1086/324033 2002
-
[7]
J., Bezanson, R., Labbe, I., et al
Burgasser, A. J., Bezanson, R., Labbe, I., et al. 2024, ApJ, 962, 177, doi: 10.3847/1538-4357/ad206f
-
[8]
2011, SoPh, 268, 255, doi: 10.1007/s11207-010-9541-4
Bonifacio, P. 2011, SoPh, 268, 255, doi: 10.1007/s11207-010-9541-4
Show all 46 references
-
[9]
2023, A&A, 671, A119, doi: 10.1051/0004-6361/202243832
Chabrier, G., Baraffe, I., Phillips, M., & Debras, F. 2023, A&A, 671, A119, doi: 10.1051/0004-6361/202243832
2023 doi
- [10]
-
[11]
S., Abraham, R
Dunlop, J. S., Abraham, R. G., Ashby, M. L. N., et al. 2021, PRIMER: Public Release IMaging for Extragalactic
2021
-
[12]
L., Bagley, M
Finkelstein, S. L., Bagley, M. B., Ferguson, H. C., et al. 2023, ApJL, 946, L13, doi: 10.3847/2041-8213/acade4
2023 doi
-
[13]
2016, The Journal of Open Source Software, 1, 24, doi: 10.21105/joss.00024
Foreman-Mackey, D. 2016, The Journal of Open Source Software, 1, 24, doi: 10.21105/joss.00024
2016 doi
-
[14]
2019, ApJ, 887, 93, doi: 10.3847/1538-4357/ab5362
Finkbeiner, D. 2019, ApJ, 887, 93, doi: 10.3847/1538-4357/ab5362
2019 doi
-
[15]
N., Helton, J
Hainline, K. N., Helton, J. M., Johnson, B. D., et al. 2024, ApJ, 964, 66, doi: 10.3847/1538-4357/ad20d1
2024 doi
-
[16]
R., Millman, K
Harris, C. R., Millman, K. J., van der Walt, S. J., et al. 2020, Nature, 585, 357, doi: 10.1038/s41586-020-2649-2
2020 doi
-
[17]
D., Katz, D., & G´ omez, A
Haywood, M., Di Matteo, P., Lehnert, M. D., Katz, D., & G´ omez, A. 2013, A&A, 560, A109, doi: 10.1051/0004-6361/201321397
2013 doi
-
[18]
Baldassare, V. F. 2016, ApJ, 830, 96, doi: 10.3847/0004-637X/830/2/96
2016 doi
-
[19]
Hunter, J. D. 2007, Computing in Science & Engineering, 9, 90, doi: 10.1109/MCSE.2007.55
2007 doi
-
[20]
A., Liu, M
Hurt, S. A., Liu, M. C., Zhang, Z., et al. 2024, ApJ, 961, 121, doi: 10.3847/1538-4357/ad0b12
2024 doi
-
[21]
2022, A&A, 661, A80, doi: 10.1051/0004-6361/202142663
Jakobsen, P., Ferruit, P., Alves de Oliveira, C., et al. 2022, A&A, 661, A80, doi: 10.1051/0004-6361/202142663
2022 doi
-
[22]
Kirkpatrick, J. D. 2005, ARA&A, 43, 195, doi: 10.1146/annurev.astro.42.053102.134017
2005
- [23]
-
[24]
2023, ApJL, 957, L27, doi: 10.3847/2041-8213/acfeec
Langeroodi, D., & Hjorth, J. 2023, ApJL, 957, L27, doi: 10.3847/2041-8213/acfeec
2023 doi
-
[25]
K., Morley, C
Leggett, S. K., Morley, C. V., Marley, M. S., & Saumon, D. 2015, ApJ, 799, 37, doi: 10.1088/0004-637X/799/1/37
2015 doi
-
[26]
K., & Tremblin, P
Leggett, S. K., & Tremblin, P. 2023, ApJ, 959, 86, doi: 10.3847/1538-4357/acfdad
2023 doi
-
[27]
K., Tremblin, P., Esplin, T
Leggett, S. K., Tremblin, P., Esplin, T. L., Luhman, K. L., & Morley, C. V. 2017, ApJ, 842, 118, doi: 10.3847/1538-4357/aa6fb5
2017 doi
-
[28]
Lodders, K., Palme, H., & Gail, H. P. 2009, Landolt Börnstein, 4B, 712, doi: 10.1007/978-3-540-88055-4 34 13 log Kzz = 2.08+0.13 0.06 1800 1808 1816 1824 Teff Teff = 1810.27+3.63 3.54 3.2515 3.2530 3.2545 log g log g = 3.25+0.00 0.00 0.988 0.992 0.996 [M/H] [M/H] = 1.00+0...
2009 doi
-
[29]
L., Mamajek, E
Luhman, K. L., Mamajek, E. E., Shukla, S. J., & Loutrel, N. P. 2017, AJ, 153, 46, doi: 10.3847/1538-3881/153/1/46
2017 doi
-
[30]
2024, AJ, 167, 168, doi: 10.3847/1538-3881/ad2938
Manjavacas, E., Tremblin, P., Birkmann, S., et al. 2024, AJ, 167, 168, doi: 10.3847/1538-3881/ad2938
2024 doi
-
[31]
C., Lucas, P
Marocco, F., Day-Jones, A. C., Lucas, P. W., et al. 2014, MNRAS, 439, 372, doi: 10.1093/mnras/stt2463
2014 doi
-
[32]
P., Brammer, G., et al
Matthee, J., Naidu, R. P., Brammer, G., et al. 2024, ApJ, 963, 129, doi: 10.3847/1538-4357/ad2345
2024 doi
-
[33]
M., Leggett, S
Meisner, A. M., Leggett, S. K., Logsdon, S. E., et al. 2023, AJ, 166, 57, doi: 10.3847/1538-3881/acdb68
2023 doi
-
[34]
Merlin, E., Santini, P., Paris, D., et al. 2024, A&A, 691, A240, doi: 10.1051/0004-6361/202451409 14 log Kzz = 3.53+0.56 0.47 900 930 960 990 Teff Teff = 955.41+15.63 16.57 3.6 4.0 4.4 log g log g = 4.34+0.18 0.20 0.30 0.45 0.60 [M/H] [M/H] = 0.41+0.05 0.05 0.48 0.56 0.64 0.72...
2024 doi
-
[35]
V., Fortney, J
Morley, C. V., Fortney, J. J., Marley, M. S., et al. 2012, ApJ, 756, 172, doi: 10.1088/0004-637X/756/2/172
2012 doi
-
[36]
J., Morley, C
Mukherjee, S., Fortney, J. J., Morley, C. V., et al. 2024, ApJ, 963, 73, doi: 10.3847/1538-4357/ad18c2 P´ erez-Gonz´ alez, P. G., Barro, G., Rieke, G. H., et al. 2024, ApJ, 968, 4, doi: 10.3847/1538-4357/ad38bb
2024 doi
-
[37]
W., Tremblin, P., Baraffe, I., et al
Phillips, M. W., Tremblin, P., Baraffe, I., et al. 2020, A&A, 637, A38, doi: 10.1051/0004-6361/201937381
2020 doi
-
[38]
S., Mourier, P., et al
Tremblin, P., Amundsen, D. S., Mourier, P., et al. 2015, ApJL, 804, L17, doi: 10.1088/2041-8205/804/1/L17
2015 doi
-
[39]
2024, ApJ, 976, 82, doi: 10.3847/1538-4357/ad815a
Tu, Z., Wang, S., & Liu, J. 2024, ApJ, 976, 82, doi: 10.3847/1538-4357/ad815a
2024 doi
- [40]
-
[41]
Wang, B., Leja, J., de Graaff, A., et al. 2024b, ApJL, 969, L13, doi: 10.3847/2041-8213/ad55f7 15 log Kzz = 3.11+1.04 0.77 2100 2150 2200 2250 Teff Teff = 2162.19+24.78 21.52 3.30 3.45 3.60 log g log g = 3.29+0.06 0.03 0.50 0.25 0.00 0.25 [M/H] [M/H] = 0.18+0.07 0.08 0.705 0.7...
-
[42]
Wang, P.-Y., Goto, T., Ho, S. C. C., et al. 2023, MNRAS, 523, 4534, doi: 10.1093/mnras/stad1679
2023 doi
-
[43]
2019, ApJ, 877, 116, doi: 10.3847/1538-4357/ab1c61 —
Wang, S., & Chen, X. 2019, ApJ, 877, 116, doi: 10.3847/1538-4357/ab1c61 —. 2024, ApJL, 964, L3, doi: 10.3847/2041-8213/ad2e98
2019 doi
- [44]
-
[45]
C., Marley, M
Zhang, Z., Liu, M. C., Marley, M. S., Line, M. R., & Best, W. M. J. 2021, ApJ, 921, 95, doi: 10.3847/1538-4357/ac0af7
2021 doi
-
[46]
C., et al
Zhang, Z., Mukherjee, S., Liu, M. C., et al. 2024, arXiv e-prints, arXiv:2410.10939, doi: 10.48550/arXiv.2410.10939 16 Teff = 998.53+5.68 7.05 5.425 5.450 5.475 log g log g = 5.49+0.00 0.01 0.24 0.26 0.28 [M/H] [M/H] = 0.29+0.00 0.01 950 975 1000 1025 Teff 23.89 23.86 23.83 23...
Reviewed August 10, 2026 · model on record in the stance chip above.
Discussion (0). Continue with ORCID to comment.