Conformal Reliability: A New Evaluation Metric for Conditional Generation
Pith reviewed 2026-06-28 23:47 UTC · model grok-4.3
The pith
A reliability score based on conformal prediction measures the worst-case performance of conditional generative models within a prediction set.
A machine-rendered reading of the paper's core claim, the machinery that carries it, and where it could break.
Core claim
The central claim is that the reliability score, defined as the minimum value of a performance metric over a conformal prediction set at a chosen confidence level, provides a meaningful evaluation of conditional generation models, and that the CReL framework can construct sets with the desired coverage while optimizing this score efficiently.
What carries the argument
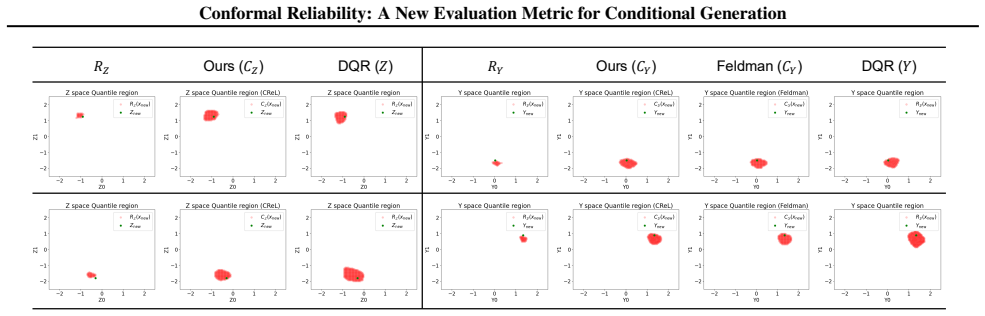
Conformal prediction sets, which are constructed to contain the true conditional output with a pre-specified probability, serving as the domain over which the worst-case reliability is computed.
If this is right
- The prediction sets achieve the desired coverage as proven theoretically.
- The method produces more informative prediction sets than prior approaches.
- The reliability score offers interpretability for tasks such as image-to-text and text-to-image generation.
- The framework demonstrates validity and effectiveness in experiments on synthetic and real data.
Where Pith is reading between the lines
- This metric could potentially be incorporated into model selection or hyperparameter tuning processes for generative models.
- Similar conformal approaches might apply to evaluating other types of uncertain predictions beyond generation.
- Developers might use the score to identify and mitigate failure modes in specific input conditions.
Load-bearing premise
The CReL framework can accurately optimize the reliability score inside the constructed prediction set despite the high-dimensional output space and nonconvexity of both the metric and the set.
What would settle it
An experiment where the empirical coverage of the constructed prediction sets falls significantly below the pre-specified confidence level on held-out data.
Figures


read the original abstract
Conditional generative models have recently achieved remarkable success in various applications. However, a suitable metric for evaluating the reliability of these models, which takes into account their inherent uncertainty, is still lacking. Existing metrics, which typically assess a single output, may fail to capture the variability or potential risks in generation. In this paper, we propose a novel evaluation metric called reliability score based on conformal prediction, which measures the worst-case performance within the prediction set at a pre-specified confidence level. However, computing this score is challenging due to the high-dimensional nature of the output space and the nonconvexity of both the metric function and the prediction set. To efficiently compute this score, we introduce Conformal ReLiability (CReL), a framework that can (i) construct the prediction set with desired coverage; and (ii) accurately optimize the reliability score within the constructed prediction set. We provide theoretical results on coverage and demonstrate empirically that our method produces more informative prediction sets than existing approaches. Experiments on synthetic data and the image-to-text and text-to-image tasks further demonstrate the interpretability of our new metric, and the validity and effectiveness of our computational framework. Source code can be found at https://ggc29.github.io/CReL/.
Editorial analysis
A structured set of objections, weighed in public.
Referee Report
Summary. The paper proposes a novel 'reliability score' evaluation metric for conditional generative models, derived from conformal prediction, that quantifies worst-case performance inside a prediction set at a user-specified confidence level. It introduces the CReL framework to (i) construct valid conformal prediction sets and (ii) optimize the reliability score inside those sets, despite acknowledged challenges of high-dimensional outputs and nonconvexity in both the metric and the set. Theoretical coverage guarantees are stated, and empirical results on synthetic data plus image-to-text and text-to-image tasks are used to argue that the sets are more informative and the metric is interpretable.
Significance. A well-supported conformal reliability metric could improve evaluation of generative models by explicitly incorporating uncertainty and worst-case behavior rather than single-point outputs. The coverage theory, if paired with a verifiable optimization procedure, would be a concrete strength.
major comments (1)
- [Abstract] Abstract: the assertion that CReL 'accurately optimize[s] the reliability score within the constructed prediction set' is load-bearing for the central claim yet unsupported; the abstract itself flags high-dimensional nonconvexity as the obstacle but supplies no optimizer description, convergence analysis, relaxation strategy, or verification that local minima do not invalidate the worst-case guarantee.
Simulated Author's Rebuttal
We thank the referee for the constructive comment on the abstract. We agree that the optimization claim requires clearer support and will revise accordingly.
read point-by-point responses
-
Referee: [Abstract] Abstract: the assertion that CReL 'accurately optimize[s] the reliability score within the constructed prediction set' is load-bearing for the central claim yet unsupported; the abstract itself flags high-dimensional nonconvexity as the obstacle but supplies no optimizer description, convergence analysis, relaxation strategy, or verification that local minima do not invalidate the worst-case guarantee.
Authors: We agree the abstract overstates the optimization without sufficient detail. The full manuscript (Section 4) describes the CReL optimization procedure, which employs a gradient-based method with multiple random initializations to mitigate nonconvexity and local minima in the high-dimensional setting. Empirical results on synthetic and real tasks provide practical verification that the obtained scores remain informative and the coverage guarantees hold. However, we acknowledge the absence of explicit convergence analysis or relaxation strategy. We will revise the abstract to briefly note the optimization approach used and add a short discussion in the main text on local-minima effects (with additional ablation experiments). This is a partial revision focused on clarity rather than altering the method. revision: partial
Circularity Check
No circularity: reliability score defined from external conformal prediction coverage; CReL optimization claims do not reduce to self-fit or self-citation.
full rationale
The paper defines the reliability score directly as the worst-case performance inside a conformal prediction set at a fixed coverage level, using the standard conformal guarantee that the true output lies in the set with probability at least 1-α. This construction is independent of any fitted parameter or prior result by the same authors. The CReL framework is presented as a computational procedure to build the set and optimize the score inside it; the abstract and description supply no equations showing that the optimized value is forced by construction from the inputs or from a self-citation chain. No self-definitional loop, fitted-input-as-prediction, or ansatz-smuggled-via-citation appears in the provided text. The derivation therefore remains self-contained against external conformal-prediction benchmarks.
Axiom & Free-Parameter Ledger
axioms (1)
- domain assumption Conformal prediction constructs sets with valid coverage under the exchangeability assumption on calibration and test points.
Reference graph
Works this paper leans on
-
[1]
doi: 10.1214/15-AOS1401. URL https://sciencespo. hal.science/hal-03567920. Esser, P., Kulal, S., Blattmann, A., Entezari, R., M¨uller, J., Saini, H., Levi, Y ., Lorenz, D., Sauer, A., Boesel, F., et al. Scaling rectified flow transformers for high-resolution image synthesis. InForty-first International Conference on Machine Learning,
-
[2]
Kingma, D. P. and Welling, M. Auto-encoding variational bayes.arXiv preprint arXiv:1312.6114,
work page internal anchor Pith review Pith/arXiv arXiv
-
[3]
Convergence Rate of Frank-Wolfe for Non-Convex Objectives
URL https://blackforestlabs.ai/ announcing-black-forest-labs/. Lacoste-Julien, S. Convergence rate of frank-wolfe for non-convex objectives.arXiv preprint arXiv:1607.00345,
work page internal anchor Pith review Pith/arXiv arXiv
-
[4]
On the generaliza- tion properties of diffusion models.Advances in Neural Information Processing Systems, 36:2097–2127,
Li, P., Li, Z., Zhang, H., and Bian, J. On the generaliza- tion properties of diffusion models.Advances in Neural Information Processing Systems, 36:2097–2127,
2097
-
[5]
Plassier, V ., Fishkov, A., Dheur, V ., Guizani, M., Taieb, S. B., Panov, M., and Moulines, E. Rectifying conformity scores for better conditional coverage.arXiv preprint arXiv:2502.16336, 2025a. Plassier, V ., Fishkov, A., Guizani, M., Panov, M., and Moulines, E. Probabilistic conformal prediction with approximate conditional validity. InInternational Co...
-
[6]
GIT: A Generative Image-to-text Transformer for Vision and Language
Wang, J., Yang, Z., Hu, X., Li, L., Lin, K., Gan, Z., Liu, Z., Liu, C., and Wang, L. Git: A generative image-to- text transformer for vision and language.arXiv preprint arXiv:2205.14100, 2022a. Wang, Z., Bovik, A. C., Sheikh, H. R., and Simoncelli, E. P. Image quality assessment: from error visibility to struc- tural similarity.IEEE transactions on image ...
work page internal anchor Pith review Pith/arXiv arXiv
-
[7]
Wang, Z., Gao, R., Yin, M., Zhou, M., and Blei, D. M. Prob- abilistic conformal prediction using conditional random samples.arXiv preprint arXiv:2206.06584, 2022b. Xu, C., Jiang, H., and Xie, Y . Conformal prediction for multi-dimensional time series by ellipsoidal sets. In Forty-first International Conference on Machine Learn- ing,
-
[8]
Algorithm Details In this section, we introduce our implementation of the V AE and the Stable Diffusion model
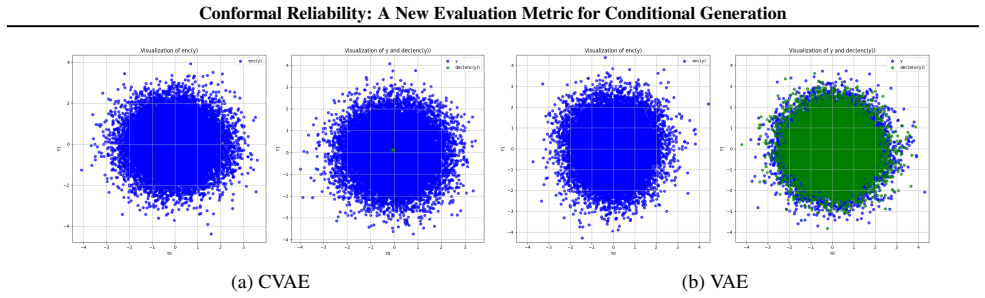
11 Conformal Reliability: A New Evaluation Metric for Conditional Generation A. Algorithm Details In this section, we introduce our implementation of the V AE and the Stable Diffusion model. A.1. Variational Auto Encoder The variational lower bound of the model is written as follows (Sohn et al., 2015): logp θ(Y)≥E qϕ(Z|Y) [logp θ(Y|Z)]−D KL (qϕ(Z|Y)∥p(Z)...
2015
-
[9]
The compactness follows from the compactness of RZ(X) and that γcal is bounded
(1) ≤α∥a 1 −z 1∥2 + (1−α)∥a 2 −z 2∥2 ≤γ, where “(1)” is due to the jointly convexity ofd(·,·) . The compactness follows from the compactness of RZ(X) and that γcal is bounded. B. Experimental Details B.1. Synthetic Data Details Linear data generation.The generation of the condition vector X and the response variable Y in thelinearversion of the synthetic ...
2048
-
[10]
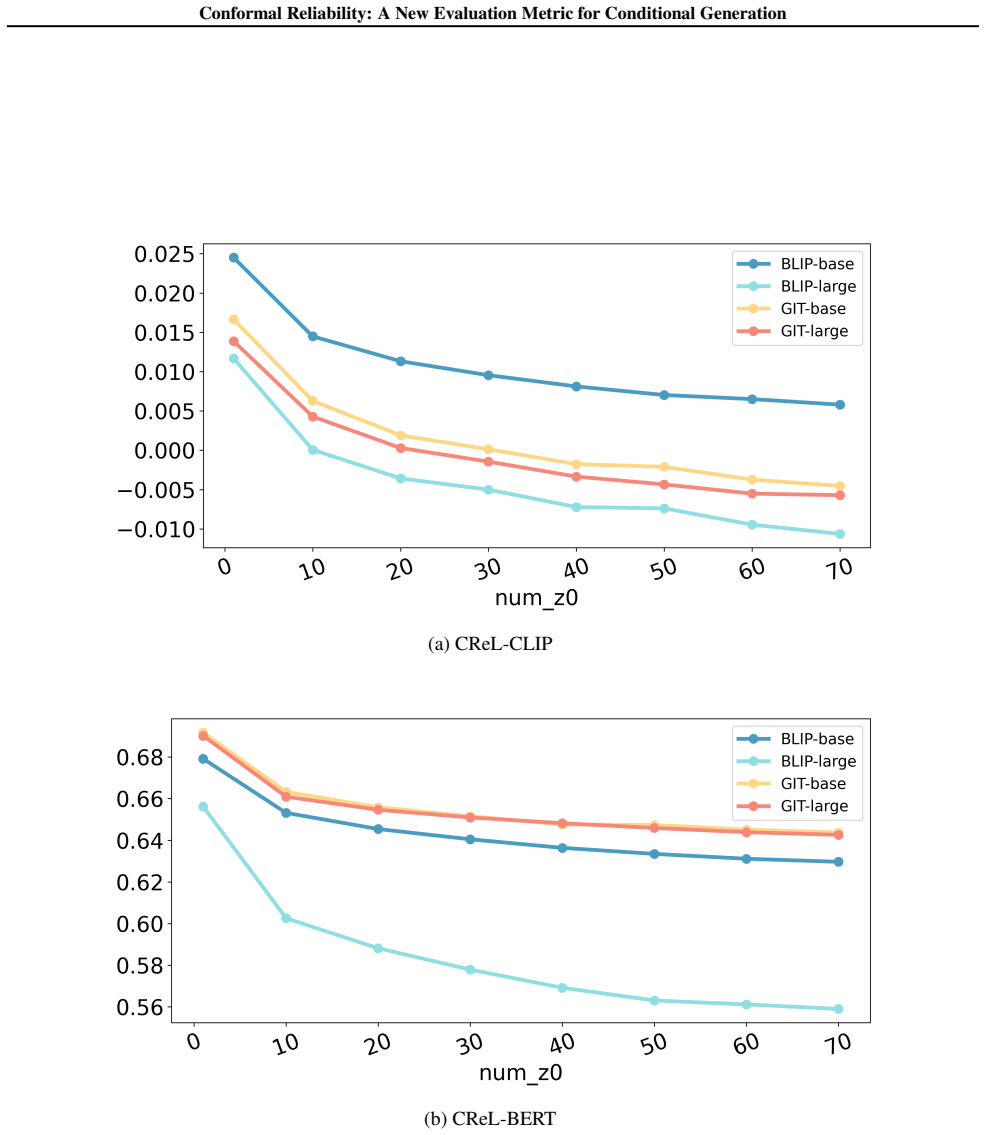
The standard deviation of the resulting CReL-CLIP score is 0.00027, indicating that the optimization is highly stable across random initializations
On the image-to-text task, we evaluate BLIP-base using CLIP-SIM with α= 0.1 and numz0 = 50 over 10 repeated runs. The standard deviation of the resulting CReL-CLIP score is 0.00027, indicating that the optimization is highly stable across random initializations. Table 13.Sensitivity of CReL-CLIP to random initialization on image-to-text evaluation. Task M...
2023
-
[11]
using alinearsynthetic dataset (generation details in Appendix B.1). We generaten= 50,000samplesp= 50andd= 20, and split them as follows: V AE training set:60% (30,000samples) DQR training set:24% (12,000samples) Calibration set:8% (4,000samples) Test set:8% (4,000samples) The calibration set is used to measure the runtime of both schemes. Implementation ...
2023
-
[12]
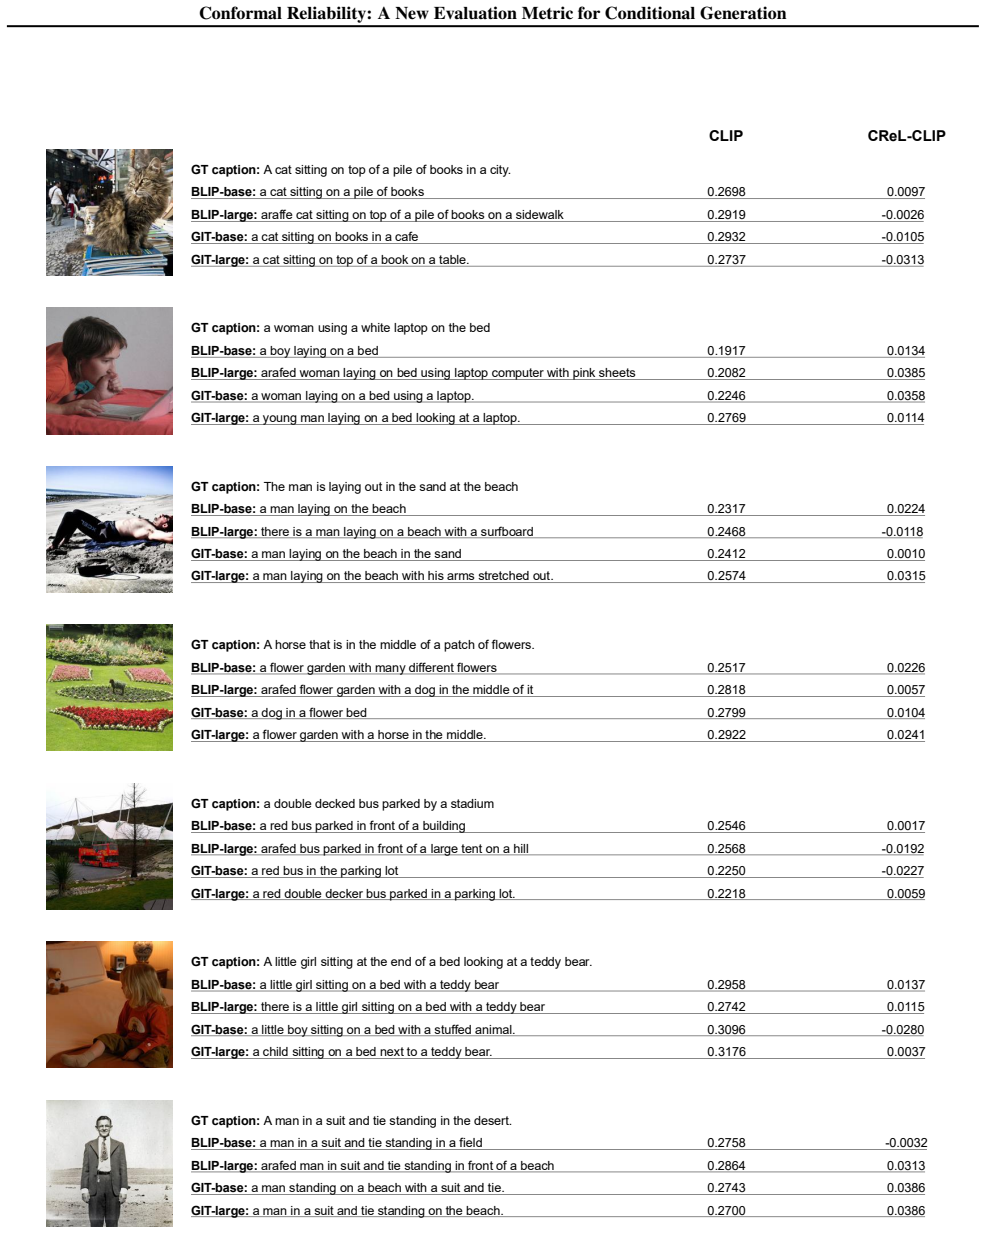
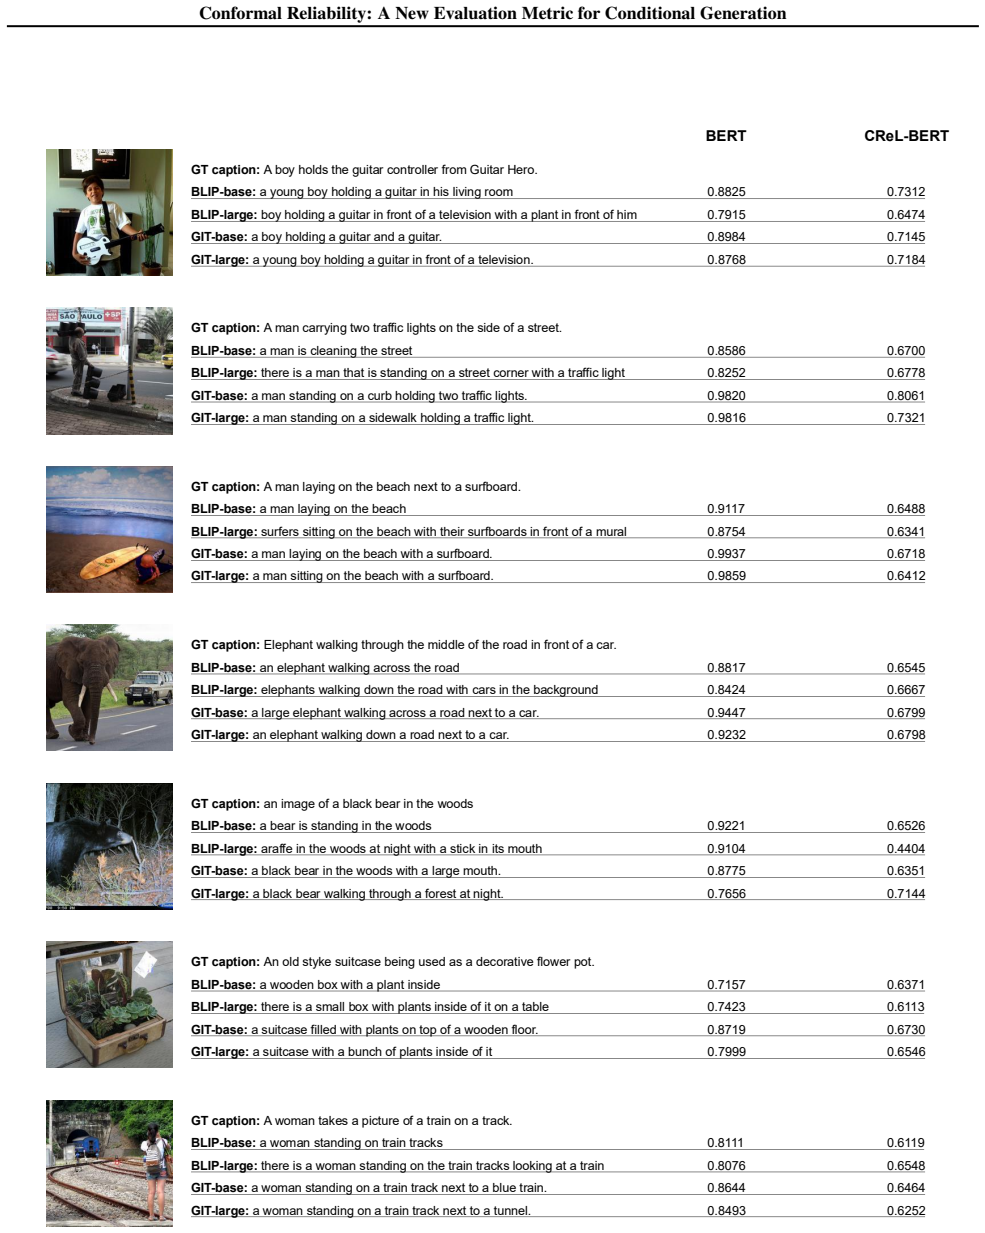
incurs significantly higher computational cost asrincreases. F. Additional Results F.1. Qualitative Results of Image-to-Text Task We provide additional qualitative examples for the image-to-text task. Figure 9 and Figure 10 present the results of CReL-CLIP and CReL-BERT underα= 0.1, respectively. F.2. Experiments on Text-to-Image Task Dataset and preproce...
2014
-
[13]
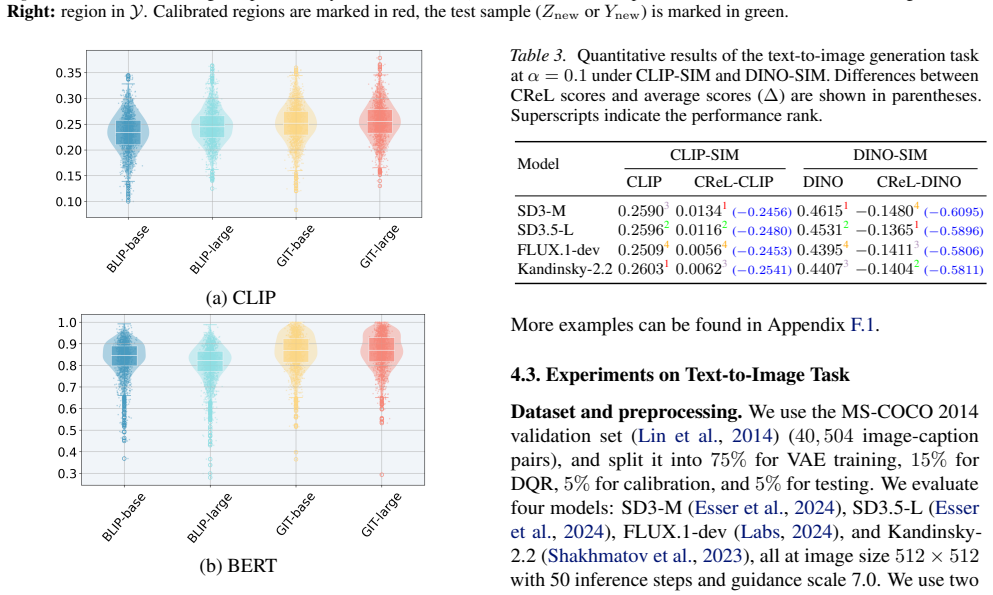
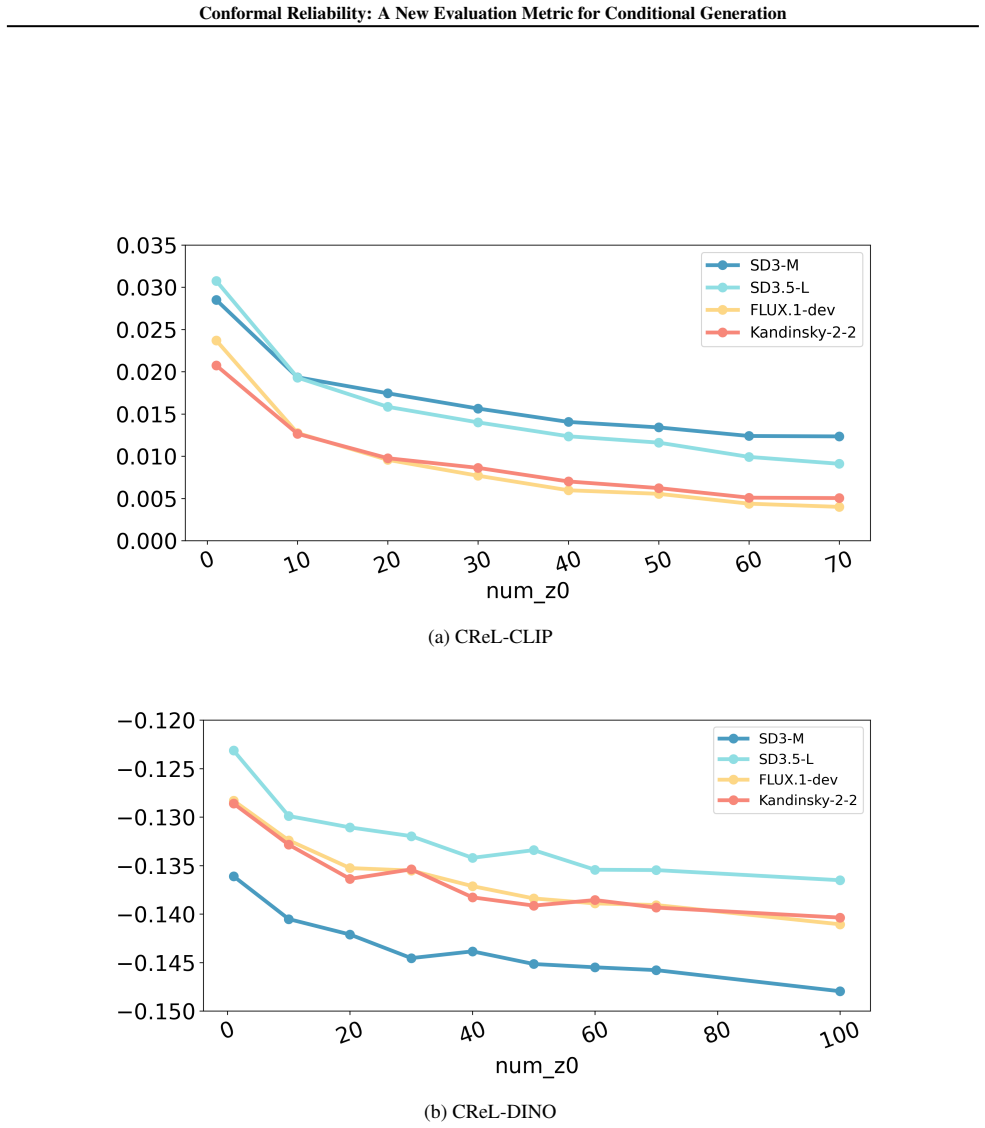
We evaluate four models: SD3-M (Esser et al., 2024), SD3.5-L (Esser et al., 2024), FLUX.1-dev (Labs, 2024), and Kandinsky-2.2 (Shakhmatov et al., 2023), all at image size 512×512
(40,504 image-caption pairs), and split it into 75% for V AE training,15% for DQR, 5% for calibration, and 5% for testing. We evaluate four models: SD3-M (Esser et al., 2024), SD3.5-L (Esser et al., 2024), FLUX.1-dev (Labs, 2024), and Kandinsky-2.2 (Shakhmatov et al., 2023), all at image size 512×512 . We use two metrics. CLIP-SIM is the cosine similarity...
2024
-
[14]
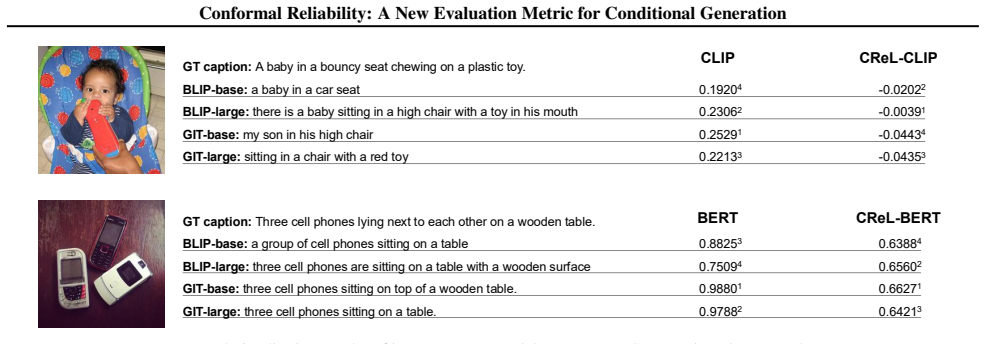
generates inconsistent content and SD3-M misses key semantics, FLUX.1-dev perfectly captures the scene and is accurately ranked first by CReL. These results demonstrate that CReL effectively detects fine-grained semantic discrepancies that standard metrics miss, quantifying model reliability without solely relying on average performance. 23 Conformal Reli...
1917
discussion (0)
Sign in with ORCID, Apple, or X to comment. Anyone can read and Pith papers without signing in.