REVIEW 3 major objections 6 minor 45 references
Optical losses as a function of beam position on the mirrors in a 285-m suspended Fabry-Perot cavity
T0 review · 3 major / 6 minor · reviewed 2026-08-11 · deepseek-v4-flash
Pith's one-line read Round-trip losses in a 285-m filter cavity vary from 42 to 87 ppm with beam position on the input mirror.
desk verdict The first credible position-resolved loss map of a 285-m filter cavity, with an overclaimed budget comparison that needs a residual-map check. read the letter →
The pith
A machine-rendered reading of the paper's core claim, the machinery that carries it, and where it could break.
The reading
What carries the argument
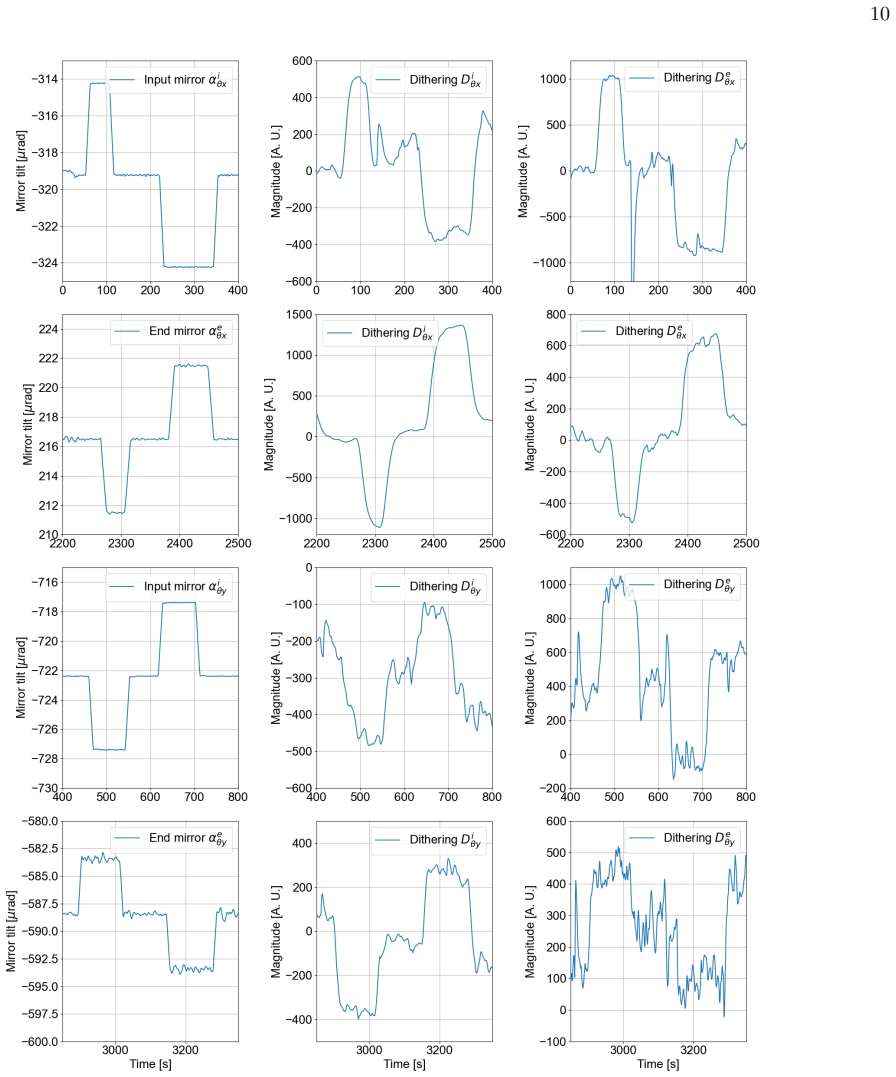
The argument is carried by an on-off resonance reflectivity measurement: with the infrared sub-carrier beam locked to the cavity, the ratio of reflected power on resonance to off resonance gives the round-trip loss via $L \simeq (T_1/2)(1-R_{\mathrm{cav}})/(1+R_{\mathrm{cav}})$, where $T_1 = 562 \pm 1$ ppm is the input mirror transmissivity. Around this sits an automated beam-scanning system: the green alignment beam is steered with two mirrors, wavefront-sensing loops re-point the cavity axis onto the beam, and the dithering technique converts the longitudinal control error into a calibrated readout of beam position on each mirror, letting the beam move on one mirror while staying fixed on the other. The predicted-loss comparison is assembled from three scattering regimes: small-angle scattering simulated with the Oscar FFT code from a Zygo flatness map, large-angle scattering from a CASI scatterometer raster scan scaled by a single representative angle-resolved scattering curve via Eq. (5), and middle-angle scattering from a power-law extrapolation of the surface power spectral density, with end-mirror transmission (3.9 ppm) added to reach the 30.3–39.3 ppm budget.
What would settle it
Measure the angle-resolved scattering (ARS) at several positions across the coated input mirror's scanned region using a spatially and angularly resolving scatterometer or an integrating-sphere scanner; if the angular dependence of ARS differs between points, the total-integrated-scattering map built by scaling a single ARS curve is wrong, and recomputing the predicted loss budget with the true map would show whether the 42 ppm measured minimum genuinely matches the 30.3–39.3 ppm prediction.
Extended reading notes
Core claim
The central claim is that round-trip losses in the Virgo filter cavity are a function of beam position: scanning the input mirror changes the measured loss from 42 ppm to 87 ppm, whereas the equivalent scan of the end mirror spans only 53 ppm to 61 ppm. The measurement, repeated ten times over ten days at three fixed points, is reproducible to better than ±4 ppm. The lowest measured losses, 42 ppm, sit slightly above the 30.3–39.3 ppm budget assembled from pre-installation mirror characterisation, which the authors take to mean that no major loss mechanism has been neglected; the higher losses at other positions are attributed to contamination introduced during cavity integration. The same automated scan locates a cavity axis position whose round-trip losses are among the lowest ever measured for a cavity of this scale.
Load-bearing premise
The predicted loss budget assumes that the angle-resolved scattering pattern measured at one representative point on the coated input mirror can be scaled to every point, even though micro-roughness, point defects, and contaminants scatter light differently.
Editorial extensions
If this is right
- Operating the Virgo filter cavity at the beam position that yields the minimum measured loss (42 ppm) gives round-trip losses among the lowest ever measured for a cavity of this scale.
- The closeness of the measured minimum to the pre-installation prediction indicates that the mirror characterisation pipeline (flatness maps, scatterometry, PSD extrapolation) captures the dominant loss mechanisms.
- The strong position dependence on the input mirror means that a single loss number is insufficient: loss budgets and quantum-noise projections for filter cavities must specify the beam position.
- The scan's repeatability below 4 ppm over ten days makes the method a practical diagnostic for localising contamination spots and for checking the effectiveness of in-situ cleaning techniques.
- For high-finesse filter cavities used in frequency-dependent squeezing, choosing the low-loss axis position directly improves the achievable squeezing for a given input power.
Reading between the lines
- The single-point scaling assumption behind the large-angle scattering map (Eq. 5) is the weakest link in the loss-budget closure; a spatially and angularly resolved scatterometer scan of the same input mirror would directly test it, and if the angular scattering varies across the surface the predicted 30.3–39.3 ppm could shift materially.
- The same beam-scanning method could be applied to the main arm cavities of current and future gravitational-wave detectors to re-optimise the cavity axis after installation or after contamination events, turning loss mapping into an operational tool rather than a one-time characterisation.
- The asymmetry between input and end mirror maps hints that coating or contamination state, rather than bulk substrate properties, drives the spatially varying losses; a mirror swap or a spatially resolved scatterometer check could confirm this.
- A natural extension is to monitor the loss map over months to quantify contamination growth rates and correlate loss spikes with vacuum or integration events.
Editorial analysis
A structured set of objections, weighed in public.
Referee Report
Summary. The paper reports an in-situ measurement of round-trip optical losses in the 285-m Virgo filter cavity as a function of the intra-cavity beam position on the two mirrors. Losses are inferred from the ratio of reflected power when the IR sub-carrier is on and off resonance, and the beam position is reconstructed using a calibrated dithering technique. The authors map a roughly 2-cm region on each mirror and find that the round-trip loss varies strongly with beam position on the input mirror (42-87 ppm) while remaining more uniform on the end mirror (53-61 ppm). Measurements repeated over ten days show repeatability with a statistical error below 4 ppm and an estimated systematic error of 1.3 ppm. The lowest measured loss is compared with a pre-installation budget built from small-angle scattering (Oscar simulation of a flatness map), large-angle scattering (CASI scatterometer with a single-angle scaling assumption), middle-angle scattering (PSD extrapolation), and end-mirror transmission, giving a predicted range of 30.3-39.3 ppm. The authors conclude that no major loss mechanism has been neglected and attribute the higher losses at some positions to contamination. Appendices provide the cavity-geometry relations and dithering calibration details.
Significance. If the measured loss map is accepted, this is a valuable experimental contribution: it provides the first precise loss-vs-position mapping of a 100-m-scale suspended Fabry-Perot cavity, with a carefully characterized measurement chain (repeatability over ten days, statistical error below 4 ppm, systematic error 1.3 ppm, beam-position uncertainty of 0.3 mm). The method is directly relevant to optimizing filter-cavity performance for frequency-dependent squeezing in current and future gravitational-wave detectors. However, the secondary claim that the pre-installation budget proves no major loss mechanism has been neglected is not supported at the same evidentiary level: the large-angle scattering term rests on an explicitly acknowledged scaling assumption in Eq. (5), and the comparison is made between a single global minimum and a broad predicted range rather than as a spatially resolved validation.
major comments (3)
- [Sec. VI, Eq. (5)] The large-angle scattering contribution to the predicted loss budget (15-24 ppm) is constructed by assuming that the angular dependence of ARS measured at one representative point (x0,y0) applies to every point on the mirror, so that TIS(x,y) is obtained by scaling with ARS(x,y;θ0,φ0). The authors themselves acknowledge in the same section that this assumption is problematic because micro-roughness, point defects, and contaminants scatter differently. Since the predicted range 30.3-39.3 ppm includes this term and the abstract and conclusions use the proximity of the 42 ppm minimum to this range to rule out missing loss mechanisms, Eq. (5) is load-bearing. The authors should either validate the assumption with angular-resolved measurements at several positions (for example with SPARSE or an integrating-sphere scanner) or explicitly refrain from the "no major loss mechanism neglected" conclusion.
- [Secs. V-VII] The comparison between measurement and prediction is made between a single global minimum (42 ppm) and a broad pre-installation range (30.3-39.3 ppm). The paper never overlays the predicted loss map on the measured RTL map: the small-angle map from Oscar (Fig. 4b), the large-angle map after convolution (Fig. 4d), and the middle-angle plus transmission terms are not combined into a spatial prediction that can be compared with Fig. 3. A point-by-point comparison, such as a residual map or a predicted-vs-measured scatter plot over the scanned region, would test whether the model explains the spatial structure of the measured losses rather than merely matching by chance at a single location. The authors should add such a comparison before using the closeness of the minimum to support the claim that no major loss mechanism is missing.
- [Table II] The expected-loss budget is reported as a range (30.3-39.3 ppm) with no uncertainty on the small-angle scattering (10 ppm), middle-angle scattering (1.4 ppm), or end-mirror transmission (3.9 ppm). The difference between the measured minimum (42 ppm) and the upper end of the predicted range (39.3 ppm) is only 2.7 ppm, which is likely within the combined uncertainty of the budget terms. The authors should state the uncertainty on each term and on the total budget before interpreting the agreement as evidence that no significant loss mechanism has been neglected.
minor comments (6)
- [Abstract and Sec. IV] The abstract reports a statistical error smaller than 4 ppm, while Sec. IV states that each individual measurement has a statistical error always below 1.4 ppm; the relationship between these two numbers (for example, day-to-day repeatability of the map) should be clarified.
- [Fig. 2(b)] The horizontal spread in the reconstructed end-mirror positions is attributed to piezo hysteresis, but the text does not state how this systematic effect propagates into the RTL map uncertainty; please quantify or explicitly bound its impact.
- [Sec. VI, Eq. (4)] The integration lower limit θ_min is not specified; please define it (presumably the CASI lower-angle limit near 3 degrees) and state the numerical value used in the TIS calculation.
- [Sec. VI, middle-angle paragraph] The sentence "we use extrapolate the mirror surface power spectral density" contains a grammatical error and should be rewritten.
- [Footnote 28] The footnote qualifying the statement that the GR and IR beams share the same cavity axis should be expanded or moved into the main text, as it bears on the assumed beam-size scaling between the two wavelengths.
- [Fig. 2(c)] A table listing the numerical RTL values and uncertainties for the three repeated points would be easier to read than the plotted data alone, which is given without error bars in the figure.
Circularity Check
No significant circularity: the measured RTL map and the pre-installation loss budget use independent data; the 42 ppm vs 30.3-39.3 ppm comparison is a comparison, not a fit.
full rationale
The central measurement (Sec. IV-V) extracts round-trip losses from the on/off resonance reflected-power ratio via Eq. (1), with the input-mirror transmissivity T1 = 562 +/- 1 ppm taken from an independent LMA coating measurement [29], not from the measured RTL values. The pre-installation budget (Sec. VI) is built from separate mirror characterizations: Oscar small-angle scattering from the post-polishing flatness map, middle-angle scattering from a PSD power-law extrapolation, and large-angle scattering from CASI scatterometer maps via Eq. (5). None of these inputs uses the in-situ RTL map, so the 30.3-39.3 ppm prediction is not a refit of the 42 ppm measured minimum. The paper's own caveat that Eq. (5)'s same-angular-dependence assumption is 'problematic' is a robustness concern about the predicted budget, not a circularity. Citations to earlier work by the same group [19], [21], [31] supply method and context (on/off resonance readout, filter-cavity setup, loss-estimation formalism), but the load-bearing result does not reduce to those citations; the method is standard and is checked against external characterization data. No fitted parameter is renamed as a prediction, and no uniqueness theorem or ansatz is imported to force the choice. Overall circularity score 1 reflects only minor, non-load-bearing self-citations.
Assumptions & free parameters
free parameters (1)
- PSD power-law slope/intercept for middle-angle extrapolation =
not stated numerically
assumptions (5)
- standard math Small-loss approximation in Eq. (1) relating on/off reflected power to round-trip losses
- domain assumption Micro-polished mirror surfaces are self-affine, so the 1D PSD can be extrapolated as a straight line into the missing middle-angle frequency band
- domain assumption Angle-resolved scattering has the same angular shape at every point on the coated mirror, so a single TIS(x0,y0) can be scaled by ARS(x,y)/ARS(x0,y0)
- domain assumption Waviness map measured after polishing remains valid after coating (only ROC changes by 0.34%)
- standard math TIS = (4*pi*sigma/lambda)^2 is valid under the Rayleigh smooth-surface criterion
Cite this review
Pith. "Pith review of Optical losses as a function of beam position on the mirrors in a 285-m suspended Fabry-Perot cavity." pith.science (2026). https://pith.science/paper/B2UFAGGX
@misc{pith2026241202180,
  author       = {Pith},
  title        = {Pith review of: Optical losses as a function of beam position on the mirrors in a 285-m suspended Fabry-Perot cavity},
  year         = {2026},
  howpublished = {\url{https://pith.science/paper/B2UFAGGX}},
  note         = {Machine review of arXiv:2412.02180}
}
read the original abstract
Reducing optical losses is crucial for reducing quantum noise in gravitational-wave detectors. Losses are the main source of degradation of the squeezed vacuum. Frequency dependent squeezing obtained via a filter cavity is currently used to reduce quantum noise in the whole detector bandwidth. Such filter cavities are required to have high finesse in order to produce the optimal squeezing angle rotation and the presence of losses is particularly detrimental for the squeezed beam, as it does multiple round trip within the cavity. Characterising such losses is crucial to assess the quantum noise reduction achievable. In this paper we present an in-situ measurement of the optical losses, done for different positions of the beam on the mirrors of the Virgo filter cavity. We implemented an automatic system to map the losses with respect to the beam position on the mirrors finding that optical losses depend clearly on the beam hitting position on input mirror, varying from 42 ppm to 87 ppm, while they are much more uniform when we scan the end mirror (53 ppm to 61 ppm). We repeated the measurements on several days, finding a statistical error smaller than 4 ppm. The lowest measured losses are not much different with respect to those estimated from individual mirror characterisation performed before the installation (30.3 - 39.3 ppm). This means that no major loss mechanism has been neglected in the estimation presented here. The larger discrepancy found for some beam positions is likely to be due to contamination. In addition to a thorough characterisation of the losses, the methodology described in this paper allowed to find an optimal cavity axis position for which the cavity round trip losses are among the lowest ever measured. This work can contribute to achieve the very challenging losses goals for the optical cavities of the future gravitational-wave detectors.
Figures


Figures from the paper (5 more)


Reference graph
Works this paper leans on
-
[1]
J. Aasi, B. Abbott, R. Abbott, T. Abbott, M. Aber- nathy, K. Ackley, C. Adams, T. Adams, P. Addesso, R. Adhikari, et al. , Advanced ligo, Classical and quan- tum gravity 32, 074001 (2015)
2015
-
[2]
F. a. Acernese, M. Agathos, K. Agatsuma, D. Aisa, N. Allemandou, A. Allocca, J. Amarni, P. Astone, G. Balestri, G. Ballardin, et al. , Advanced virgo: a second-generation interferometric gravitational wave de- tector, Classical and Quantum Gravity 32, 024001 (2014)
work page 2014
-
[3]
Y. Aso, Y. Michimura, K. Somiya, M. Ando, O. Miyakawa, T. Sekiguchi, D. Tatsumi, H. Yamamoto, K. Collaboration, et al. , Interferometer design of the ka- gra gravitational wave detector, Physical Review D 88, 11 043007 (2013)
work page 2013
- [4]
-
[5]
M. Punturo, M. Abernathy, F. Acernese, B. Allen, N. An- dersson, K. Arun, F. Barone, B. Barr, M. Barsug- lia, M. Beker, et al. , The einstein telescope: a third- generation gravitational wave observatory, Classical and Quantum Gravity 27, 194002 (2010)
work page 2010
-
[6]
K. Ackley, V. Adya, P. Agrawal, P. Altin, G. Ash- ton, M. Bailes, E. Baltinas, A. Barbuio, D. Beniwal, C. Blair, et al. , Neutron star extreme matter observa- tory: A kilohertz-band gravitational-wave detector in the global network, Publications of the Astronomical Society of Australia 37, e047 (2020)
work page 2020
-
[7]
P. Kwee, J. Miller, T. Isogai, L. Barsotti, and M. Evans, Decoherence and degradation of squeezed states in quan- tum filter cavities, Physical Review D 90, 062006 (2014)
2014
-
[8]
H. Miao, N. D. Smith, and M. Evans, Quantum limit for laser interferometric gravitational-wave detectors from optical dissipation, Physical Review X 9, 011053 (2019)
work page 2019
Show all 45 references
-
[9]
Wilson and J
S. Wilson and J. McNeil, Neutral ion beam figuring of large optical surfaces, in Optical Fabrication and Testing (Optica Publishing Group, 1987) p. F AA4
1987
-
[10]
A. F. Brooks, G. Vajente, H. Yamamoto, R. Abbott, C. Adams, R. X. Adhikari, A. Ananyeva, S. Appert, K. Arai, J. S. Areeda, et al., Point absorbers in advanced ligo, Applied Optics 60, 4047 (2021)
2021
-
[11]
K. E. Gushwa and C. I. Torrie, Coming clean: under- standing and mitigating optical contamination and laser induced damage in advanced ligo, in Laser-Induced Dam- age in Optical Materials: 2014 , Vol. 9237 (SPIE, 2014) p. 923702
2014
-
[12]
Tanioka and Y
S. Tanioka and Y. Aso, Optical loss study of the cryo- genic molecular layer using a folded cavity for future gravitational-wave detectors, Optics Express 29, 6780 (2021)
2021
-
[13]
Tanioka, K
S. Tanioka, K. Hasegawa, and Y. Aso, Optical loss study of molecular layer for a cryogenic interferomet- ric gravitational-wave detector, Physical Review D 102, 022009 (2020)
2020
-
[14]
M. T. P. R. Federico Paoletti, Irene Fiori and G. Bal- lardin, The charge of the mirrors in a nutshell, https:// tds.virgo-gw.eu/?content=3&r=21593 (2023), [Virgo TDS code: VIR-0130A-23]
2023
-
[15]
D. K. S. F.-F. P. G. R. T. Rochus, Laser optics in space failure risk due to laser induced contamination, CEAS Space Journal 9 (2017)
2017
-
[16]
H. Cui, B. Li, S. Xiao, Y. Han, J. Wang, C. Gao, and Y. Wang, Simultaneous mapping of reflectance, trans- mittance and optical loss of highly reflective and anti- reflective coatings with two-channel cavity ring-down technique, Optics Express 25, 5807 (2017)
2017
-
[17]
Truong, G
G.-W. Truong, G. Winkler, T. Zederbauer, D. Bach- mann, P. Heu, D. Follman, M. White, O. Heckl, and G. Cole, Near-infrared scanning cavity ringdown for opti- cal loss characterization of supermirrors, Optics Express 27, 19141 (2019)
2019
-
[18]
Gutierrez, J
N. Gutierrez, J. Degallaix, D. Hofman, C. Michel, L. Pinard, J. Morville, R. Battesti, and G. Cagnoli, Op- tical characterization of high performance mirrors based on cavity ringdown time measurements with 6 degrees of freedom mirror positioning, Review of Scientific Instru- m...
2023
-
[19]
Capocasa, Y
E. Capocasa, Y. Guo, M. Eisenmann, Y. Zhao, A. To- mura, K. Arai, Y. Aso, M. Marchi` o, L. Pinard, P. Prat, et al., Measurement of optical losses in a high-finesse 300 m filter cavity for broadband quantum noise reduction in gravitational-wave detectors, Physical Review D 98, ...
2018
-
[20]
Drori, J
Y. Drori, J. Eichholz, T. Edo, H. Yamamoto, Y. Enomoto, G. Venugopalan, K. Arai, and R. X. Ad- hikari, Scattering loss in precision metrology due to mir- ror roughness, JOSA A 39, 969 (2022)
2022
-
[21]
Acernese, M
F. Acernese, M. Agathos, A. Ain, S. Albanesi, C. All´ en´ e, A. Allocca, A. Amato, C. Amra, M. Andia, T. Andrade, et al. , Frequency-dependent squeezed vacuum source for the advanced virgo gravitational-wave detector, Physical review letters 131, 041403 (2023)
2023
-
[22]
Ganapathy, W
D. Ganapathy, W. Jia, M. Nakano, V. Xu, N. Aritomi, T. Cullen, N. Kijbunchoo, S. Dwyer, A. Mullavey, L. Mc- Culler, et al. , Broadband quantum enhancement of the ligo detectors with frequency-dependent squeezing, Phys- ical Review X 13, 041021 (2023)
2023
-
[23]
E. A. Donley, T. P. Heavner, F. Levi, M. Tataw, and S. R. Jefferts, Double-pass acousto-optic modulator sys- tem, Review of Scientific Instruments 76 (2005)
2005
-
[24]
E. D. Black, An introduction to pound–drever–hall laser frequency stabilization, American journal of physics 69, 79 (2001)
2001
-
[25]
Morrison, B
E. Morrison, B. J. Meers, D. I. Robertson, and H. Ward, Automatic alignment of optical interferometers, Applied Optics 33, 5041 (1994)
1994
-
[26]
Heinzel, A
G. Heinzel, A. R¨ udiger, R. Schilling, K. Strain, W. Win- kler, J. Mizuno, and K. Danzmann, Automatic beam alignment in the garching 30-m prototype of a laser- interferometric gravitational wave detector, Optics com- munications 160, 321 (1999)
1999
-
[27]
Yu et al
H. Yu et al. , Astrophysical signatures of neutron stars in compact binaries and experimental improvements on gravitational-wave detectors, Ph.D. thesis, Massachusetts Institute of Technology (2019)
2019
-
[28]
This might be not exactly true as the mirrors are not perfectly spherical and the GR beam dimension is larger by a factor √ 2
-
[29]
L. Pinard, Input Mirror Characterization Advanced Virgo + Filter Cavity Reference LMA : C20083 + C20087, https://tds.virgo-gw.eu/?content=3&r= 18118 (2021), [Virgo TDS code: VIR-1103B-20]
2021
-
[30]
E. O. LEBIGOT, Uncertainties: a Python package for calculations with uncertainties, http://pythonhosted. org/uncertainties/ (2022)
2022
-
[31]
Capocasa, M
E. Capocasa, M. Barsuglia, J. Degallaix, L. Pinard, N. Straniero, R. Schnabel, K. Somiya, Y. Aso, D. Tat- sumi, and R. Flaminio, Estimation of losses in a 300 m filter cavity and quantum noise reduction in the ka- gra gravitational-wave detector, Physical Review D 93, 082004 (2016)
2016
-
[32]
Straniero, J
N. Straniero, J. Degallaix, R. Flaminio, L. Pinard, and G. Cagnoli, Realistic loss estimation due to the mirror surfaces in a 10 meters-long high finesse fabry-perot filter- cavity, Optics express 23, 21455 (2015)
2015
-
[33]
With the exception of a change in the overall radius of curvature (for example the Virgo filter cavity mirrors are found to be 0.34% more curved after coating)
-
[34]
Degallaix, Oscar: A matlab based package to simulate 12 realistic optical cavities, SoftwareX 12, 100587 (2020)
J. Degallaix, Oscar: A matlab based package to simulate 12 realistic optical cavities, SoftwareX 12, 100587 (2020)
2020
-
[35]
Schr¨ oder, S
S. Schr¨ oder, S. Gliech, and A. Duparr´ e, Measurement system to determine the total and angle-resolved light scattering of optical components in the deep-ultraviolet and vacuum-ultraviolet spectral regions, Applied optics 44, 6093 (2005)
2005
-
[36]
Lequime, M
M. Lequime, M. Zerrad, C. Deumi´ e, and C. Amra, A goniometric light scattering instrument with high- resolution imaging, Optics Communications 282, 1265 (2009)
2009
-
[37]
Bolliand, E
A. Bolliand, E. Hartmann, M. Lequime, M. Zerrad, and C. Amra, A new spatially and angularly resolved scat- terometer, in Optical Interference Coatings (Optica Pub- lishing Group, 2022) pp. ThB–7
2022
-
[38]
T. D. Jacobs, T. Junge, and L. Pastewka, Quantita- tive characterization of surface topography using spectral analysis, Surface Topography: Metrology and Properties 5, 013001 (2017)
2017
-
[39]
It requires 4πσ cos θi λ 2 ≪ 1
We can use this formula as the The Rayleigh smooth- surface criterion [45]is verified. It requires 4πσ cos θi λ 2 ≪ 1. In our case the incident angle θi = 0, so that the value is about 10 −5
-
[40]
D. Coyne, Brief Description and Results of a Balanced- Ion, Nitrogen Gas Jet for Particulate Removal from In-Vacuum Optical Surfaces, https://dcc.ligo.org/ LIGO-G1601393 (2016), [Virgo TDS code: LIGO- G1601393-v1]
2016
-
[41]
Since the effect of mirror tilts around the two axes orthog- onal to the beam direction will have identical expressions we consider here only one case
-
[42]
Bassan et al
M. Bassan et al. , Advanced interferometers and the search for gravitational waves, Astrophysics and Space Science Library 404, 275 (2014)
2014
-
[43]
R. C. Walet, Advanced instrumentation for gravitational- wave research, Ph.D. thesis, Vrije University Amsterdam (2022)
2022
-
[44]
Here the superscript i and e refer to the input and to the end mirror respectively while the subscript θx and θy refer to the angular positron change around the x or the y axis of the mirrors
-
[45]
J. C. Stover, Optical scattering. measurement and anal- ysis (eq. 3.43 and eq. 3.46), SPIE Press Volume (1995)
1995
Reviewed August 11, 2026 · model on record in the stance chip above.
Discussion (0). Continue with ORCID to comment.